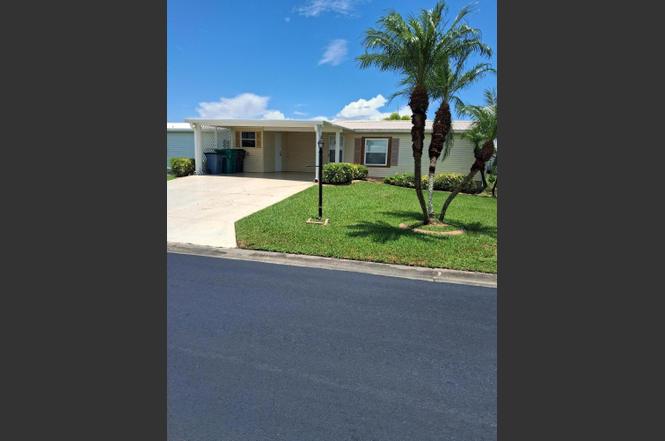
1660 SW 35 Cir · Okeechobee, FL
Flood risk 1/10 · Minimal
- FEMA flood zone
- X (shaded)
- Chance of flooding over 30 yrs
- 0.0%
- Est. flood insurance / yr
- $507 – $1,088
Fire risk 4/10 · Minor
- Est. fire insurance / yr
- $947 – $1,759
Heat risk 9/10 · Severe
- Hot days now (above 108°F)
- 7 days/yr
- Hot days in 30 yrs
- 24 days/yr
Wind risk 10/10 · Severe
- Chance of severe wind over 30 yrs
- 99.0%
Air-quality risk 2/10 · Minimal
- Unhealthy air days now
- 1 days/yr
- Unhealthy air days in 30 yrs
- 2 days/yr
Risk factors via First Street. Map © Google.
Why this score? — see what drove the D- grade
The composite is a weighted blend of 9 inputs, each scored 0–100. Each bar is that input's sub-score; the figure is the points it added to the 100-point composite (weight × sub-score).
- Cash flow +12.6/30.0
- Livability +3.9/5.0
- DSCR +3.7/10.0
- 1% rule +3.6/10.0
- Schools +3.6/10.0
- ARV discount +3.5/15.0
- Rent growth +2.5/5.0
- Condition / age +2.5/5.0
- Appreciation +0.0/10.0
$160,000
🖨 Deal sheet 📄 Offer letter ✓ Due diligence
Listing remarks
SEMINOLE COVE 2/2 Just Reduced, partially furnished with 2 Master Suites and large closets. All the appliances are less than 2 years old (except stove that is 4 years old) AC unit is 2 years old. New windows. No steps to enter and covered carport for 2 vehicles. Rear enclosed patio with vinyl windows. Active retirement community that is close to shopping, restaurants and Lake Okeechobee. Measure room sizes for accuracy MAKE OFFER
Key facts
- Close to restaurants
- Covered carport
- Large closets
Tags
Property features AI
Finance
- Other: Paved road frontage; Not waterfront
- Financial info: Pets allowed with breed restrictions; Senior community
- HOA & community: Has association with monthly fee; Association amenities include clubhouse, shuffleboard court, and storage; Monthly association fee
Exterior
- Parking: Covered carport (2 spaces); 2 open parking spaces
- Security: Smoke detectors; Gated community (no guard)
- Utilities: Public water; Public sewer; Three-phase electric service; Cable available
- Home design: Manufactured home; Single-story; Faces west; Resale condition
- Construction: Vinyl siding; Modular construction; Metal roof; Aluminum skirting; Approximately 1,000 sq ft living area
- Exterior features: Front porch
Interior
- Kitchen: Electric range; Microwave; Refrigerator; Electric water heater
- Bedrooms: 2 bedrooms on the main level
- Flooring: Carpet; Laminate
- Bathrooms: 2 full bathrooms on the main level
- Heating & cooling: Central heating; Ceiling fans; Electric cooling with reverse cycle
- Interior features: Walk-in closets; Split bedroom layout; Partially furnished; Blinds and drapes
- Laundry & utility: Laundry areas both inside and outside
Neighborhood map
What this means for you Summary
Snapshot
- This is a 2-bed/2.0-bath manufactured listed at $160k.
Deal economics
- At list price, monthly cash flow is $-22 ($-262/yr) — negative.
- To cash-flow at today's rent, offer at most $156k (2.4% below list).
- To meet the 1% rule (rent ≥ 1% of price), the offer needs to be $137k (14.1% below list).
- Recommended offer: $137k (14.1% below list) — sets the bar for 1% rule.
- Cap rate 6.1% vs local median 4.3% in Okeechobee — top-decile yield for the area; either an underpriced asset or a hidden risk that comps aren't pricing in. Stress-test before assuming the spread holds.
Location & tenants
- Location reads 77/100 on livability (#210 in FL, #3,234 nationally) — a middle-class / working-renter tenant base. Strengths: cost of living A+, housing A+, health & safety A+; Watch: employment C-, amenities F, commute F.
- Okeechobee (town): math 44% / reading 42% proficiency, ranked #58 of 73 in FL (top 80%) — families likely to look elsewhere, expect single-tenant / working-renter base with shorter leases; 72% free/reduced lunch — lower-income household profile, screen leases tightly.
- Market conditions: 402 active listings in the ZIP; 18 units permitted in Okeechobee County in 2024 (0 in 5+ unit buildings).
- This rent runs 31% of the median local income ($53k/yr) — at the standard rent-burdened threshold; future hikes will face affordability resistance.
Forward outlook
- Local home prices are declining (-3.0%/yr); year-one equity from $1k of loan paydown is wiped out by about $5k of value loss. Plan a longer hold.
- Okeechobee County population projected at -21% by 2050 — secular population decline; favor cash flow + early exit over multi-decade hold.
Negotiation context
- It's been on market 338 days — a 12% lower offer ($141k) is reasonable based on typical stale-listing flexibility.
- 2 sale attempts; this cycle's ask has dropped $20k (11%) from the opening price — seller is motivated, your offer sets the floor, not the list.
- Current owner paid $130k; 23% above their basis — modest negotiation headroom, anchor on the comps not their cost.
Risks & watch-outs
- Climate carrying-cost: severe wind risk, 99% chance of damaging wind over 30y; extreme-heat days projected 7→24/yr by 2055 (HVAC capex compounding) — expect insurance premiums to compound above CPI over the hold.
Questions for the listing agent
- What do current leases actually rent for vs. the listed asking? Can we see a recent rent roll and the last 12 months of T-12 income?
- It's been on market 338 days. Have you received any prior offers? Is the seller open to a 14% concession, seller financing, or rate buy-down credit?
- What does the HOA fee cover, when was the last increase, and are there any pending special assessments or reserve-fund shortfalls?
- Why hasn't it sold? Are there any deal-killer items the seller is aware of (foundation, flood, title, zoning, code violations)?
- Is there a deadline driving the sale (1031 exchange, divorce, estate, relocation)? That informs how much negotiation room exists.
- The area grade is low — what's the realistic commute time and amenity access for the typical tenant pool here? Any planned neighborhood developments (good or bad) we should know about?
- What's the average days-on-market for RENTAL listings here right now (not sales)? A rising rental-DOM trend means longer vacancies and softer asking-rent achievability than the comps imply.
- What's the recent tenant-quality profile in this submarket — average credit score on applications, eviction rate, late-payment / NSF rate, and stable-employment percentage? A property-management company in the area should have these aggregated.
- How much new for-sale + rental construction is in the pipeline within 1–3 miles? Heavy new supply typically softens prices + rents 12–24 months out; constrained supply supports both.
Investment metrics
- 1% rule
- 0.86% ✗
- Cap rate
- 6.13%
- Cash-on-cash
- -0.58%
- DSCR
- 0.97
- GRM
- 9.7
CMA / ARV
- ARV (on-the-fly)
- $147,000
- Comps found
- 3
Show comp detail 3 sales within ~0.75 mi
| Address | Dist | Beds/Ba | Sqft | Sold | Price | $/sf | Match |
|---|---|---|---|---|---|---|---|
| 1692 SW 35th Cir | 0.14mi | 2/2.0 | 1,078 (+8%) | 2mo | $159,000 | $147 | 79 |
| 4330 SW 13th Ave | 0.40mi | 2/2.0 | 1,054 (+5%) | 22mo | $166,250 | $158 | 54 |
| 1517 SW 35th Cir | 0.43mi | 2/2.0 | 1,150 (+15%) | 20mo | $160,000 | $139 | 39 |
Match score weights: distance 35% · size 25% · config 20% · recency 20%. Top-matched comps best support the ARV.
Projected returns pro-forma
-3.0% appreciation · 3.0% rent growth · sell at horizon
- IRR
- -17.2%
- Equity multiple
- 0.39×
- Total profit
- $-27,294
- Equity at exit
- $23,857
- IRR
- -9.2%
- Equity multiple
- 0.43×
- Total profit
- $-25,467
- Equity at exit
- $13,834
Cash invested: $44,800 (down + closing). Projections, not guarantees.
Landlord ↔ Tenant lean methodology
- Overall (STATE)
- 87 Strongly Landlord-Friendly
- State Florida
- 87 Strongly Landlord-Friendly · R+3
- County
- — inherits STATE
- City
- — inherits STATE
ZIP-level market 34974
- Home prices YoY
- -15.6%
- Active inventory
- 402
- Price-to-rent
- 9.7×
Monthly cashflow live
- Estimated rent
- $1,375 medium interval (Pro) →
- Mortgage (P&I)
- −$839
- Tax from tax record
- −$88 /mo · $1,058/yr
- Insurance
- −$67
- HOA
- −$114
- Vacancy / Maint / Mgmt
- −$289
- Net cashflow
- $-22
Break-even live
UW: 25.0% down · 7.5% · 30yr · 1.5% tax · 5.0% vac · 8.0% maint · 8.0% mgmt
Financing live
Cash to close
- Down payment
- $40,000
- Closing costs
- $4,800
- Reserves months
- —
- Total cash needed
- —
Loan-product check · same deal, 3 products live
Conventional
25% down · 7.5% · 30yr
- Down + closing
- —
- Monthly P&I
- —
- Monthly cashflow
- —
- DSCR
- —
- Eligible?
- —
Personal DTI + credit; lowest rate.
DSCR
20% down · 8.5% · 30yr
- Down + closing
- —
- Monthly P&I
- —
- Monthly cashflow
- —
- DSCR
- —
- Eligible?
- —
No personal income docs; deal must DSCR.
Hard money
10% down · 12.0% · 12mo
- Down + closing
- —
- Monthly P&I
- —
- Monthly cashflow
- —
- DSCR
- —
- Eligible?
- —
Short-term bridge; refi at stabilization.
HOA detail
- Monthly dues
- $114 · $1,368/yr
Listing history 25 events
-
2026-06-19days on market $160,000 Active 338 DOM
-
2026-06-18days on market $160,000 Active 337 DOM
-
2026-06-17days on market $160,000 Active 336 DOM
-
2026-06-16days on market $160,000 Active 335 DOM
-
2026-06-15days on market $160,000 Active 334 DOM
-
2026-06-14days on market $160,000 Active 332 DOM
-
2026-06-10days on market $160,000 Active 329 DOM
-
2026-06-09days on market $160,000 Active 328 DOM
-
2026-06-08days on market $160,000 Active 327 DOM
-
2026-06-07days on market $160,000 Active 326 DOM
-
2026-06-05days on market $160,000 Active 323 DOM
-
2026-06-03days on market $160,000 Active 322 DOM
-
2026-06-02days on market $160,000 Active 321 DOM
-
2026-06-01days on market $160,000 Active 320 DOM
-
2026-05-31days on market $160,000 Active 319 DOM
-
2026-05-30days on market $160,000 Active 318 DOM
-
2026-04-24price $160,000
-
2026-01-03status Active
-
2026-01-03historical
-
2025-11-05price $170,000
-
2025-07-15$180,000 Active
-
2023-03-21soldstatus $130,000
-
2007-01-26soldstatus $72,000
-
2003-05-28soldstatus $67,000
-
1999-11-19soldstatus $37,000
ⓘ Source: listings_history table (triggers on properties + properties_extension) + one-shot
backfill from property_details.listing_events for pre-trigger history.
Tax reassessment forecast FL · Resets to sale price
- Current annual tax
- $1,058 · $88/mo
- Projected year-2 tax
- $1,328 · $111/mo
- Expected delta
- +$270/yr (+$22/mo · 25.5%)
ⓘ Screening estimate from a state-policy table — verify with the county assessor before closing.
Climate risk First Street
- Flood 1/10 Low FEMA zone X (shaded) · 0% chance over 30 yrs
- Wildfire 4/10 Moderate
- Heat 9/10 Extreme 7 d/yr ≥108°F today · 24 d/yr by 30 yrs out
- Wind 10/10 Extreme 99% chance of damaging wind over 30 yrs
- Air quality 2/10 Low 1 unhealthy d/yr today · 2 by 30 yrs out
Nearby sold comps map
Loading sold comps map…
Walkable amenities ~0.75 mi
Loading nearby amenities…
Taxation est. · year 1
- Rental income
- $16,497
- − Mortgage interest
- −$8,962
- − Property taxes
- −$1,058
- − Insurance
- −$800
- − Repairs & maintenance
- −$1,320
- − Management
- −$1,320
- − HOA
- −$1,368
- − Depreciation
- −$4,655
- Taxable loss
- −$2,985
- Est. tax savings @ 24.0%
- +$716
- After-tax cash flow
- $455/yr
For passive investors: Depreciation is non-cash, so a rental often shows a tax loss while cash-flowing — sheltering income. Rental losses are passive: they offset passive income freely, and up to $25,000/yr can offset ordinary (W-2) income if you actively participate and your MAGI is under $100k (phasing out to $0 by $150k); unused losses carry forward. On sale, claimed depreciation is recaptured at up to 25%, and gains may owe capital-gains tax (a 1031 exchange can defer both). Figures are a year-1 estimate at your 24.0% rate — not tax advice; consult a CPA.
Schools (NCES district)
- District
- Okeechobee
- NCES district ID
- 1201410
- Math proficiency
- 44% ▼ -12.00%
- Reading proficiency
- 42% ▼ -4.00%
- Median HH income
- $36,710
- Composite
- 35.73/100
- National rank
- #4855
- State rank
- #58 of 73 in FL
Livability — Okeechobee
- Score
- 77/100
- State rank
- #210
- US rank
- #3234
Category grades
Schools grade is shown separately in the Schools card above.
Census & demographics
- County
- Okeechobee County · 23,975 people
- City population
- 23,975
- Metro
- Okeechobee, FL
- Population (ZIP)
- 23,975
- Household income
- $53,013
- Rent vs Own
- Severe rent burden
- 399.0
Population outlook (Okeechobee County) Hauer SSP2
- Today (2025)
- 37,273 people
- By 2030
- 35,885 · -3.7%
- By 2040
- 32,931 · -11.6%
- By 2050
- 29,433 · -21.0%
- By 2075
- 19,607 · -47.4%
- By 2100
- 11,814 · -68.3%
Race, ethnicity, and origin ACS 2023
- Neighborhood character
- Predominantly White (74%)
- Race & ethnicity
- White 74% Hispanic / Latino 19% Two or more races 8% Asian 2% Black 2% Native American 1%
- Hispanic origin (detail)
- Mexican 12% Puerto Rican 1% Cuban 2%
- Common ancestry
- Lithuanian 2% Iranian 2% Italian 2%
- Foreign-born
- 11% · Canada, Jamaica
- Languages at home
- 81% English-only · Spanish 16% French/Haitian/Cajun 1% Other Indo-European 1%
Political lean MEDSL · Okeechobee
- 2024 margin
- Solid R (+53.8) · D 22.9% · R 76.7%
- 2008→2024 swing
- -34.6pp toward R · 2008: -19.2pp · 2024: -53.8pp
- All cycles
- 2024: R+53.8 2020: R+44.4 2016: R+39.5 2012: R+20.0 2008: R+19.2
Not yet ingested
- Civics
- —
Market trends
- HPI YoY
- ▼ -64.47%
- Current HPI
- 348.6692
- Rent YoY
- —
- Metro
- Okeechobee, FL
- State GDP YoY
- ▲ 3.28%
- F500 in state
- 36
Industry mix (Fortune 500 HQ in FL)
| Industry | F500 HQs | Revenue |
|---|---|---|
| Industrial Technology | 2 | $29B |
|
||
| Insurance | 2 | $17B |
|
||
| Retail | 1 | $60B |
|
||
| Technology Distribution | 1 | $58B |
|
||
| Homebuilding | 1 | $35B |
|
||
| Technology Manufacturing | 1 | $35B |
|
||
Price history
+332.4% since first listed9 events — show timeline
- 2026-04-24 Price Changed $160,000 Beaches MLS
- 2026-01-03 Relisted — Beaches MLS
- 2026-01-03 Listing Removed — Beaches MLS
- 2025-11-05 Price Changed $170,000 Beaches MLS
- 2025-07-15 Listed $180,000 Beaches MLS
- 2023-03-21 Sold (Public Records) $130,000 Public Records
- 2007-01-26 Sold (Public Records) $72,000 Public Records
- 2003-05-28 Sold (Public Records) $67,000 Public Records
- 1999-11-19 Sold (Public Records) $37,000 Public Records
Property tax history
+7.0%/yrLatest (2025): $1,058 · +4.4% YoY. Source: county tax records.
Cash-flow waterfall
monthlySold comps — $/sqft
last 12 mo · ≤1 miLoading sold comps…