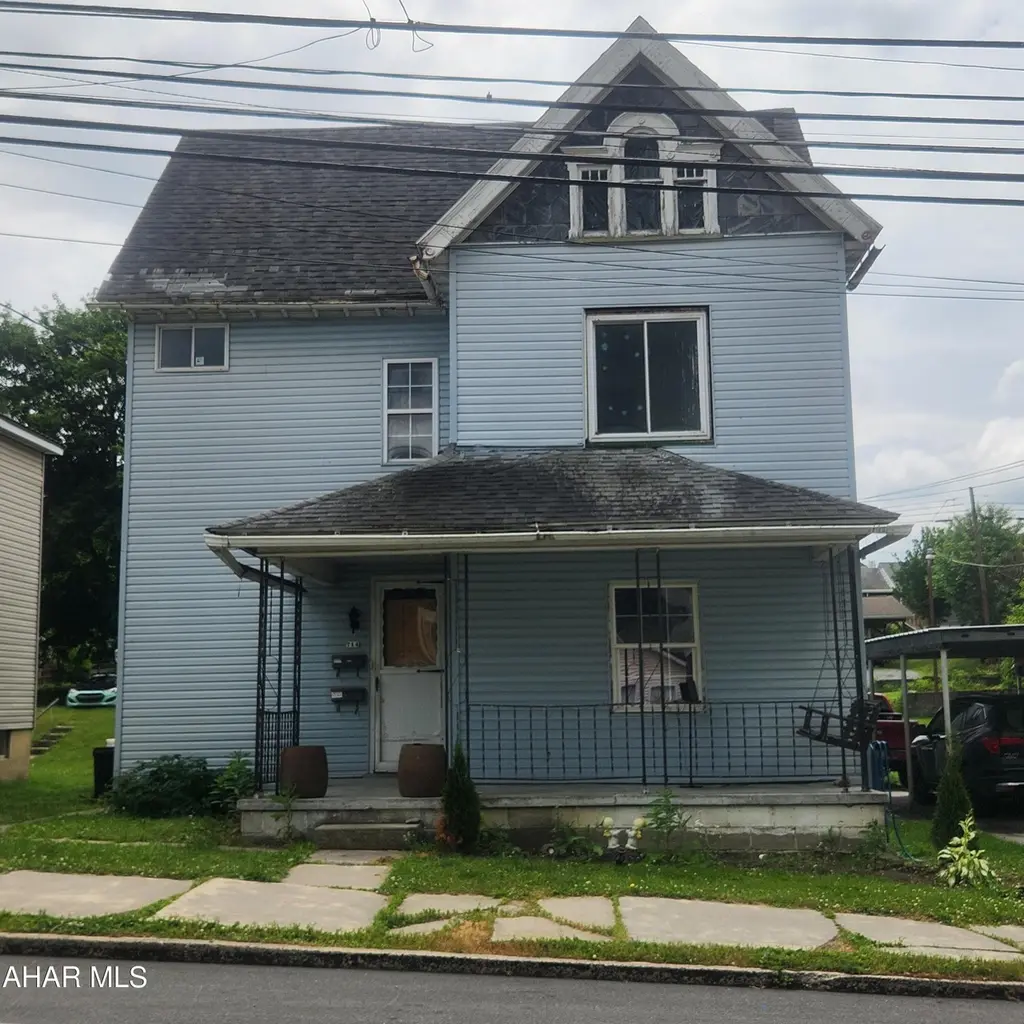
714 E Main St · Roaring Spring, PA
Flood risk 8/10 · Major
- FEMA flood zone
- X (unshaded)
- Chance of flooding over 30 yrs
- 0.98%
- Est. flood insurance / yr
- $507 – $1,088
Fire risk 1/10 · Minimal
- Est. fire insurance / yr
- $511 – $949
Heat risk 4/10 · Minor
- Hot days now (above 94°F)
- 8 days/yr
- Hot days in 30 yrs
- 18 days/yr
Wind risk 2/10 · Minimal
- Chance of severe wind over 30 yrs
- —
Air-quality risk 2/10 · Minimal
- Unhealthy air days now
- 1 days/yr
- Unhealthy air days in 30 yrs
- 3 days/yr
Risk factors via First Street. Map © Google.
Why this score? — see what drove the B- grade
The composite is a weighted blend of 9 inputs, each scored 0–100. Each bar is that input's sub-score; the figure is the points it added to the 100-point composite (weight × sub-score).
- Cash flow +30.0/30.0
- 1% rule +10.0/10.0
- DSCR +10.0/10.0
- ARV discount +7.5/15.0
- Schools +3.5/10.0
- Livability +3.5/5.0
- Rent growth +2.5/5.0
- Condition / age +2.5/5.0
- Appreciation +0.0/10.0
$49,900
🖨 Deal sheet (PDF) 📄 Offer letter ✓ Due diligence
Listing remarks
Great opportunity to renovated a 2 unit building in Roaring Spring. This property offers a 2 bedroom 1 bath on the first floor and a 3-4 bedroom 1 bathroom on second floor. Utilties are seperate per unit. The rear of the property offers additional off street parking. Seller to make no repairs, property sold in as is condition.
Key facts
- 7,405 sq ft lot
- Built 1900
Neighborhood map
What this means for you Summary
Snapshot
- This is a 4-bed/2.0-bath single-family listed at $50k.
Deal economics
- At list price, monthly cash flow is $865 ($10k/yr) — positive.
- The deal already cash-flows at list — no discount required.
- Meets the 1% rule at list price ($2k rent vs $50k).
Location & tenants
- Location reads 69/100 on livability (#829 in PA) — a middle-class / working-renter tenant base. Strengths: crime A+, cost of living A+, housing A+; Watch: employment D, amenities F, commute F.
- Spring Cove SD (town): math 31% / reading 51% proficiency, ranked #344 of 539 in PA (top 64%) — families likely to look elsewhere, expect single-tenant / working-renter base with shorter leases.
- Zoned schools: Martinsburg El Sch (math 38% / reading 50%, grade F, #858 of 1,518 statewide, top 57%, 366 students, 51% FRL); Spring Cove Ms (math 17% / reading 52%, grade F, #328 of 512 statewide, top 65%, 376 students, 52% FRL); Central Hs (math 57%, 554 students, 35% FRL).
- Market conditions: 10 active listings in the ZIP; 1 comparable units currently listed for rent nearby; 99 units permitted in Blair County in 2024 (0 in 5+ unit buildings).
Forward outlook
- Local home prices are declining (-3.0%/yr); year-one equity from $345 of loan paydown is wiped out by about $1k of value loss. Plan a longer hold.
- Blair County population projected at -18% by 2050 — secular population decline; favor cash flow + early exit over multi-decade hold.
- At projected returns (-3.0% appreciation + 3.0% rent growth), your $14k cash investment doubles in ~2 years — after that, you're playing with house money.
Negotiation context
- Only 0 days on market — expect competitive offers; lowballing is unlikely to land.
Risks & watch-outs
- Watch-outs: property tax is 4.1% of price; flood insurance adds $66/mo; built in 1900 — expect roof / HVAC / electrical / plumbing capex.
- Climate carrying-cost: severe flood risk — expect insurance premiums to compound above CPI over the hold.
Questions for the listing agent
- Built in 1900 — when were the roof, HVAC, electrical panel, plumbing, and water heater last replaced?
- Property tax is high relative to price — has the assessment been appealed recently, and will the sale trigger a re-assessment?
- What's the actual annual flood-insurance premium (NFIP or private), and is the property in a SFHA with mandatory coverage?
- Is there a deadline driving the sale (1031 exchange, divorce, estate, relocation)? That informs how much negotiation room exists.
- What's the average days-on-market for RENTAL listings here right now (not sales)? A rising rental-DOM trend means longer vacancies and softer asking-rent achievability than the comps imply.
- What's the recent tenant-quality profile in this submarket — average credit score on applications, eviction rate, late-payment / NSF rate, and stable-employment percentage? A property-management company in the area should have these aggregated.
- How much new for-sale + rental construction is in the pipeline within 1–3 miles? Heavy new supply typically softens prices + rents 12–24 months out; constrained supply supports both.
Investment metrics
- 1% rule
- 3.51% ✓
- Cap rate
- 28.69%
- Cash-on-cash
- 80.01%
- DSCR
- 4.56
- GRM
- 2.4
CMA / ARV
- ARV (on-the-fly)
- $214,890
- Comps found
- 6
Show comp detail 6 sales within ~0.75 mi
| Address | Dist | Beds/Ba | Sqft | Sold | Price | $/sf | Match |
|---|---|---|---|---|---|---|---|
| 831 James St | 0.23mi | 3/1.5 (-1) | 2,456 (-1%) | 14mo | $180,000 | $73 | 70 |
| 212 Girard St | 0.33mi | 3/2.5 (-1) | 2,580 (+4%) | 3mo | $300,000 | $116 | 68 |
| 817 New St | 0.16mi | 3/2.5 (-1) | 2,810 (+14%) | 8mo | $250,000 | $89 | 56 |
| 320 Poplar St | 0.32mi | 4/2.0 | 2,768 (+12%) | 14mo | $239,900 | $87 | 54 |
| 932 Beech St | 0.47mi | 4/2.5 | 2,824 (+14%) | 2mo | $200,000 | $71 | 50 |
| 341 Locust St | 0.45mi | 4/2.0 | 2,823 (+14%) | 20mo | $159,000 | $56 | 38 |
Match score weights: distance 35% · size 25% · config 20% · recency 20%. Top-matched comps best support the ARV.
Projected returns pro-forma
-3.0% appreciation · 3.0% rent growth · sell at horizon
- IRR
- 74.2%
- Equity multiple
- 4.37×
- Total profit
- $47,144
- Equity at exit
- $7,440
- IRR
- 78.0%
- Equity multiple
- 9.05×
- Total profit
- $112,537
- Equity at exit
- $4,314
Cash invested: $13,972 (down + closing). Projections, not guarantees.
Landlord ↔ Tenant lean methodology
- Overall (STATE)
- 62 Landlord-Friendly
- State Pennsylvania
- 62 Landlord-Friendly · EVEN
- County
- — inherits STATE
- City
- — inherits STATE
ZIP-level market 16673
- Home prices YoY
- -15.4%
- Active inventory
- 10
- Price-to-rent
- 2.4×
Monthly cashflow live
- Estimated rent
- $1,750 medium interval (Pro) →
- Mortgage (P&I)
- −$262
- Tax from tax record
- −$168 /mo · $2,022/yr
- Insurance
- −$21
- Flood insurance flood zone
- −$66 /mo · $798/yr
- HOA
- −$0
- Vacancy / Maint / Mgmt
- −$368
- Net cashflow
- $865
Break-even live
Sensitivity live
| Price | -10% $893 | -5% $879 | +0% $865 | +5% $851 | +10% $837 |
|---|---|---|---|---|---|
| Rent | -10% $727 | -5% $796 | +0% $865 | +5% $934 | +10% $1,003 |
| Rate | -1.0pp $890 | -0.5pp $878 | base $865 | +0.5pp $852 | +1.0pp $839 |
UW: 25.0% down · 7.5% · 30yr · 1.5% tax · 5.0% vac · 8.0% maint · 8.0% mgmt
Financing live
Cash to close
- Down payment
- $12,475
- Closing costs
- $1,497
- Reserves months
- —
- Total cash needed
- —
Loan-product check · same deal, 3 products live
Conventional
25% down · 7.5% · 30yr
- Down + closing
- —
- Monthly P&I
- —
- Monthly cashflow
- —
- DSCR
- —
- Eligible?
- —
Personal DTI + credit; lowest rate.
DSCR
20% down · 8.5% · 30yr
- Down + closing
- —
- Monthly P&I
- —
- Monthly cashflow
- —
- DSCR
- —
- Eligible?
- —
No personal income docs; deal must DSCR.
Hard money
10% down · 12.0% · 12mo
- Down + closing
- —
- Monthly P&I
- —
- Monthly cashflow
- —
- DSCR
- —
- Eligible?
- —
Short-term bridge; refi at stabilization.
Rent comps 1 comps
| Address | Beds | Baths | Sqft | Rent | $/sqft | DOM | Units | Dist |
|---|---|---|---|---|---|---|---|---|
| 304 Poplar St Roaring Spring, PA | 4.0 | 2.0 | 1746 | $1,750 | $1.00 | 45d | 1 | 0.34mi |
Listing history 2 events
-
2026-06-17remarks 328-char remark
-
2026-06-17$49,900 Pending
ⓘ Source: listings_history table (triggers on properties + properties_extension) + one-shot
backfill from property_details.listing_events for pre-trigger history.
Tax reassessment forecast PA · Partial reset (capped growth)
- Current annual tax
- $2,022 · $168/mo
- Projected year-2 tax
- $2,022 · $168/mo
- Expected delta
- $0/yr ($0/mo · -0.0%)
ⓘ Screening estimate from a state-policy table — verify with the county assessor before closing.
Climate risk First Street
- Flood 8/10 Severe FEMA zone X (unshaded) · 98% chance over 30 yrs
- Wildfire 1/10 Low
- Heat 4/10 Moderate 8 d/yr ≥94°F today · 18 d/yr by 30 yrs out
- Wind 2/10 Low
- Air quality 2/10 Low 1 unhealthy d/yr today · 3 by 30 yrs out
Nearby sold comps map
Loading sold comps map…
Walkable amenities ~0.75 mi
Loading nearby amenities…
Taxation est. · year 1
- Rental income
- $21,000
- − Mortgage interest
- −$2,795
- − Property taxes
- −$2,022
- − Insurance
- −$1,047
- − Repairs & maintenance
- −$1,680
- − Management
- −$1,680
- − Depreciation
- −$1,452
- Taxable income
- $10,324
- Est. tax owed @ 24.0%
- −$2,478
- After-tax cash flow
- $7,903/yr
For passive investors: Depreciation is non-cash, so a rental often shows a tax loss while cash-flowing — sheltering income. Rental losses are passive: they offset passive income freely, and up to $25,000/yr can offset ordinary (W-2) income if you actively participate and your MAGI is under $100k (phasing out to $0 by $150k); unused losses carry forward. On sale, claimed depreciation is recaptured at up to 25%, and gains may owe capital-gains tax (a 1031 exchange can defer both). Figures are a year-1 estimate at your 24.0% rate — not tax advice; consult a CPA.
Schools (NCES district)
- District
- Spring Cove SD
- NCES district ID
- 4222530
- Math proficiency
- 31% ▼ -9.00%
- Reading proficiency
- 51% ▼ -10.00%
- Median HH income
- $46,105
- Composite
- 34.88/100
- National rank
- #5083
- State rank
- #344 of 539 in PA
Livability — Roaring Spring
- Score
- 69/100
- State rank
- #829
- US rank
- #8620
Category grades
Schools grade is shown separately in the Schools card above.
Census & demographics
- Census place
- Roaring Spring, PA
- Population (ZIP)
- 5,066
Population outlook (Blair County) Hauer SSP2
- Today (2025)
- 121,571 people
- By 2030
- 117,966 · -3.0%
- By 2040
- 109,174 · -10.2%
- By 2050
- 99,542 · -18.1%
- By 2075
- 76,775 · -36.8%
- By 2100
- 54,326 · -55.3%
Race, ethnicity, and origin ACS 2023
- Neighborhood character
- Predominantly White (95%)
- Race & ethnicity
- White 95% Two or more races 3% Hispanic / Latino 1%
- Common ancestry
- Iranian 4% Romanian 2% Serbian 1%
- Foreign-born
- 1% · Canada
- Languages at home
- 96% English-only · German/W. Germanic 3% Spanish 1%
Political lean MEDSL · Blair
- 2024 margin
- Solid R (+43.5) · D 27.9% · R 71.4%
- 2008→2024 swing
- -19.2pp toward R · 2008: -24.3pp · 2024: -43.5pp
- All cycles
- 2024: R+43.5 2020: R+43.5 2016: R+46.4 2012: R+33.5 2008: R+24.3
Not yet ingested
- Civics
- —
Market trends
- HPI YoY
- ▼ -25.14%
- Current HPI
- 138.3742
- Rent YoY
- —
- Metro
- —
- State GDP YoY
- ▲ 1.68%
- F500 in state
- 34
Industry mix (Fortune 500 HQ in PA)
| Industry | F500 HQs | Revenue |
|---|---|---|
| Healthcare | 2 | $309B |
|
||
| Insurance | 2 | $27B |
|
||
| Telecommunications / Media | 1 | $124B |
|
||
| Industrial Distribution | 1 | $22B |
|
||
| Financial Services | 1 | $20B |
|
||
| Chemicals / Materials | 1 | $18B |
|
||
Price history
-0.2% since first listed3 events — show timeline
- 2026-06-13 Delisted — AHARMLS
- 2026-06-09 Listed $49,900 AHARMLS
- 2004-10-29 Sold (Public Records) $50,000 Public Records
Property tax history
+6.8%/yrLatest (2025): $2,022 · +6.7% YoY. Source: county tax records.
Cash-flow waterfall
monthlySold comps — $/sqft
last 12 mo · ≤1 miLoading sold comps…