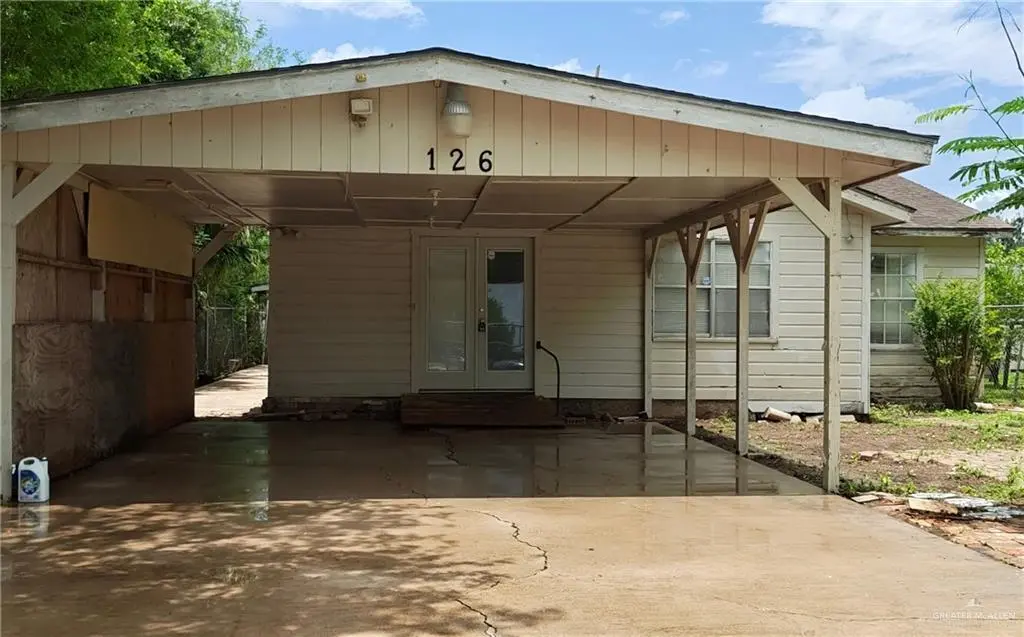
126 Ebony Ave · Rio Hondo, TX
Flood risk 1/10 · Minimal
- FEMA flood zone
- X (unshaded)
- Chance of flooding over 30 yrs
- 0.0%
- Est. flood insurance / yr
- $507 – $1,088
Fire risk 1/10 · Minimal
- Est. fire insurance / yr
- $1,222 – $2,270
Heat risk 10/10 · Severe
- Hot days now (above 110°F)
- 7 days/yr
- Hot days in 30 yrs
- 26 days/yr
Wind risk 9/10 · Severe
- Chance of severe wind over 30 yrs
- 99.0%
Air-quality risk 1/10 · Minimal
- Unhealthy air days now
- 0 days/yr
- Unhealthy air days in 30 yrs
- 0 days/yr
Risk factors via First Street. Map © Google.
Why this score? — see what drove the C+ grade
The composite is a weighted blend of 9 inputs, each scored 0–100. Each bar is that input's sub-score; the figure is the points it added to the 100-point composite (weight × sub-score).
- Cash flow +18.1/30.0
- ARV discount +15.0/15.0
- Appreciation +8.3/10.0
- DSCR +5.7/10.0
- 1% rule +4.9/10.0
- Livability +3.6/5.0
- Rent growth +2.5/5.0
- Condition / age +2.5/5.0
- Schools +1.8/10.0
$145,000
🖨 Deal sheet 📄 Offer letter ✓ Due diligence
Listing remarks
Welcome to 126 Ebony Avenue in Rio Hondo! This 4-bedroom, 1-bath home offers a spacious fenced backyard, detached garage with alley access and automatic roll-up door, plus a large covered carport with room for two vehicles or a boat. The detached garage also includes plumbing and potential for a workshop or extra storage. Conveniently located across from walking trails and close to Mary's Cafe, shopping, and dining. A great opportunity in a desirable location!
Key facts
- Alley access
- Fenced backyard
- Detached garage
Tags
Property features AI
Finance
- HOA & community: No association
Exterior
- Parking: Detached garage; 1 garage space; Has carport; 1 carport space; 2 total covered parking spaces; 2 total parking spaces
- Utilities: Public water
- Home design: Wood siding construction
- Construction: Pillar/post/pier foundation; Shingle roof
- Exterior features: Chain link fencing; Paved road access
Interior
- Kitchen: Gas water heater; No conveying appliances
- Flooring: Carpet; Vinyl
- Bathrooms: 1 full bathroom
- Heating & cooling: Central heating; Central air conditioning
- Interior features: Entrance foyer; Laminate countertops; Partial window coverings
- Laundry & utility: Laundry area with washer/dryer connection
Neighborhood map
What this means for you Summary
Snapshot
- This is a 4-bed/1.0-bath single-family listed at $145k.
Deal economics
- At list price, monthly cash flow is $128 ($2k/yr) — positive.
- The deal already cash-flows at list — no discount required.
- To meet the 1% rule (rent ≥ 1% of price), the offer needs to be $144k (1.0% below list).
- Recommended offer: $144k (1.0% below list) — sets the bar for 1% rule.
Location & tenants
- Location reads 71/100 on livability (#305 in TX) — a middle-class / working-renter tenant base. Strengths: cost of living A+, housing A+, health & safety A+; Watch: crime C-, amenities F, commute F.
- Rio Hondo ISD (town): math 15% / reading 28% proficiency, ranked #769 of 826 in TX (top 93%) — low school quality limits family demand, transient renter base, plan for 1-2y turnover.
- Zoned schools: Rio Hondo El (math 12% / reading 17%, grade F, #4,048 of 4,322 statewide, top 95%, 624 students, 86% FRL); Rio Hondo H S (math 22% / reading 42%, grade F, #1,044 of 1,632 statewide, top 66%, 507 students, 83% FRL) — zoned schools average 85% FRL vs 23% district-wide (62 pts higher); higher-poverty schools than district average — tighter screening recommended.
- Market conditions: 98 active listings in the ZIP; 2,326 units permitted in Cameron County in 2024 (503 in 5+ unit buildings).
Forward outlook
- In year one you build about $11k of equity ($1k loan paydown + $10k appreciation (6.6% local appreciation)).
- Cameron County population projected at +3% by 2050 — modest demand growth; plan on rents tracking national, not racing it.
- At projected returns (6.6% appreciation + 3.0% rent growth), your $41k cash investment doubles in ~4 years — after that, you're playing with house money.
- By year 4, paydown + projected appreciation supports a ~$36k cash-out refi (75% LTV) — recoverable capital for the next deal without selling this one.
Negotiation context
- Only 11 days on market — expect competitive offers; lowballing is unlikely to land.
Risks & watch-outs
- Climate carrying-cost: severe wind risk, 99% chance of damaging wind over 30y; extreme-heat days projected 7→26/yr by 2055 (HVAC capex compounding) — expect insurance premiums to compound above CPI over the hold.
Questions for the listing agent
- Built in 1963 — when were the roof, HVAC, electrical panel, plumbing, and water heater last replaced?
- Is there a deadline driving the sale (1031 exchange, divorce, estate, relocation)? That informs how much negotiation room exists.
- Schools are D-rated, which usually means shorter tenancies and higher turnover. Who's the typical renter profile here, and what's been the actual vacancy rate?
- What's the average days-on-market for RENTAL listings here right now (not sales)? A rising rental-DOM trend means longer vacancies and softer asking-rent achievability than the comps imply.
- What's the recent tenant-quality profile in this submarket — average credit score on applications, eviction rate, late-payment / NSF rate, and stable-employment percentage? A property-management company in the area should have these aggregated.
- How much new for-sale + rental construction is in the pipeline within 1–3 miles? Heavy new supply typically softens prices + rents 12–24 months out; constrained supply supports both.
Investment metrics
- 1% rule
- 0.99% ✗
- Cap rate
- 7.35%
- Cash-on-cash
- 3.78%
- DSCR
- 1.17
- GRM
- 8.4
CMA / ARV
- ARV (on-the-fly)
- $218,536
- Comps found
- 1
Show comp detail 1 sale within ~0.75 mi
| Address | Dist | Beds/Ba | Sqft | Sold | Price | $/sf | Match |
|---|---|---|---|---|---|---|---|
| 310 N Arroyo Blvd | 0.48mi | 4/2.5 | 2,000 (+8%) | 2mo | $235,000 | $118 | 56 |
Match score weights: distance 35% · size 25% · config 20% · recency 20%. Top-matched comps best support the ARV.
Projected returns pro-forma
6.58% appreciation · 3.0% rent growth · sell at horizon
- IRR
- 19.8%
- Equity multiple
- 2.36×
- Total profit
- $55,045
- Equity at exit
- $96,489
- IRR
- 18.9%
- Equity multiple
- 4.80×
- Total profit
- $154,437
- Equity at exit
- $179,780
Cash invested: $40,600 (down + closing). Projections, not guarantees.
Landlord ↔ Tenant lean methodology
- Overall (STATE)
- 87 Strongly Landlord-Friendly
- State Texas
- 87 Strongly Landlord-Friendly · R+5
- County
- — inherits STATE
- City
- — inherits STATE
ZIP-level market 78583
- Home prices YoY
- 3.4%
- Active inventory
- 98
- Price-to-rent
- 8.4×
Monthly cashflow live
- Estimated rent
- $1,435 medium interval (Pro) →
- Mortgage (P&I)
- −$760
- Tax from tax record
- −$185 /mo · $2,222/yr
- Insurance
- −$60
- HOA
- −$0
- Vacancy / Maint / Mgmt
- −$301
- Net cashflow
- $128
Break-even live
Sensitivity live
| Price | -10% $210 | -5% $169 | +0% $128 | +5% $87 | +10% $46 |
|---|---|---|---|---|---|
| Rent | -10% $14 | -5% $71 | +0% $128 | +5% $184 | +10% $241 |
| Rate | -1.0pp $201 | -0.5pp $165 | base $128 | +0.5pp $90 | +1.0pp $52 |
UW: 25.0% down · 7.5% · 30yr · 1.5% tax · 5.0% vac · 8.0% maint · 8.0% mgmt
Financing live
Cash to close
- Down payment
- $36,250
- Closing costs
- $4,350
- Reserves months
- —
- Total cash needed
- —
Loan-product check · same deal, 3 products live
Conventional
25% down · 7.5% · 30yr
- Down + closing
- —
- Monthly P&I
- —
- Monthly cashflow
- —
- DSCR
- —
- Eligible?
- —
Personal DTI + credit; lowest rate.
DSCR
20% down · 8.5% · 30yr
- Down + closing
- —
- Monthly P&I
- —
- Monthly cashflow
- —
- DSCR
- —
- Eligible?
- —
No personal income docs; deal must DSCR.
Hard money
10% down · 12.0% · 12mo
- Down + closing
- —
- Monthly P&I
- —
- Monthly cashflow
- —
- DSCR
- —
- Eligible?
- —
Short-term bridge; refi at stabilization.
Listing history 10 events
-
2026-06-18days on market $145,000 Active 11 DOM
-
2026-06-17days on market $145,000 Active 10 DOM
-
2026-06-16days on market $145,000 Active 9 DOM
-
2026-06-15days on market $145,000 Active 8 DOM
-
2026-06-14days on market $145,000 Active 6 DOM
-
2026-06-13days on market $145,000 Active 5 DOM
-
2026-06-10days on market $145,000 Active 3 DOM
-
2026-06-09days on market $145,000 Active 2 DOM
-
2026-06-09remarks 464-char remark
-
2026-06-09$145,000 Active 1 DOM
ⓘ Source: listings_history table (triggers on properties + properties_extension) + one-shot
backfill from property_details.listing_events for pre-trigger history.
Tax reassessment forecast TX · Resets to sale price
- Current annual tax
- $2,222 · $185/mo
- Projected year-2 tax
- $2,654 · $221/mo
- Expected delta
- +$432/yr (+$36/mo · 19.4%)
ⓘ Screening estimate from a state-policy table — verify with the county assessor before closing.
Climate risk First Street
- Flood 1/10 Low FEMA zone X (unshaded) · 0% chance over 30 yrs
- Wildfire 1/10 Low
- Heat 10/10 Extreme 7 d/yr ≥110°F today · 26 d/yr by 30 yrs out
- Wind 9/10 Extreme 99% chance of damaging wind over 30 yrs
- Air quality 1/10 Low 0 unhealthy d/yr today · 0 by 30 yrs out
Nearby sold comps map
Loading sold comps map…
Walkable amenities ~0.75 mi
Loading nearby amenities…
Taxation est. · year 1
- Rental income
- $17,222
- − Mortgage interest
- −$8,122
- − Property taxes
- −$2,222
- − Insurance
- −$725
- − Repairs & maintenance
- −$1,378
- − Management
- −$1,378
- − Depreciation
- −$4,218
- Taxable loss
- −$821
- Est. tax savings @ 24.0%
- +$197
- After-tax cash flow
- $1,731/yr
For passive investors: Depreciation is non-cash, so a rental often shows a tax loss while cash-flowing — sheltering income. Rental losses are passive: they offset passive income freely, and up to $25,000/yr can offset ordinary (W-2) income if you actively participate and your MAGI is under $100k (phasing out to $0 by $150k); unused losses carry forward. On sale, claimed depreciation is recaptured at up to 25%, and gains may owe capital-gains tax (a 1031 exchange can defer both). Figures are a year-1 estimate at your 24.0% rate — not tax advice; consult a CPA.
Schools (NCES district)
- District
- Rio Hondo ISD
- NCES district ID
- 4837170
- Math proficiency
- 15% ▼ -24.00%
- Reading proficiency
- 28% ▼ -10.00%
- Median HH income
- $36,099
- Composite
- 17.78/100
- National rank
- #9014
- State rank
- #769 of 826 in TX
Livability — Rio Hondo
- Score
- 71/100
- State rank
- #305
- US rank
- #6894
Category grades
Schools grade is shown separately in the Schools card above.
Census & demographics
- Census place
- Rio Hondo, TX
- Population (ZIP)
- 5,472
Population outlook (Cameron County) Hauer SSP2
- Today (2025)
- 441,603 people
- By 2030
- 448,113 · +1.5%
- By 2040
- 456,385 · +3.3%
- By 2050
- 456,294 · +3.3%
- By 2075
- 423,851 · -4.0%
- By 2100
- 342,787 · -22.4%
Race, ethnicity, and origin ACS 2023
- Neighborhood character
- Predominantly Hispanic (84%)
- Race & ethnicity
- Hispanic / Latino 84% Two or more races 48% White 15%
- Hispanic origin (detail)
- Mexican 81%
- Common ancestry
- Slovak 1% Portuguese 1% Iranian 1%
- Foreign-born
- 17% · Canada
- Languages at home
- 37% English-only · Spanish 63%
Political lean MEDSL · Cameron
- 2024 margin
- Lean R (+5.8) · D 46.7% · R 52.5%
- 2008→2024 swing
- -34.6pp toward R · 2008: 28.8pp · 2024: -5.8pp
- All cycles
- 2024: R+5.8 2020: D+13.2 2016: D+32.5 2012: D+32.4 2008: D+28.8
Not yet ingested
- Civics
- —
Market trends
- HPI YoY
- ▲ 6.58%
- Current HPI
- 199.084
- Rent YoY
- —
- Metro
- —
- State GDP YoY
- ▲ 3.95%
- F500 in state
- 110
Industry mix (Fortune 500 HQ in TX)
| Industry | F500 HQs | Revenue |
|---|---|---|
| Energy | 16 | $1,198B |
|
||
| Technology | 5 | $198B |
|
||
| Engineering / Construction | 4 | $72B |
|
||
| Energy Services | 3 | $60B |
|
||
| Utilities | 3 | $41B |
|
||
| Healthcare | 2 | $330B |
|
||
Price history
2 events — show timeline
- 2026-06-05 Listed $145,000 MCALLENMLS
- 2026-05-01 Sold (Public Records) — Public Records
Property tax history
+4.2%/yrLatest (2025): $2,222 · +9.6% YoY. Source: county tax records.
Cash-flow waterfall
monthlySold comps — $/sqft
last 12 mo · ≤1 miLoading sold comps…