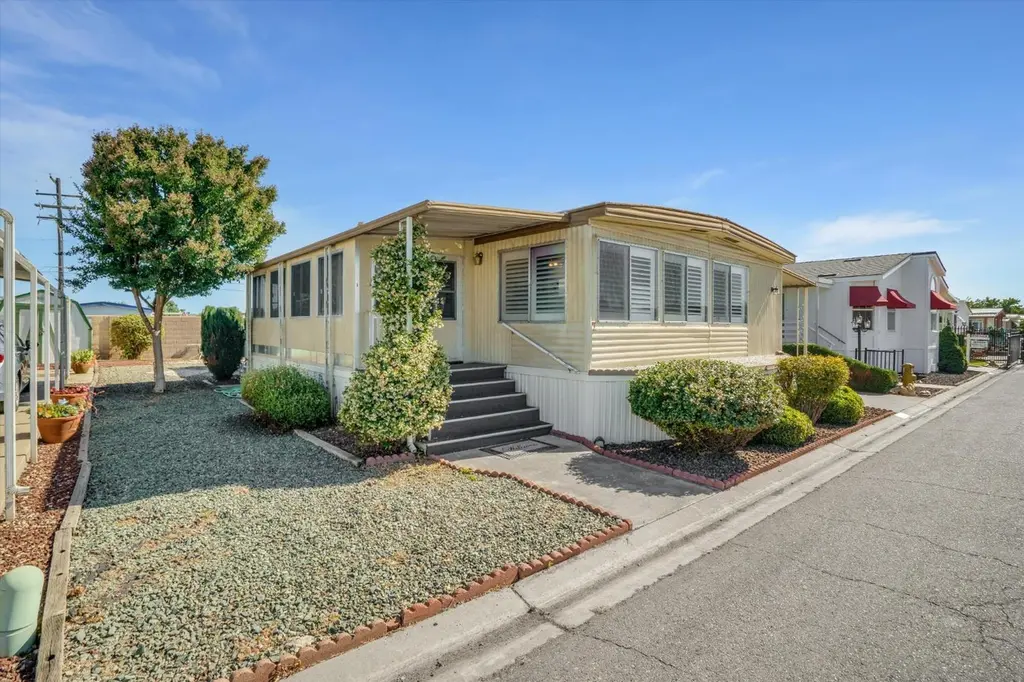
604 Pringle Ave #2 · Galt, CA
Flood risk 1/10 · Minimal
- FEMA flood zone
- X (unshaded)
- Chance of flooding over 30 yrs
- 0.0%
- Est. flood insurance / yr
- $507 – $1,088
Fire risk 5/10 · Moderate
- Est. fire insurance / yr
- $659 – $1,223
Heat risk 7/10 · Major
- Hot days now (above 101°F)
- 6 days/yr
- Hot days in 30 yrs
- 13 days/yr
Wind risk 1/10 · Minimal
- Chance of severe wind over 30 yrs
- —
Air-quality risk 10/10 · Severe
- Unhealthy air days now
- 28 days/yr
- Unhealthy air days in 30 yrs
- 29 days/yr
Risk factors via First Street. Map © Google.
Why this score? — see what drove the B grade
The composite is a weighted blend of 9 inputs, each scored 0–100. Each bar is that input's sub-score; the figure is the points it added to the 100-point composite (weight × sub-score).
- Cash flow +30.0/30.0
- 1% rule +10.0/10.0
- DSCR +10.0/10.0
- ARV discount +8.4/15.0
- Schools +4.4/10.0
- Condition / age +3.8/5.0
- Livability +2.9/5.0
- Rent growth +2.5/5.0
- Appreciation +0.0/10.0
$114,000
🖨 Deal sheet 📄 Offer letter ✓ Due diligence
Listing remarks
Seller is offering a 1 year buyer home warranty plan!! Welcome to this spacious and well-maintained 2-bedroom, 2-bath home located in the desirable Three Palms 55+ Community. This charming double-wide offers comfortable, low-maintenance living with bright living spaces, ceiling fans, lighting in every bedroom, and an enclosed front porch with both front and rear access. The home also features an EZ Electrical handicap lift for added accessibility and two storage sheds measuring approximately 9'8'' x 4'10'' and 8'2'' x 8'2'' (buyer to verify). Recent updates include a hot water heater installed in 2022, paint, leveling, and flooring completed in 2024. Goodman split heat/air unit installed in
Key facts
- Community clubhouse
- Swimming pool
- Two storage sheds
Tags
Property features AI
Finance
- HOA & community: No homeowners association; Land lease required ($850 monthly)
Exterior
- Parking: Covered parking; Guest parking available; No garage
- Utilities: Natural gas connected; Public water; Public sewer; 220 volt outlet in laundry
- Home design: Manufactured home (double wide) in park; Model/Make: Skyline; Year built 1972; Senior community; Entry/address: 604 Pringle Ave #2, Galt, CA 95632
- Construction: Aluminum skirting
- Exterior features: Metal roof; Shed(s) on property; Regular-shaped lot; Located in a mobile home park (land lease applies)
Interior
- Kitchen: Free-standing refrigerator; Dishwasher; Disposal; Double oven; Electric cooktop; Breakfast area
- Bedrooms: 2 bedrooms (including master bedroom)
- Flooring: Laminate; Linoleum; Other
- Bathrooms: 2 full bathrooms; Double sinks; Shower stall(s)
- Heating & cooling: Central heating; Central air conditioning; Ceiling fans
- Interior features: Porch with steps, railings, and an enclosed patio; Sun room; Living room; Dining area combined with living or space in kitchen; Skylight in kitchen; Laminate countertops; Pets allowed with number and size limits
- Laundry & utility: Laundry closet inside with electric hookup (220V in laundry)
Neighborhood map
What this means for you Summary
Snapshot
- This is a 2-bed/2.0-bath manufactured listed at $114k. Condition is rated good.
Deal economics
- At list price, monthly cash flow is $890 ($11k/yr) — positive.
- The deal already cash-flows at list — no discount required.
- Meets the 1% rule at list price ($2k rent vs $114k).
- Recommended offer: $111k (3.0% below list) — sets the bar for market timing.
- Cap rate 15.7% vs local median 3.3% in Galt — top-decile yield for the area; either an underpriced asset or a hidden risk that comps aren't pricing in. Stress-test before assuming the spread holds.
Location & tenants
- Location reads 57/100 on livability (#733 in CA) — a working-class tenant base; expect higher turnover. Strengths: housing A+, employment B; Watch: crime C-, schools D, amenities F.
- Galt Joint Union High (town): math 75% / reading 25% proficiency, ranked #137 of 517 in CA (top 26%) — acceptable for families but not a draw, mixed tenant base, ~2y average lease.
- Market conditions: 308 active listings in the ZIP; 2 comparable units currently listed for rent nearby; solid renter incomes; 6,825 units permitted in Sacramento County in 2024 (1,752 in 5+ unit buildings).
Forward outlook
- Local home prices are declining (-3.0%/yr); year-one equity from $788 of loan paydown is wiped out by about $3k of value loss. Plan a longer hold.
- Sacramento County population projected at +17% by 2050 — long-run rental-demand tailwind backs the buy-and-hold thesis.
- At projected returns (-3.0% appreciation + 3.0% rent growth), your $32k cash investment doubles in ~4 years — after that, you're playing with house money.
Negotiation context
- It's been on market 33 days — a 3% lower offer ($111k) is reasonable based on typical stale-listing flexibility.
Risks & watch-outs
- Climate carrying-cost: moderate wildfire risk; extreme-heat days projected 6→13/yr by 2055 (HVAC capex compounding) — expect insurance premiums to compound above CPI over the hold.
Questions for the listing agent
- It's been on market 33 days. Have you received any prior offers? Is the seller open to a 3% concession, seller financing, or rate buy-down credit?
- Built in 1972 — when were the roof, HVAC, electrical panel, plumbing, and water heater last replaced?
- Is there a deadline driving the sale (1031 exchange, divorce, estate, relocation)? That informs how much negotiation room exists.
- Schools are D-rated, which usually means shorter tenancies and higher turnover. Who's the typical renter profile here, and what's been the actual vacancy rate?
- What's the average days-on-market for RENTAL listings here right now (not sales)? A rising rental-DOM trend means longer vacancies and softer asking-rent achievability than the comps imply.
- What's the recent tenant-quality profile in this submarket — average credit score on applications, eviction rate, late-payment / NSF rate, and stable-employment percentage? A property-management company in the area should have these aggregated.
- How much new for-sale + rental construction is in the pipeline within 1–3 miles? Heavy new supply typically softens prices + rents 12–24 months out; constrained supply supports both.
Investment metrics
- 1% rule
- 1.86% ✓
- Cap rate
- 15.66%
- Cash-on-cash
- 33.47%
- DSCR
- 2.49
- GRM
- 4.5
CMA / ARV
- ARV (on-the-fly)
- $116,200
- Comps found
- 9
Show comp detail 9 sales within ~0.75 mi
| Address | Dist | Beds/Ba | Sqft | Sold | Price | $/sf | Match |
|---|---|---|---|---|---|---|---|
| 605 Pringle Ave #26 | 0.11mi | 2/2.0 | 1,248 (+7%) | 2mo | $125,000 | $100 | 81 |
| 604 Pringle Ave #18 | 0.10mi | 2/2.0 | 1,120 (-4%) | 15mo | $159,900 | $143 | 77 |
| 604 Pringle Ave #121 | 0.09mi | 2/2.0 | 1,272 (+10%) | 5mo | $130,000 | $102 | 76 |
| 820 N Lincoln Way #1 | 0.25mi | 2/2.0 | 1,100 (-5%) | 8mo | $84,500 | $77 | 73 |
| 605 Pringle Ave #9 | 0.11mi | 2/2.0 | 1,040 (-10%) | 6mo | $60,650 | $58 | 72 |
| 820 N Lincoln Way #67 | 0.17mi | 2/2.0 | 1,040 (-10%) | 8mo | $110,000 | $106 | 68 |
| 604 Pringle #76 | 0.06mi | 2/2.0 | 1,248 (+7%) | 21mo | $102,000 | $82 | 68 |
| 605 - 17 Pringle Ave #17 | 0.11mi | 3/2.0 (+1) | 1,120 (-4%) | 23mo | $95,000 | $85 | 65 |
| 820 N Lincoln Way #76 | 0.26mi | 2/2.0 | 1,080 (-7%) | 24mo | $120,000 | $111 | 57 |
Match score weights: distance 35% · size 25% · config 20% · recency 20%. Top-matched comps best support the ARV.
Projected returns pro-forma
-3.0% appreciation · 3.0% rent growth · sell at horizon
- IRR
- 28.7%
- Equity multiple
- 2.20×
- Total profit
- $38,264
- Equity at exit
- $16,998
- IRR
- 36.1%
- Equity multiple
- 4.34×
- Total profit
- $106,467
- Equity at exit
- $9,857
Cash invested: $31,920 (down + closing). Projections, not guarantees.
Landlord ↔ Tenant lean methodology
- Overall (STATE)
- 18 Strongly Tenant-Friendly
- State California
- 18 Strongly Tenant-Friendly · D+13
- County
- — inherits STATE
- City
- — inherits STATE
ZIP-level market 95632
- Active inventory
- 308
- Price-to-rent
- 4.5×
Monthly cashflow live
- Estimated rent
- $2,124 medium interval (Pro) →
- Mortgage (P&I)
- −$598
- Tax est. 1.5%
- −$142 /mo · $1,710/yr
- Insurance
- −$48
- HOA
- −$0
- Vacancy / Maint / Mgmt
- −$446
- Net cashflow
- $890
Break-even live
UW: 25.0% down · 7.5% · 30yr · 1.5% tax · 5.0% vac · 8.0% maint · 8.0% mgmt
Financing live
Cash to close
- Down payment
- $28,500
- Closing costs
- $3,420
- Reserves months
- —
- Total cash needed
- —
Loan-product check · same deal, 3 products live
Conventional
25% down · 7.5% · 30yr
- Down + closing
- —
- Monthly P&I
- —
- Monthly cashflow
- —
- DSCR
- —
- Eligible?
- —
Personal DTI + credit; lowest rate.
DSCR
20% down · 8.5% · 30yr
- Down + closing
- —
- Monthly P&I
- —
- Monthly cashflow
- —
- DSCR
- —
- Eligible?
- —
No personal income docs; deal must DSCR.
Hard money
10% down · 12.0% · 12mo
- Down + closing
- —
- Monthly P&I
- —
- Monthly cashflow
- —
- DSCR
- —
- Eligible?
- —
Short-term bridge; refi at stabilization.
Rent comps 2 comps
| Address | Beds | Baths | Sqft | Rent | $/sqft | DOM | Units | Dist |
|---|---|---|---|---|---|---|---|---|
| 228 McFarland St Apt 6 Galt, CA | 2.0 | 1.0 | 700 | $1,640 | $2.34 | 1d | 1 | 0.71mi |
| 410 5th St Unit 1 Galt, CA | 2.0 | 1.5 | 900 | $1,895 | $2.11 | 1d | 1 | 1.09mi |
Listing history 13 events
-
2026-06-18days on market $114,000 Active 33 DOM
-
2026-06-17days on market $114,000 Active 32 DOM
-
2026-06-16days on market $114,000 Active 31 DOM
-
2026-06-15days on market $114,000 Active 30 DOM
-
2026-06-13days on market $114,000 Active 28 DOM
-
2026-06-13days on market $114,000 Active 27 DOM
-
2026-06-09days on market $114,000 Active 24 DOM
-
2026-06-08days on market $114,000 Active 23 DOM
-
2026-06-07pricedays on market $114,000 Active 22 DOM
-
2026-06-03days on market $117,000 Active 18 DOM
-
2026-06-02days on market $117,000 Active 17 DOM
-
2026-06-01days on market $117,000 Active 16 DOM
-
2026-05-31days on market $117,000 Active 15 DOM
ⓘ Source: listings_history table (triggers on properties + properties_extension) + one-shot
backfill from property_details.listing_events for pre-trigger history.
Climate risk First Street
- Flood 1/10 Low FEMA zone X (unshaded) · 0% chance over 30 yrs
- Wildfire 5/10 Major
- Heat 7/10 Severe 6 d/yr ≥101°F today · 13 d/yr by 30 yrs out
- Wind 1/10 Low
- Air quality 10/10 Extreme 28 unhealthy d/yr today · 29 by 30 yrs out
Nearby sold comps map
Loading sold comps map…
Walkable amenities ~0.75 mi
Loading nearby amenities…
Taxation est. · year 1
- Rental income
- $25,491
- − Mortgage interest
- −$6,386
- − Property taxes
- −$1,710
- − Insurance
- −$570
- − Repairs & maintenance
- −$2,039
- − Management
- −$2,039
- − Depreciation
- −$3,316
- Taxable income
- $9,430
- Est. tax owed @ 24.0%
- −$2,263
- After-tax cash flow
- $8,421/yr
For passive investors: Depreciation is non-cash, so a rental often shows a tax loss while cash-flowing — sheltering income. Rental losses are passive: they offset passive income freely, and up to $25,000/yr can offset ordinary (W-2) income if you actively participate and your MAGI is under $100k (phasing out to $0 by $150k); unused losses carry forward. On sale, claimed depreciation is recaptured at up to 25%, and gains may owe capital-gains tax (a 1031 exchange can defer both). Figures are a year-1 estimate at your 24.0% rate — not tax advice; consult a CPA.
Condition & rehab AI · 12 photos
This well-maintained mobile home in a desirable community offers a good starting point for a cosmetic renovation to enhance its resale and rental value.
Repairs flagged
- Minor kitchen cabinets — dated design
- Minor bathroom cabinets — wooden design
Value-add opportunities
- Both kitchen renovation — modernizing the kitchen would appeal to both buyers and renters
- Both bathroom renovation — updating the bathrooms would enhance the home's appeal
- Both HVAC system upgrade — a more efficient HVAC system would improve comfort and energy efficiency
Renovation cost estimate screening
| Repair item | Severity | Est. cost |
|---|---|---|
| kitchen cabinets · dated design | Minor | $500–3,000 |
| bathroom cabinets · wooden design | Minor | $500–3,000 |
| Total estimated repair cost · 2 items | $1,000–6,000 |
Value-add ROI direction
- Both kitchen renovation — modernizing the kitchen would appeal to both buyers and renters ↑
- Both bathroom renovation — updating the bathrooms would enhance the home's appeal ↑
- Both HVAC system upgrade — a more efficient HVAC system would improve comfort and energy efficiency ↑
ⓘ Cost ranges are severity-bucket heuristics (US national rule-of-thumb). Get contractor quotes + a written scope before underwriting a rehab budget.
Schools (NCES district)
- District
- Galt Joint Union High
- NCES district ID
- 0614820
- Math proficiency
- 75% ▲ 48.00%
- Reading proficiency
- 25% ▼ -32.00%
- Median HH income
- $62,916
- Composite
- 44.24/100
- National rank
- #2844
- State rank
- #137 of 517 in CA
Livability — Galt
- Score
- 57/100
- State rank
- #733
- US rank
- #21603
Category grades
Schools grade is shown separately in the Schools card above.
Census & demographics
- Census place
- Galt, CA
- County
- Sacramento County · 1,539,646 people
- City population
- 32,493
- Metro
- Sacramento-Roseville-Folsom, CA
- Population (ZIP)
- 32,493
- Household income
- $102,239
- Rent vs Own
- Severe rent burden
- 476.0
Population outlook (Sacramento County) Hauer SSP2
- Today (2025)
- 1,660,763 people
- By 2030
- 1,732,990 · +4.3%
- By 2040
- 1,855,755 · +11.7%
- By 2050
- 1,941,335 · +16.9%
- By 2075
- 2,046,162 · +23.2%
- By 2100
- 1,961,444 · +18.1%
Race, ethnicity, and origin ACS 2023
- Neighborhood character
- Diverse neighborhood (Simpson 0.60)
- Race & ethnicity
- White 45% Hispanic / Latino 44% Two or more races 16% Asian 5% Native American 2% Black 2%
- Hispanic origin (detail)
- Mexican 42%
- Common ancestry
- Russian 4% Italian 2% Slovak 2%
- Foreign-born
- 19% · Canada, China, Vietnam
- Languages at home
- 63% English-only · Spanish 32% Other Indo-European 2% Other Asian/Pacific 1%
Political lean MEDSL · Sacramento
- 2024 margin
- D (+19.7) · D 58.1% · R 38.4% · Other 3.5%
- 2008→2024 swing
- +0.7pp no change · 2008: 19.0pp · 2024: 19.7pp
- All cycles
- 2024: D+19.7 2020: D+25.3 2016: D+23.7 2012: D+16.3 2008: D+19.0
Not yet ingested
- Civics
- —
Market trends
- HPI YoY
- ▼ -309.48%
- Current HPI
- 309.3197
- Rent YoY
- —
- Metro
- Sacramento-Roseville-Folsom, CA
- State GDP YoY
- ▲ 3.21%
- F500 in state
- 116
Industry mix (Fortune 500 HQ in CA)
| Industry | F500 HQs | Revenue |
|---|---|---|
| Technology | 27 | $1,492B |
|
||
| Financial Services | 3 | $174B |
|
||
| Retail | 3 | $44B |
|
||
| Insurance | 3 | $26B |
|
||
| Media / Entertainment | 2 | $115B |
|
||
| Pharmaceuticals / Biotech | 2 | $62B |
|
||
Cash-flow waterfall
monthlySold comps — $/sqft
last 12 mo · ≤1 miLoading sold comps…