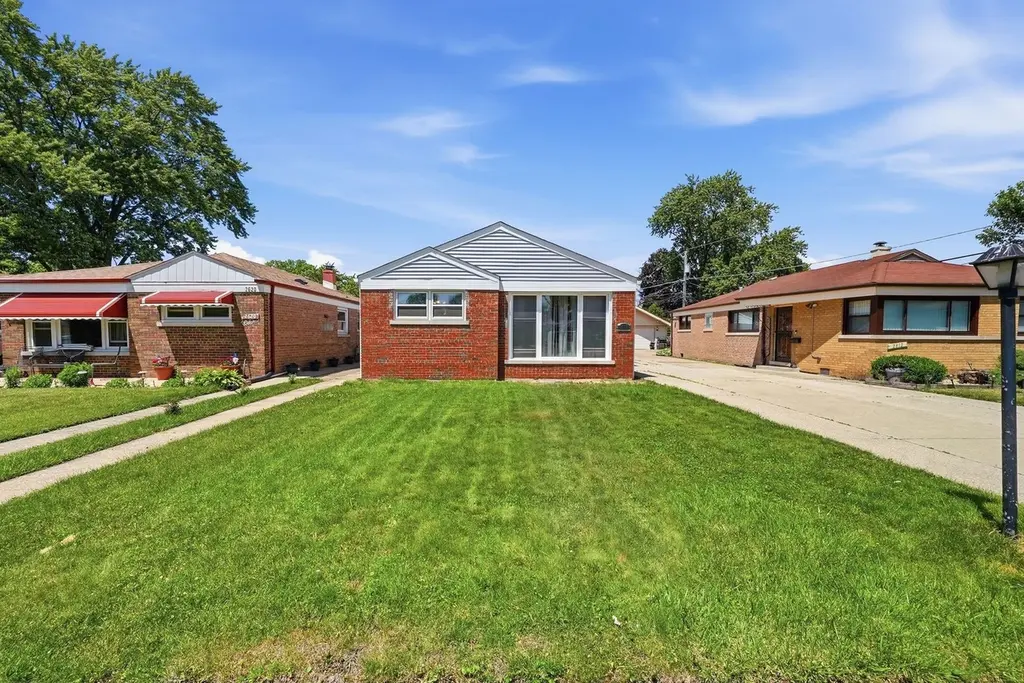
2616 121st St · Blue Island, IL
Flood risk 1/10 · Minimal
- FEMA flood zone
- X (unshaded)
- Chance of flooding over 30 yrs
- 0.0%
- Est. flood insurance / yr
- $473 – $860
Fire risk 1/10 · Minimal
- Est. fire insurance / yr
- $804 – $1,492
Heat risk 3/10 · Minor
- Hot days now (above 101°F)
- 7 days/yr
- Hot days in 30 yrs
- 15 days/yr
Wind risk 2/10 · Minimal
- Chance of severe wind over 30 yrs
- —
Air-quality risk 4/10 · Minor
- Unhealthy air days now
- 4 days/yr
- Unhealthy air days in 30 yrs
- 6 days/yr
Risk factors via First Street. Map © Google.
Why this score? — see what drove the C+ grade
The composite is a weighted blend of 9 inputs, each scored 0–100. Each bar is that input's sub-score; the figure is the points it added to the 100-point composite (weight × sub-score).
- Cash flow +23.5/30.0
- ARV discount +15.0/15.0
- DSCR +7.6/10.0
- 1% rule +6.8/10.0
- Livability +3.9/5.0
- Rent growth +2.5/5.0
- Condition / age +2.5/5.0
- Schools +1.6/10.0
- Appreciation +0.0/10.0
$165,000
🖨 Deal sheet (PDF) 📄 Offer letter ✓ Due diligence
Key facts
- Large windows
- All-brick ranch
- Long side driveway
Tags
Property features AI
Finance
- Other: Possession negotiable
- HOA & community: No master association fee required
Exterior
- Parking: Detached garage (2 garage spaces, 2 total parking spaces)
- Utilities: Public water; Public sewer
- Home design: Detached single-family home; One-story; Fee simple ownership; Built approximately 71–80 years ago; Property listed as built before 1978
- Construction: Brick construction
- Exterior features: Lot dimensions about 135 x 40; Lot under 0.25 acre; Asphalt driveway
Interior
- Kitchen: Main-level kitchen — approximately 10 x 11
- Bedrooms: Two bedrooms (both on the main level); Master bedroom on the main level — approximately 13 x 11; Second bedroom on the main level — approximately 12 x 10
- Bathrooms: One full bathroom
- Heating & cooling: Natural gas heating; Central air conditioning
- Interior features: Six total rooms; Crawl space basement
- Laundry & utility: Main-level laundry room — approximately 10 x 10
Neighborhood map
What this means for you Summary
Snapshot
- This is a 2-bed/1.0-bath single-family listed at $165k.
Deal economics
- At list price, monthly cash flow is $307 ($4k/yr) — positive.
- The deal already cash-flows at list — no discount required.
- Meets the 1% rule at list price ($2k rent vs $165k).
- Cap rate 8.5% vs local median 6.6% in Blue Island — meaningfully above typical; check what's discounted (condition, days-on-market, listing class) to confirm the premium yield is real.
Location & tenants
- Location reads 77/100 on livability (#159 in IL, #2,964 nationally) — a middle-class / working-renter tenant base. Strengths: commute A+, cost of living A+, housing A+; Watch: employment C-, schools F, crime F.
- Chsd 218 (suburban): math 14% / reading 20% proficiency, ranked #454 of 620 in IL (top 73%) — low school quality limits family demand, transient renter base, plan for 1-2y turnover.
- Market conditions: 44 active listings in the ZIP; 16 comparable units currently listed for rent nearby; rentals leasing fast (median 0d on market — plan ~1-2 weeks tenant-placement turnaround); 6,272 units permitted in Cook County in 2024 (4,658 in 5+ unit buildings).
Forward outlook
- Local home prices are declining (-3.0%/yr); year-one equity from $1k of loan paydown is wiped out by about $5k of value loss. Plan a longer hold.
Negotiation context
- Only 13 days on market — expect competitive offers; lowballing is unlikely to land.
- Current owner paid $46k; list at $165k implies a 259% gain — meaningful room to come down on a strong offer.
Risks & watch-outs
- Watch-outs: built in 1954 — expect roof / HVAC / electrical / plumbing capex.
Questions for the listing agent
- Built in 1954 — when were the roof, HVAC, electrical panel, plumbing, and water heater last replaced?
- Is there a deadline driving the sale (1031 exchange, divorce, estate, relocation)? That informs how much negotiation room exists.
- Schools are F-rated, which usually means shorter tenancies and higher turnover. Who's the typical renter profile here, and what's been the actual vacancy rate?
- Crime grade is F in this area — have there been break-ins, vandalism, or insurance claims at this property in the last 3 years? What carrier currently insures it and at what premium?
- What's the average days-on-market for RENTAL listings here right now (not sales)? A rising rental-DOM trend means longer vacancies and softer asking-rent achievability than the comps imply.
- What's the recent tenant-quality profile in this submarket — average credit score on applications, eviction rate, late-payment / NSF rate, and stable-employment percentage? A property-management company in the area should have these aggregated.
- How much new for-sale + rental construction is in the pipeline within 1–3 miles? Heavy new supply typically softens prices + rents 12–24 months out; constrained supply supports both.
Investment metrics
- 1% rule
- 1.18% ✓
- Cap rate
- 8.53%
- Cash-on-cash
- 7.99%
- DSCR
- 1.36
- GRM
- 7.1
CMA / ARV
- ARV (on-the-fly)
- $234,360
- Comps found
- 12
Show comp detail 12 sales within ~0.75 mi
| Address | Dist | Beds/Ba | Sqft | Sold | Price | $/sf | Match |
|---|---|---|---|---|---|---|---|
| 2622 120th St | 0.13mi | 3/1.5 (+1) | 1,090 (+1%) | 10mo | $253,500 | $233 | 77 |
| 2521 Orchard St | 0.43mi | 2/1.0 | 1,112 (+3%) | 2mo | $200,000 | $180 | 73 |
| 2636 121st Pl | 0.08mi | 3/1.0 (+1) | 965 (-11%) | 5mo | $165,000 | $171 | 70 |
| 2538 W 119th St | 0.27mi | 3/1.0 (+1) | 1,154 (+7%) | 11mo | $299,900 | $260 | 62 |
| 12238 Greenwood Ave | 0.27mi | 3/1.0 (+1) | 1,000 (-7%) | 11mo | $170,000 | $170 | 61 |
| 2616 122nd St | 0.13mi | 3/1.0 (+1) | 931 (-14%) | 12mo | $200,000 | $215 | 56 |
| 2345 Krueger St | 0.53mi | 3/1.5 (+1) | 1,055 (-2%) | 11mo | $170,000 | $161 | 56 |
| 3161 W Park Lane Dr | 0.72mi | 2/1.0 | 986 (-9%) | 3mo | $235,000 | $238 | 50 |
| 2239 123rd Pl | 0.60mi | 3/1.0 (+1) | 1,008 (-7%) | 13mo | $215,000 | $213 | 45 |
| 3160 W Park Lane Dr | 0.73mi | 2/1.0 | 986 (-9%) | 9mo | $227,500 | $231 | 44 |
| 11713 S Meadow Lane Dr | 0.72mi | 2/1.0 | 986 (-9%) | 13mo | $233,000 | $236 | 41 |
| 12611 Artesian Ave | 0.71mi | 3/1.0 (+1) | 1,176 (+9%) | 14mo | $255,000 | $217 | 35 |
Match score weights: distance 35% · size 25% · config 20% · recency 20%. Top-matched comps best support the ARV.
Projected returns pro-forma
-3.0% appreciation · 3.0% rent growth · sell at horizon
- IRR
- -4.1%
- Equity multiple
- 0.85×
- Total profit
- $-7,071
- Equity at exit
- $24,602
- IRR
- 5.7%
- Equity multiple
- 1.42×
- Total profit
- $19,396
- Equity at exit
- $14,266
Cash invested: $46,200 (down + closing). Projections, not guarantees.
Landlord ↔ Tenant lean methodology
- Overall (STATE)
- 43 Moderately Tenant-Leaning
- State Illinois
- 43 Moderately Tenant-Leaning · D+7
- County
- — inherits STATE
- City
- — inherits STATE
ZIP-level market 60406
- Home prices YoY
- -26.8%
- Active inventory
- 44
- Price-to-rent
- 7.1×
Monthly cashflow live
- Estimated rent
- $1,942 high interval (Pro) →
- Mortgage (P&I)
- −$865
- Tax from tax record
- −$293 /mo · $3,517/yr
- Insurance
- −$69
- HOA
- −$0
- Vacancy / Maint / Mgmt
- −$408
- Net cashflow
- $307
Break-even live
Sensitivity live
| Price | -10% $401 | -5% $354 | +0% $307 | +5% $261 | +10% $214 |
|---|---|---|---|---|---|
| Rent | -10% $154 | -5% $231 | +0% $307 | +5% $384 | +10% $461 |
| Rate | -1.0pp $391 | -0.5pp $349 | base $307 | +0.5pp $265 | +1.0pp $221 |
UW: 25.0% down · 7.5% · 30yr · 1.5% tax · 5.0% vac · 8.0% maint · 8.0% mgmt
Financing live
Cash to close
- Down payment
- $41,250
- Closing costs
- $4,950
- Reserves months
- —
- Total cash needed
- —
Loan-product check · same deal, 3 products live
Conventional
25% down · 7.5% · 30yr
- Down + closing
- —
- Monthly P&I
- —
- Monthly cashflow
- —
- DSCR
- —
- Eligible?
- —
Personal DTI + credit; lowest rate.
DSCR
20% down · 8.5% · 30yr
- Down + closing
- —
- Monthly P&I
- —
- Monthly cashflow
- —
- DSCR
- —
- Eligible?
- —
No personal income docs; deal must DSCR.
Hard money
10% down · 12.0% · 12mo
- Down + closing
- —
- Monthly P&I
- —
- Monthly cashflow
- —
- DSCR
- —
- Eligible?
- —
Short-term bridge; refi at stabilization.
Rent comps 16 comps
| Address | Beds | Baths | Sqft | Rent | $/sqft | DOM | Units | Dist |
|---|---|---|---|---|---|---|---|---|
| 12151 S Western Ave Unit 3 Blue Island, IL | 1.0 | 1.0 | 800 | $1,450 | $1.81 | 0d | 1 | 0.33mi |
| 12151 S Western Ave Unit 4 Blue Island, IL | 1.0 | 1.0 | 800 | $1,350 | $1.69 | 0d | 1 | 0.33mi |
| 2336 122nd St Unit 2 Blue Island, IL | 3.0 | 1.0 | 1340 | $1,900 | $1.42 | 21d | 1 | 0.37mi |
| 11706 S Artesian Ave Chicago, IL | 3.0 | 2.5 | 1299 | $3,400 | $2.62 | 0d | 1 | 0.50mi |
| 2130 122nd St Blue Island, IL | 2.0 | 1.0 | 558 | $1,450 | $2.60 | 0d | 1 | 0.61mi |
| 2109 W 119th St Unit 10 Blue Island, IL | 1.0 | 1.0 | 800 | $1,200 | $1.50 | 0d | 1 | 0.66mi |
| 12710 Elm St Unit 2B Blue Island, IL | 3.0 | 2.0 | 900 | $1,850 | $2.06 | 0d | 1 | 0.81mi |
| 3177 W 115th St Unit 3W Merrionette Park, IL | 2.0 | 1.0 | 900 | $1,600 | $1.78 | 0d | 1 | 0.99mi |
| 11233 S Whipple St Chicago, IL | 3.0 | 2.0 | 1040 | $2,850 | $2.74 | 0d | 1 | 1.17mi |
| 2640 Vermont St Unit 1 Blue Island, IL | 3.0 | 1.5 | 1500 | $2,200 | $1.47 | 0d | 1 | 1.28mi |
| 2336 W 122nd St Unit 2 Alsip, IL | 3.0 | 1.0 | 1100 | $1,900 | $1.73 | 8d | 1 | 1.28mi |
| 3621 W 119th St Alsip, IL | 1.0 | 1.0 | 700 | $1,525 | $2.18 | 0d | 3 | 1.30mi |
| 3700 W 119th St Unit 3700-3C Alsip, IL | 2.0 | 1.0 | 730 | $1,595 | $2.18 | 0d | 1 | 1.40mi |
| 11118 S Homewood Ave Chicago, IL | 2.0 | 1.0 | 850 | $2,650 | $3.12 | 0d | 3 | 1.40mi |
| 2524 W 109th Pl Chicago, IL | 3.0 | 1.0 | 1350 | $2,600 | $1.93 | 0d | 1 | 1.43mi |
| 11547 S Ashland Ave Chicago, IL | 3.0 | 1.5 | 1000 | $2,700 | $2.70 | 4d | 1 | 1.44mi |
Listing history 7 events
-
2026-06-21days on market $165,000 Active 13 DOM
-
2026-06-18days on market $165,000 Active 10 DOM
-
2026-06-17days on market $165,000 Active 9 DOM
-
2026-06-16days on market $165,000 Active 8 DOM
-
2026-06-15days on market $165,000 Active 7 DOM
-
2026-06-13days on market $165,000 Active 5 DOM
-
2026-06-08$165,000 Active 1 DOM
ⓘ Source: listings_history table (triggers on properties + properties_extension) + one-shot
backfill from property_details.listing_events for pre-trigger history.
Tax reassessment forecast IL · Partial reset (capped growth)
- Current annual tax
- $3,517 · $293/mo
- Projected year-2 tax
- $3,631 · $303/mo
- Expected delta
- +$114/yr (+$10/mo · 3.3%)
ⓘ Screening estimate from a state-policy table — verify with the county assessor before closing.
Climate risk First Street
- Flood 1/10 Low FEMA zone X (unshaded) · 0% chance over 30 yrs
- Wildfire 1/10 Low
- Heat 3/10 Moderate 7 d/yr ≥101°F today · 15 d/yr by 30 yrs out
- Wind 2/10 Low
- Air quality 4/10 Moderate 4 unhealthy d/yr today · 6 by 30 yrs out
Nearby sold comps map
Loading sold comps map…
Walkable amenities ~0.75 mi
Loading nearby amenities…
Taxation est. · year 1
- Rental income
- $23,310
- − Mortgage interest
- −$9,243
- − Property taxes
- −$3,517
- − Insurance
- −$825
- − Repairs & maintenance
- −$1,865
- − Management
- −$1,865
- − Depreciation
- −$4,800
- Taxable income
- $1,196
- Est. tax owed @ 24.0%
- −$287
- After-tax cash flow
- $3,403/yr
For passive investors: Depreciation is non-cash, so a rental often shows a tax loss while cash-flowing — sheltering income. Rental losses are passive: they offset passive income freely, and up to $25,000/yr can offset ordinary (W-2) income if you actively participate and your MAGI is under $100k (phasing out to $0 by $150k); unused losses carry forward. On sale, claimed depreciation is recaptured at up to 25%, and gains may owe capital-gains tax (a 1031 exchange can defer both). Figures are a year-1 estimate at your 24.0% rate — not tax advice; consult a CPA.
Schools (NCES district)
- District
- Chsd 218
- NCES district ID
- 1706540
- Math proficiency
- 14% ▼ -4.00%
- Reading proficiency
- 20% ▼ -1.00%
- Median HH income
- $57,166
- Composite
- 16.09/100
- National rank
- #9235
- State rank
- #454 of 620 in IL
Livability — Blue Island
- Score
- 77/100
- State rank
- #159
- US rank
- #2964
Category grades
Schools grade is shown separately in the Schools card above.
Census & demographics
- Census place
- Blue Island, IL
- City population
- 24,887
- Population (ZIP)
- 24,887
Population outlook (Cook County) Hauer SSP2
- Today (2025)
- 5,347,519 people
- By 2030
- 5,357,703 · +0.2%
- By 2040
- 5,324,924 · -0.4%
- By 2050
- 5,230,762 · -2.2%
- By 2075
- 4,785,735 · -10.5%
- By 2100
- 4,188,836 · -21.7%
Race, ethnicity, and origin ACS 2023
- Neighborhood character
- Diverse neighborhood (Simpson 0.65)
- Race & ethnicity
- Hispanic / Latino 44% Black 34% White 19% Two or more races 8%
- Hispanic origin (detail)
- Mexican 39%
- Common ancestry
- Romanian 2% English 1% Iranian 1%
- Foreign-born
- 19% · Canada
- Languages at home
- 65% English-only · Spanish 33% Other Indo-European 1%
Political lean MEDSL · Cook
- 2024 margin
- Solid D (+42.0) · D 70.4% · R 28.4% · Other 1.2%
- 2008→2024 swing
- -11.4pp toward R · 2008: 53.4pp · 2024: 42.0pp
- All cycles
- 2024: D+42.0 2020: D+50.3 2016: D+53.0 2012: D+49.4 2008: D+53.4
Not yet ingested
- Civics
- —
Market trends
- HPI YoY
- ▼ -94.77%
- Current HPI
- 259.492
- Rent YoY
- —
- Metro
- —
- State GDP YoY
- ▲ 1.59%
- F500 in state
- 60
Industry mix (Fortune 500 HQ in IL)
| Industry | F500 HQs | Revenue |
|---|---|---|
| Insurance | 4 | $201B |
|
||
| Consumer Goods | 4 | $87B |
|
||
| Industrial Machinery | 3 | $64B |
|
||
| Healthcare | 2 | $55B |
|
||
| Retail / Pharmacy | 1 | $148B |
|
||
| Agriculture / Food | 1 | $86B |
|
||
Price history
+262.6% since first listed4 events — show timeline
- 2026-06-08 Listed $165,000 MRED as Distributed by MLS Grid
- 1985-08-20 Sold (Public Records) $46,000 Public Records
- 1985-07-01 Sold (Public Records) $46,000 Public Records
- 1980-08-06 Sold (Public Records) $45,500 Public Records
Property tax history
+6.4%/yrLatest (2023): $3,517 · +29.4% YoY. Source: county tax records.
Cash-flow waterfall
monthlySold comps — $/sqft
last 12 mo · ≤1 miLoading sold comps…