3951 Via Poinciana #112 · Greenacres, FL
Flood risk 1/10 · Minimal
- FEMA flood zone
- X (unshaded)
- Chance of flooding over 30 yrs
- 0.0%
- Est. flood insurance / yr
- $507 – $1,088
Fire risk 1/10 · Minimal
- Est. fire insurance / yr
- $947 – $1,759
Heat risk 10/10 · Severe
- Hot days now (above 106°F)
- 7 days/yr
- Hot days in 30 yrs
- 26 days/yr
Wind risk 10/10 · Severe
- Chance of severe wind over 30 yrs
- 99.0%
Air-quality risk 2/10 · Minimal
- Unhealthy air days now
- 0 days/yr
- Unhealthy air days in 30 yrs
- 2 days/yr
Risk factors via First Street. Map © Google.
Why this score? — see what drove the C grade
The composite is a weighted blend of 9 inputs, each scored 0–100. Each bar is that input's sub-score; the figure is the points it added to the 100-point composite (weight × sub-score).
- Cash flow +19.0/30.0
- 1% rule +10.0/10.0
- ARV discount +7.5/15.0
- DSCR +6.0/10.0
- Schools +4.3/10.0
- Livability +3.5/5.0
- Condition / age +2.5/5.0
- Rent growth +2.4/5.0
- Appreciation +0.0/10.0
$135,000
🖨 Deal sheet 📄 Offer letter ✓ Due diligence
Listing remarks
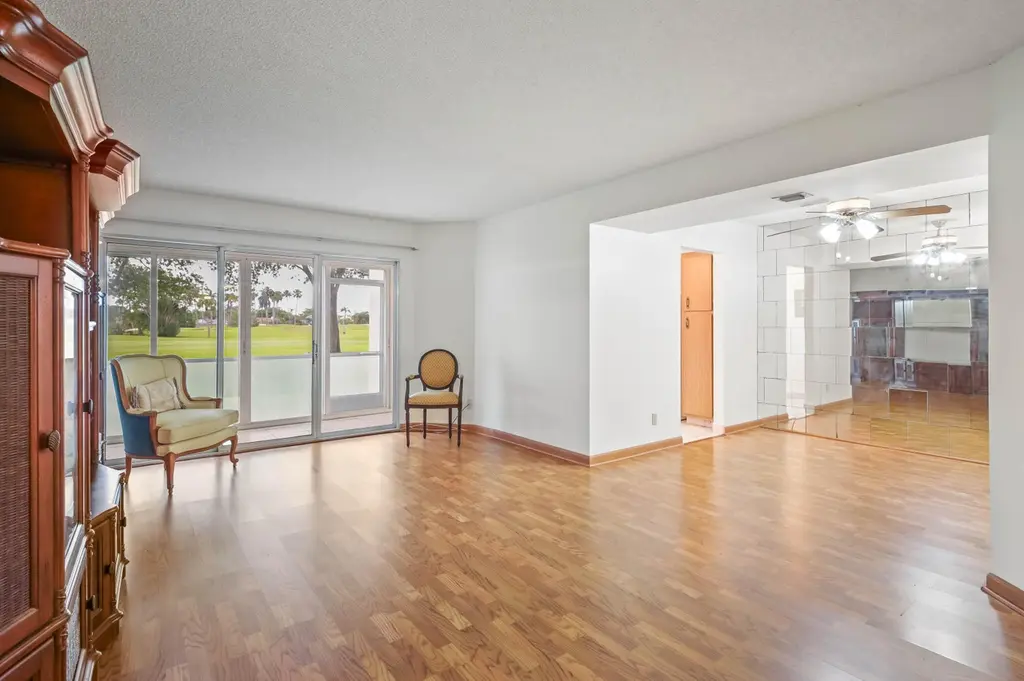
WELCOME TO THIS CONVENIENT GOLF FRONT CONDO! LIFE IS A BIT EASIER WITH PARKING IN FRONT OF YOUR FIRST FLOOR HOME. THIS POPULAR FLOOR PLAN INCLUDES A 24' GLASSED & SCREENED PATIO THAT OPENS INTO THE EAT-IN KITCHEN, LIVING ROOM & THE MASTER BEDROOM WITH ITS 2 CLOSETS (1 IS A WALK-IN) & UPDATED WALK-IN SHOWER. A SPLIT BEDROOM PLAN GIVES YOUR GUESTS A MURPHY BED (GIVING YOU SPACE FOR USE WHEN A BED IS NOT NEEDED) & AN ADJACENT FULL BATH WITH A WALK-IN "SAFE STEP" TUB. THIS HOME HAS BEEN PAINTED, HAS A NEW ELECTRIC PANEL, WELL SERVICED TRANE A. C. UNIT, 2019 WATER HEATER & IS IN A BUILDING WITH A NEW ROOF & PAINT. THE SUBDIVISION POOL IS NEARBY. US
Key facts
- Golf front condo
- First floor home
- Eat-in kitchen
Tags
Property features AI
Finance
- Other: Pets not allowed
- Financial info: $500.52 annual tax amount
- HOA & community: Association: POINCIANA CONDOMINIUM PLACE 9; Monthly HOA fee of $752 includes cable TV, internet, grounds and structure maintenance, sewer, trash, water, common areas, reserve funds, roof repairs, recreation facility and pool service; Community amenities include billiard room, clubhouse, fitness center, golf course, game room, parking, pool, tennis courts, cafe/restaurant, internet included, library, lobby and pickleball courts; Senior community
Exterior
- Parking: Assigned parking; Guest parking; Total of 1 parking space
- Security: Smoke detectors
- Utilities: Public water; Public sewer; Three-phase electric service; Cable available; Electricity available; Sewer available; Water available
- Home design: Condominium; One level; Faces East; Resale unit
- Construction: Stucco construction; Other roof type; Building has 6 stories; Building name: 9 IMPERIAL SOUTH
- Exterior features: Covered patio; Screened patio; Patio with glass enclosure; Located on a golf course; Paved access
Interior
- Kitchen: Electric range; Dishwasher; Microwave; Refrigerator; Garbage disposal; Electric water heater
- Bedrooms: 2 bedrooms on the main level
- Flooring: Carpet; Laminate; Tile
- Bathrooms: 2 full bathrooms on the main level
- Heating & cooling: Central individual heating; Central individual cooling
- Interior features: Entrance foyer; Walk-in closets; Split bedroom layout; Partially furnished
- Laundry & utility: Laundry closet inside the unit
Neighborhood map
What this means for you Summary
Snapshot
- This is a 2-bed/2.0-bath condo listed at $135k.
Deal economics
- At list price, monthly cash flow is $142 ($2k/yr) — positive.
- The deal already cash-flows at list — no discount required.
- Meets the 1% rule at list price ($2k rent vs $135k).
- Recommended offer: $133k (1.5% below list) — sets the bar for market timing.
Location & tenants
- Location reads 69/100 on livability (#490 in FL) — a middle-class / working-renter tenant base. Strengths: cost of living A+, housing A+, health & safety A; Watch: employment D, amenities F, commute F.
- Palm Beach (suburban): math 46% / reading 53% proficiency, ranked #34 of 73 in FL (top 47%) — families likely to look elsewhere, expect single-tenant / working-renter base with shorter leases.
- Zoned schools: Liberty Park Elementary School (math 25% / reading 38%, grade F, #1,841 of 2,144 statewide, top 86%, 845 students, 76% FRL); Okeeheelee Middle School (math 34% / reading 40%, grade F, #399 of 571 statewide, top 71%, 1,377 students, 68% FRL) — zoned schools average 72% FRL vs 52% district-wide (20 pts higher); higher-poverty schools than district average — tighter screening recommended.
- Zoned-school proficiency averages 34% at this address vs 50% district-wide (-15 pts) — the specific schools serving this property underperform the Palm Beach average; the district grade overstates school quality for this exact location.
- Market conditions: Rents soft (-0.4%/yr); 651 active listings in the ZIP; 40 comparable units currently listed for rent nearby; rentals at typical pace (median 24d on market — plan ~3-4 weeks tenant-placement turnaround); solid renter incomes; 3,974 units permitted in Palm Beach County in 2024 (1,012 in 5+ unit buildings).
Forward outlook
- Local home prices are declining (-3.0%/yr); year-one equity from $933 of loan paydown is wiped out by about $4k of value loss. Plan a longer hold.
- Palm Beach County population projected at +30% by 2050 — long-run rental-demand tailwind backs the buy-and-hold thesis.
Negotiation context
- It's been on market 17 days — a 2% lower offer ($133k) is reasonable based on typical stale-listing flexibility.
- Current owner paid $65k; list at $135k implies a 108% gain — meaningful room to come down on a strong offer.
Risks & watch-outs
- Watch-outs: HOA is 35% of rent.
- Climate carrying-cost: severe wind risk, 99% chance of damaging wind over 30y; extreme-heat days projected 7→26/yr by 2055 (HVAC capex compounding) — expect insurance premiums to compound above CPI over the hold.
Questions for the listing agent
- Built in 1974 — when were the roof, HVAC, electrical panel, plumbing, and water heater last replaced?
- What does the HOA fee cover, when was the last increase, and are there any pending special assessments or reserve-fund shortfalls?
- Any open or pending special assessments — roof, HVAC, plumbing, elevator, façade? What's the per-unit balance and payoff schedule, and is the seller paying it off at close or rolling it to the buyer?
- Is there a deadline driving the sale (1031 exchange, divorce, estate, relocation)? That informs how much negotiation room exists.
- Schools are D-rated, which usually means shorter tenancies and higher turnover. Who's the typical renter profile here, and what's been the actual vacancy rate?
- What's the average days-on-market for RENTAL listings here right now (not sales)? A rising rental-DOM trend means longer vacancies and softer asking-rent achievability than the comps imply.
- What's the recent tenant-quality profile in this submarket — average credit score on applications, eviction rate, late-payment / NSF rate, and stable-employment percentage? A property-management company in the area should have these aggregated.
- How much new apartment / multifamily construction is in the pipeline within 1–3 miles? Heavy new supply (>2% of stock underway) typically softens rents 12–24 months out; light construction supports rent growth.
Investment metrics
- 1% rule
- 1.59% ✓
- Cap rate
- 7.55%
- Cash-on-cash
- 4.51%
- DSCR
- 1.20
- GRM
- 5.2
CMA / ARV
No comps found within radius.
Projected returns pro-forma
-3.0% appreciation · 0.0% rent growth · sell at horizon
- IRR
- -14.5%
- Equity multiple
- 0.50×
- Total profit
- $-18,725
- Equity at exit
- $20,129
- IRR
- -16.7%
- Equity multiple
- 0.28×
- Total profit
- $-27,341
- Equity at exit
- $11,672
Cash invested: $37,800 (down + closing). Projections, not guarantees.
Landlord ↔ Tenant lean methodology
- Overall (STATE)
- 87 Strongly Landlord-Friendly
- State Florida
- 87 Strongly Landlord-Friendly · R+3
- County
- — inherits STATE
- City
- — inherits STATE
ZIP-level market 33467
- Rents YoY
- -0.4%
- Active inventory
- 651
- Price-to-rent
- 5.2×
Monthly cashflow live
- Estimated rent
- $2,152 high interval (Pro) →
- Mortgage (P&I)
- −$708
- Tax from tax record
- −$42 /mo · $501/yr
- Insurance
- −$56
- HOA
- −$752
- Vacancy / Maint / Mgmt
- −$452
- Net cashflow
- $142
Break-even live
UW: 25.0% down · 7.5% · 30yr · 1.5% tax · 5.0% vac · 8.0% maint · 8.0% mgmt
Financing live
Cash to close
- Down payment
- $33,750
- Closing costs
- $4,050
- Reserves months
- —
- Total cash needed
- —
Loan-product check · same deal, 3 products live
Conventional
25% down · 7.5% · 30yr
- Down + closing
- —
- Monthly P&I
- —
- Monthly cashflow
- —
- DSCR
- —
- Eligible?
- —
Personal DTI + credit; lowest rate.
DSCR
20% down · 8.5% · 30yr
- Down + closing
- —
- Monthly P&I
- —
- Monthly cashflow
- —
- DSCR
- —
- Eligible?
- —
No personal income docs; deal must DSCR.
Hard money
10% down · 12.0% · 12mo
- Down + closing
- —
- Monthly P&I
- —
- Monthly cashflow
- —
- DSCR
- —
- Eligible?
- —
Short-term bridge; refi at stabilization.
Rent comps 40 comps
| Address | Beds | Baths | Sqft | Rent | $/sqft | DOM | Units | Dist |
|---|---|---|---|---|---|---|---|---|
| 3810 Via Poinciana #404 Lake Worth, FL | 2.0 | 2.0 | 1114 | $1,900 | $1.71 | 7d | 1 | 0.14mi |
| 3755 Via Poinciana #304 Lake Worth, FL | 2.0 | 2.0 | 1103 | $2,000 | $1.81 | 24d | 1 | 0.14mi |
| 4070 Tivoli Ct #307 Lake Worth, FL | 2.0 | 2.0 | 939 | $1,675 | $1.78 | 5d | 1 | 0.18mi |
| 4070 Tivoli Ct #307 Lake Worth, FL | 2.0 | 2.0 | 939 | $1,750 | $1.86 | 20d | 1 | 0.18mi |
| 4080 Tivoli Ct #307 Lake Worth, FL | 3.0 | 2.0 | 1253 | $1,999 | $1.60 | 24d | 1 | 0.23mi |
| 386 Bennington Ln Lake Worth, FL | 2.0 | 2.0 | 941 | $2,000 | $2.13 | 15d | 1 | 0.24mi |
| 3661 Via Poinciana #616 Lake Worth, FL | 2.0 | 2.0 | 1103 | $2,000 | $1.81 | 13d | 1 | 0.25mi |
| 3661 Via Poinciana #616 Lake Worth, FL | 2.0 | 2.0 | 1103 | $2,000 | $1.81 | 22d | 1 | 0.25mi |
| 4373 Trevi Ct Lake Worth, FL | 2.0 | 1.5 | 1080 | $2,500 | $2.31 | 17d | 1 | 0.31mi |
| 4100 Tivoli Ct #104 Lake Worth, FL | 1.0 | 1.0 | 780 | $1,600 | $2.05 | 24d | 1 | 0.34mi |
| 4120 Tivoli Ct #305 Lake Worth, FL | 1.0 | 1.0 | 704 | $1,750 | $2.49 | 24d | 1 | 0.34mi |
| 4363 Trevi Ct #203 Lake Worth, FL | 1.0 | 1.5 | 761 | $1,650 | $2.17 | 24d | 1 | 0.35mi |
| 3593 Birdie Dr #103 Lake Worth, FL | 1.0 | 1.5 | 824 | $1,600 | $1.94 | 24d | 1 | 0.35mi |
| 3590 Via Poinciana #510 Lake Worth, FL | 1.0 | 1.5 | 849 | $1,600 | $1.88 | 24d | 1 | 0.38mi |
| 192 Cape Cod Cir Lake Worth, FL | 1.0 | 1.5 | 902 | $1,850 | $2.05 | 24d | 1 | 0.41mi |
| 4228 Deste Ct Greenacres, FL | 3.0 | 2.5 | 1497 | $3,000 | $2.00 | 18d | 1 | 0.42mi |
| 4345 Trevi Ct #204 Lake Worth, FL | 2.0 | 2.0 | 1005 | $2,100 | $2.09 | 20d | 1 | 0.42mi |
| 4230 Deste Ct Unit 305 Greenacres, FL | 1.0 | 1.0 | 716 | $1,900 | $2.65 | 5d | 1 | 0.44mi |
| 4284 Deste Ct #304 Greenacres, FL | 1.0 | 1.0 | 716 | $2,200 | $3.07 | 16d | 1 | 0.47mi |
| 245 Down East Ln Unit B Lake Worth, FL | 2.0 | 2.0 | 941 | $1,900 | $2.02 | 24d | 1 | 0.48mi |
| 4236 Deste Ct #108 Greenacres, FL | 1.0 | 1.0 | 716 | $1,800 | $2.51 | 17d | 1 | 0.49mi |
| 3326 Arcara Way #108 Lake Worth, FL | 2.0 | 2.0 | 1222 | $1,825 | $1.49 | 16d | 1 | 0.52mi |
| 711 Laconia Cir Unit B Lake Worth, FL | 2.0 | 2.0 | 1088 | $2,300 | $2.11 | 24d | 1 | 0.55mi |
| 733 Nantucket Cir Lake Worth, FL | 2.0 | 2.0 | 941 | $2,500 | $2.66 | 24d | 1 | 0.55mi |
| 4242 Deste Ct Unit 208 Greenacres, FL | 2.0 | 2.0 | 978 | $2,500 | $2.56 | 24d | 1 | 0.55mi |
| 6615 Waterfront Xing Lake Worth, FL | 1.0–3.0 | 1.0–2.0 | 1087 | $2,864 | $2.63 | 1d | 22 | 0.57mi |
| 845 Salem Ln Lake Worth, FL | 2.0 | 2.0 | 1024 | $1,850 | $1.81 | 24d | 1 | 0.60mi |
| 3286 Arcara Way #413 Lake Worth, FL | 2.0 | 2.0 | 1222 | $1,850 | $1.51 | 24d | 1 | 0.60mi |
| 4266 Deste Ct #107 Greenacres, FL | 2.0 | 2.0 | 978 | $2,100 | $2.15 | 24d | 1 | 0.64mi |
| 4254 Deste Ct #305 Greenacres, FL | 1.0 | 1.0 | 716 | $1,500 | $2.09 | 24d | 1 | 0.66mi |
| 3212 Strawflower Way Lake Worth, FL | 2.0 | 2.0 | 1017 | $2,000 | $1.97 | 17d | 2 | 0.73mi |
| 4598 Lucerne Lakes Blvd E #101 Lake Worth, FL | 2.0 | 2.0 | 872 | $2,250 | $2.58 | 4d | 1 | 0.73mi |
| 4598 Lucerne Lakes Blvd E #101 Lake Worth, FL | 2.0 | 2.0 | 872 | $2,250 | $2.58 | 24d | 1 | 0.73mi |
| 3212 Strawflower Way Greenacres, FL | 2.0 | 2.0 | 1017 | $2,200 | $2.16 | 10d | 1 | 0.73mi |
| 3212 Strawflower Way #207 Lake Worth, FL | 2.0 | 2.0 | 1017 | $1,850 | $1.82 | 24d | 1 | 0.73mi |
| 4557 Luxemburg Ct Lake Worth, FL | 2.0 | 1.5 | 1065 | $2,400 | $2.25 | 24d | 1 | 0.74mi |
| 4657 Fountains Dr S #206 Lake Worth, FL | 1.0 | 1.0 | 882 | $1,650 | $1.87 | 12d | 1 | 0.74mi |
| 4471 Luxemburg Ct Lake Worth, FL | 2.0 | 2.0 | 1005 | $2,150 | $2.14 | 24d | 2 | 0.75mi |
| 4471 Luxemburg Ct #101 Lake Worth, FL | 2.0 | 2.0 | 1005 | $2,300 | $2.29 | 18d | 1 | 0.75mi |
| 7101 Golf Colony Ct #102 Lake Worth, FL | 2.0 | 2.0 | 790 | $2,500 | $3.16 | 24d | 1 | 0.76mi |
HOA detail condo
- Monthly dues
- $752 · $9,024/yr
- Likely covers
- waterelectricpool
- Assessments
- None detected in remarks — confirm with the listing agent.
Listing history 12 events
-
2026-06-18days on market $135,000 Active 17 DOM
-
2026-06-17days on market $135,000 Active 16 DOM
-
2026-06-16days on market $135,000 Active 15 DOM
-
2026-06-15days on market $135,000 Active 14 DOM
-
2026-06-13days on market $135,000 Active 12 DOM
-
2026-06-09days on market $135,000 Active 8 DOM
-
2026-06-08days on market $135,000 Active 7 DOM
-
2026-06-07days on market $135,000 Active 6 DOM
-
2026-06-04days on market $135,000 Active 3 DOM
-
2026-06-03days on market $135,000 Active 2 DOM
-
2026-06-02remarks 665-char remark
-
2026-06-02$135,000 Active 1 DOM
ⓘ Source: listings_history table (triggers on properties + properties_extension) + one-shot
backfill from property_details.listing_events for pre-trigger history.
Tax reassessment forecast FL · Resets to sale price
- Current annual tax
- $501 · $42/mo
- Projected year-2 tax
- $1,120 · $93/mo
- Expected delta
- +$620/yr (+$52/mo · 123.9%)
ⓘ Screening estimate from a state-policy table — verify with the county assessor before closing.
Climate risk First Street
- Flood 1/10 Low FEMA zone X (unshaded) · 0% chance over 30 yrs
- Wildfire 1/10 Low
- Heat 10/10 Extreme 7 d/yr ≥106°F today · 26 d/yr by 30 yrs out
- Wind 10/10 Extreme 99% chance of damaging wind over 30 yrs
- Air quality 2/10 Low 0 unhealthy d/yr today · 2 by 30 yrs out
Nearby sold comps map
Loading sold comps map…
Walkable amenities ~0.75 mi
Loading nearby amenities…
Taxation est. · year 1
- Rental income
- $25,821
- − Mortgage interest
- −$7,562
- − Property taxes
- −$501
- − Insurance
- −$675
- − Repairs & maintenance
- −$2,066
- − Management
- −$2,066
- − HOA
- −$9,024
- − Depreciation
- −$3,927
- Taxable income
- $0
- Est. tax owed @ 24.0%
- −$0
- After-tax cash flow
- $1,703/yr
For passive investors: Depreciation is non-cash, so a rental often shows a tax loss while cash-flowing — sheltering income. Rental losses are passive: they offset passive income freely, and up to $25,000/yr can offset ordinary (W-2) income if you actively participate and your MAGI is under $100k (phasing out to $0 by $150k); unused losses carry forward. On sale, claimed depreciation is recaptured at up to 25%, and gains may owe capital-gains tax (a 1031 exchange can defer both). Figures are a year-1 estimate at your 24.0% rate — not tax advice; consult a CPA.
Schools (NCES district)
- District
- Palm Beach
- NCES district ID
- 1201500
- Math proficiency
- 46% ▼ -16.00%
- Reading proficiency
- 53% ▼ -4.00%
- Median HH income
- $53,943
- Composite
- 42.72/100
- National rank
- #3160
- State rank
- #34 of 73 in FL
Livability — Greenacres
- Score
- 69/100
- State rank
- #490
- US rank
- #9008
Category grades
Schools grade is shown separately in the Schools card above.
Census & demographics
- County
- Palm Beach County · 1,438,312 people
- City population
- 65,478
- Metro
- Miami-Fort Lauderdale-Pompano Beach, FL
- Population (ZIP)
- 58,411
- Household income
- $95,739
- Rent vs Own
- Severe rent burden
- 960.0
Population outlook (Palm Beach County) Hauer SSP2
- Today (2025)
- 1,637,487 people
- By 2030
- 1,743,255 · +6.5%
- By 2040
- 1,948,712 · +19.0%
- By 2050
- 2,132,979 · +30.3%
- By 2075
- 2,530,027 · +54.5%
- By 2100
- 2,706,979 · +65.3%
Race, ethnicity, and origin ACS 2023
- Neighborhood character
- Diverse neighborhood (Simpson 0.59)
- Race & ethnicity
- White 59% Hispanic / Latino 22% Two or more races 13% Black 10% Asian 4%
- Hispanic origin (detail)
- Mexican 2% Puerto Rican 4% Cuban 4% Dominican 2%
- Common ancestry
- Romanian 4% Scotch-Irish 3% Hispanic 3%
- Foreign-born
- 24% · Canada, Jamaica, Vietnam
- Languages at home
- 71% English-only · Spanish 17% French/Haitian/Cajun 5% Other Indo-European 3%
Political lean MEDSL · Palm Beach
- 2024 margin
- Toss-up / Even · D 50.0% · R 49.2%
- 2008→2024 swing
- -22.1pp toward R · 2008: 22.9pp · 2024: 0.8pp
- All cycles
- 2024: D+0.8 2020: D+12.8 2016: D+15.3 2012: D+17.0 2008: D+22.9
Not yet ingested
- Civics
- —
Market trends
- HPI YoY
- ▼ -288.94%
- Current HPI
- 343.7738
- Rent YoY
- ▼ -0.40%
- Metro
- Miami-Fort Lauderdale-Pompano Beach, FL
- State GDP YoY
- ▲ 3.28%
- F500 in state
- 36
Industry mix (Fortune 500 HQ in FL)
| Industry | F500 HQs | Revenue |
|---|---|---|
| Industrial Technology | 2 | $29B |
|
||
| Insurance | 2 | $17B |
|
||
| Retail | 1 | $60B |
|
||
| Technology Distribution | 1 | $58B |
|
||
| Homebuilding | 1 | $35B |
|
||
| Technology Manufacturing | 1 | $35B |
|
||
Price history
+107.7% since first listed2 events — show timeline
- 2026-06-01 Listed $135,000 Beaches MLS
- 1986-07-01 Sold (Public Records) $65,000 Public Records
Property tax history
+2.1%/yrLatest (2025): $501 · +5.8% YoY. Source: county tax records.
Cash-flow waterfall
monthlySold comps — $/sqft
last 12 mo · ≤1 miLoading sold comps…