 6-Plex
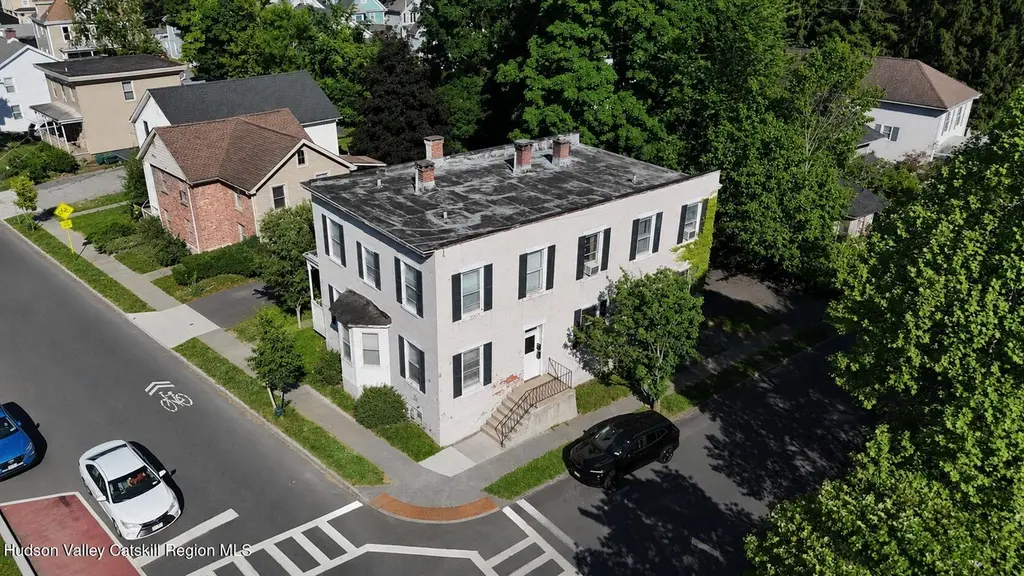
86 Pine St · Kingston, NY
Flood risk 1/10 · Minimal
- FEMA flood zone
- X (unshaded)
- Chance of flooding over 30 yrs
- 0.0%
- Est. flood insurance / yr
- $473 – $860
Fire risk 1/10 · Minimal
- Est. fire insurance / yr
- $691 – $1,283
Heat risk 4/10 · Minor
- Hot days now (above 100°F)
- 7 days/yr
- Hot days in 30 yrs
- 16 days/yr
Wind risk 3/10 · Minor
- Chance of severe wind over 30 yrs
- 8.0%
Air-quality risk 2/10 · Minimal
- Unhealthy air days now
- 1 days/yr
- Unhealthy air days in 30 yrs
- 1 days/yr
Risk factors via First Street. Map © Google.
Why this score? — see what drove the B grade
The composite is a weighted blend of 9 inputs, each scored 0–100. Each bar is that input's sub-score; the figure is the points it added to the 100-point composite (weight × sub-score).
- Cash flow +30.0/30.0
- 1% rule +10.0/10.0
- DSCR +10.0/10.0
- ARV discount +7.5/15.0
- Rent growth +4.5/5.0
- Schools +4.4/10.0
- Livability +4.1/5.0
- Condition / age +2.2/5.0
- Appreciation +0.0/10.0
$660,000
🖨 Deal sheet 📄 Offer letter ✓ Due diligence
Multi-family units
County records classify this as Multi-Family (5+ Unit). Listing-text estimate: 6 units. confirmed
5+ unit building — per-unit beds/baths from public records are typically unavailable; the breakdown below (if shown) is an estimate from the listing text.
Listing remarks
A six-unit multifamily building in the heart of Kingston, one of the Hudson Valley's strongest and fastest-appreciating rental markets. Six units under one roof -- a clean, manageable footprint ideal for an owner-operator or an investor establishing a foothold in the region. The unit mix spans two studios and four one-bedrooms, with several units currently renting well below market. For the right buyer, that gap is the opportunity: a stabilized, income-producing asset today with clear room to grow as legacy units turn over and rents reset to current Kingston levels. Kingston continues to draw renters priced out of the metro area -- demand that has kept quality multifamily tight and well-occ
Key facts
- Well occupied
- Multifamily building
- 4,155 sq ft lot
Tags
Property features AI
Finance
- Financial info: Annual taxes reported
Exterior
- Utilities: Zoned T4N-O
- Home design: Multi-family residential building
- Construction: Built and configured to provide 3,025 above-grade finished square feet
- Exterior features: Corner location at Pine and Franklin
Interior
- Interior features: Residential income property (multi-family)
Neighborhood map
What this means for you Summary
Snapshot
- This is a 6 × 2-bed/1.5-bath units multifamily listed at $660k. Condition is rated fair.
Deal economics
- At list price, monthly cash flow is $4k ($48k/yr) — positive. Per door: $668/mo.
- The deal already cash-flows at list — no discount required.
- Meets the 1% rule at list price ($11k rent vs $660k).
- Cap rate 13.6% vs local median 3.0% in Kingston — top-decile yield for the area; either an underpriced asset or a hidden risk that comps aren't pricing in. Stress-test before assuming the spread holds.
Location & tenants
- Location reads 82/100 on livability (#74 in NY, #1,143 nationally) — a professional / high-income tenant draw. Strengths: amenities A+, housing A+, health & safety A+; Watch: crime C-, schools D+.
- Kingston City School District (urban): math 44% / reading 59% proficiency, ranked #355 of 590 in NY (top 60%) — acceptable for families but not a draw, mixed tenant base, ~2y average lease.
- Market conditions: Rents rising fast (+7.8%/yr); 225 active listings in the ZIP; 464 units permitted in Ulster County in 2024 (170 in 5+ unit buildings).
- At $10,845/mo this rent would consume 188% of the median local household income ($69k/yr) (locally 2045% of renters already pay >50% of income on rent) — very limited rent-growth headroom before tenants either downsize or default.
Forward outlook
- Local home prices are declining (-3.0%/yr); year-one equity from $5k of loan paydown is wiped out by about $20k of value loss. Plan a longer hold.
- Ulster County population projected at -14% by 2050 — secular population decline; favor cash flow + early exit over multi-decade hold.
- At projected returns (-3.0% appreciation + 7.8% rent growth), your $185k cash investment doubles in ~4 years — after that, you're playing with house money.
Negotiation context
- Only 11 days on market — expect competitive offers; lowballing is unlikely to land.
Risks & watch-outs
- Watch-outs: built in 1920 — expect roof / HVAC / electrical / plumbing capex.
Questions for the listing agent
- Can we see the unit-by-unit rent roll, current vacancy, and any below-market leases? What's the average tenancy length?
- What capital expenditures (roof, boiler, parking lot, exteriors) have been made in the last 5 years, and what's planned in the next 2?
- Have any recent inspections been done? Can we get a copy of the seller's disclosures and any deferred-maintenance estimates?
- Built in 1920 — when were the roof, HVAC, electrical panel, plumbing, and water heater last replaced?
- Is there a deadline driving the sale (1031 exchange, divorce, estate, relocation)? That informs how much negotiation room exists.
- Schools are D-rated, which usually means shorter tenancies and higher turnover. Who's the typical renter profile here, and what's been the actual vacancy rate?
- What's the average days-on-market for RENTAL listings here right now (not sales)? A rising rental-DOM trend means longer vacancies and softer asking-rent achievability than the comps imply.
- What's the recent tenant-quality profile in this submarket — average credit score on applications, eviction rate, late-payment / NSF rate, and stable-employment percentage? A property-management company in the area should have these aggregated.
- How much new apartment / multifamily construction is in the pipeline within 1–3 miles? Heavy new supply (>2% of stock underway) typically softens rents 12–24 months out; light construction supports rent growth.
Investment metrics
- 1% rule
- 1.64% ✓
- Cap rate
- 13.58%
- Cash-on-cash
- 26.02%
- DSCR
- 2.16
- GRM
- 5.1
CMA / ARV
No comps found within radius.
Projected returns pro-forma
-3.0% appreciation · 7.81% rent growth · sell at horizon
- IRR
- 25.1%
- Equity multiple
- 2.10×
- Total profit
- $203,420
- Equity at exit
- $98,408
- IRR
- 35.7%
- Equity multiple
- 5.09×
- Total profit
- $755,846
- Equity at exit
- $57,065
Cash invested: $184,800 (down + closing). Projections, not guarantees.
Landlord ↔ Tenant lean methodology
- Overall (STATE)
- 15 Strongly Tenant-Friendly
- State New York
- 15 Strongly Tenant-Friendly · D+10
- County
- — inherits STATE
- City
- — inherits STATE
ZIP-level market 12401
- Rents YoY
- 7.8%
- Active inventory
- 225
- Price-to-rent
- 30.4×
Monthly cashflow live
- Estimated rent
- $10,845 medium interval (Pro) →
- Mortgage (P&I)
- −$3,461
- Tax est. 1.5%
- −$825 /mo · $9,900/yr
- Insurance
- −$275
- HOA
- −$0
- Vacancy / Maint / Mgmt
- −$2,277
- Net cashflow
- $4,006
Break-even live
6-unit breakdown (identical units grouped — click to expand)
| Units | Beds | Baths | Est. rent |
|---|---|---|---|
| 6× units | 2 | 1.5 | $10,848 |
| #1 | 2 | 1.5 | $1,808 |
| #2 | 2 | 1.5 | $1,808 |
| #3 | 2 | 1.5 | $1,808 |
| #4 | 2 | 1.5 | $1,808 |
| #5 | 2 | 1.5 | $1,808 |
| #6 | 2 | 1.5 | $1,808 |
| Total (6 units) | $10,845 | ||
UW: 25.0% down · 7.5% · 30yr · 1.5% tax · 5.0% vac · 8.0% maint · 8.0% mgmt
Financing live
Cash to close
- Down payment
- $165,000
- Closing costs
- $19,800
- Reserves months
- —
- Total cash needed
- —
Loan-product check · same deal, 3 products live
Conventional
25% down · 7.5% · 30yr
- Down + closing
- —
- Monthly P&I
- —
- Monthly cashflow
- —
- DSCR
- —
- Eligible?
- —
Personal DTI + credit; lowest rate.
DSCR
20% down · 8.5% · 30yr
- Down + closing
- —
- Monthly P&I
- —
- Monthly cashflow
- —
- DSCR
- —
- Eligible?
- —
No personal income docs; deal must DSCR.
Hard money
10% down · 12.0% · 12mo
- Down + closing
- —
- Monthly P&I
- —
- Monthly cashflow
- —
- DSCR
- —
- Eligible?
- —
Short-term bridge; refi at stabilization.
Listing history 9 events
-
2026-06-19days on market $660,000 Active 11 DOM
-
2026-06-18days on market $660,000 Active 10 DOM
-
2026-06-17days on market $660,000 Active 9 DOM
-
2026-06-16days on market $660,000 Active 8 DOM
-
2026-06-15days on market $660,000 Active 7 DOM
-
2026-06-14days on market $660,000 Active 5 DOM
-
2026-06-12days on market $660,000 Active 4 DOM
-
2026-06-09remarks 699-char remark
-
2026-06-09$660,000 Active 1 DOM
ⓘ Source: listings_history table (triggers on properties + properties_extension) + one-shot
backfill from property_details.listing_events for pre-trigger history.
Climate risk First Street
- Flood 1/10 Low FEMA zone X (unshaded) · 0% chance over 30 yrs
- Wildfire 1/10 Low
- Heat 4/10 Moderate 7 d/yr ≥100°F today · 16 d/yr by 30 yrs out
- Wind 3/10 Moderate 8% chance of damaging wind over 30 yrs
- Air quality 2/10 Low 1 unhealthy d/yr today · 1 by 30 yrs out
Nearby sold comps map
Loading sold comps map…
Walkable amenities ~0.75 mi
Loading nearby amenities…
Taxation est. · year 1
- Rental income
- $130,140
- − Mortgage interest
- −$36,970
- − Property taxes
- −$9,900
- − Insurance
- −$3,300
- − Repairs & maintenance
- −$10,411
- − Management
- −$10,411
- − Depreciation
- −$19,200
- Taxable income
- $39,947
- Est. tax owed @ 24.0%
- −$9,587
- After-tax cash flow
- $38,490/yr
For passive investors: Depreciation is non-cash, so a rental often shows a tax loss while cash-flowing — sheltering income. Rental losses are passive: they offset passive income freely, and up to $25,000/yr can offset ordinary (W-2) income if you actively participate and your MAGI is under $100k (phasing out to $0 by $150k); unused losses carry forward. On sale, claimed depreciation is recaptured at up to 25%, and gains may owe capital-gains tax (a 1031 exchange can defer both). Figures are a year-1 estimate at your 24.0% rate — not tax advice; consult a CPA.
Condition & rehab AI · 7 photos
The property requires significant exterior and interior repairs and maintenance to improve its condition and value. Painting the exterior siding, landscaping, and cleaning the interior spaces would significantly enhance its appeal and marketability.
Repairs flagged
- Major roof — Signs of wear and tear on the roof.
- Major exterior siding — Aged and in need of repainting.
- Major exterior landscaping — Minimal landscaping and snow covering much of the ground.
- Major exterior fencing — Not well-maintained.
- Major kitchen — Cluttered and in need of cleaning.
- Major bedroom — Cluttered and in need of cleaning.
Value-add opportunities
- Both Painting the exterior siding — Improves curb appeal and adds value to the property.
- Both Landscaping and removing snow — Enhances curb appeal and makes the property more attractive to potential buyers/tenants.
- Both Cleaning the kitchen and bedroom — Makes the property more appealing and ready for showings or tenants.
Renovation cost estimate screening
| Repair item | Severity | Est. cost |
|---|---|---|
| roof · Signs of wear and tear on the roof. | Major | $15,000–50,000 |
| exterior siding · Aged and in need of repainting. | Major | $15,000–50,000 |
| exterior landscaping · Minimal landscaping and snow covering much of the ground. | Major | $15,000–50,000 |
| exterior fencing · Not well-maintained. | Major | $15,000–50,000 |
| kitchen · Cluttered and in need of cleaning. | Major | $15,000–50,000 |
| bedroom · Cluttered and in need of cleaning. | Major | $15,000–50,000 |
| Total estimated repair cost · 6 items | $90,000–300,000 |
Value-add ROI direction
- Both Painting the exterior siding — Improves curb appeal and adds value to the property. ↑
- Both Landscaping and removing snow — Enhances curb appeal and makes the property more attractive to potential buyers/tenants. ↑
- Both Cleaning the kitchen and bedroom — Makes the property more appealing and ready for showings or tenants. ↑
ⓘ Cost ranges are severity-bucket heuristics (US national rule-of-thumb). Get contractor quotes + a written scope before underwriting a rehab budget.
Schools (NCES district)
- District
- Kingston City School District
- NCES district ID
- 3616290
- Math proficiency
- 44% ▲ 1.00%
- Reading proficiency
- 59% ▲ 20.00%
- Median HH income
- $52,586
- Composite
- 44.22/100
- National rank
- #2849
- State rank
- #355 of 590 in NY
Livability — Kingston
- Score
- 82/100
- State rank
- #74
- US rank
- #1143
Category grades
Schools grade is shown separately in the Schools card above.
Census & demographics
- Census place
- Kingston, NY
- County
- Ulster County · 56,183 people
- City population
- 35,136
- Metro
- Kingston, NY
- Population (ZIP)
- 35,136
- Household income
- $69,305
- Rent vs Own
- Severe rent burden
- 2045.0
Population outlook (Ulster County) Hauer SSP2
- Today (2025)
- 175,887 people
- By 2030
- 171,876 · -2.3%
- By 2040
- 161,771 · -8.0%
- By 2050
- 151,470 · -13.9%
- By 2075
- 133,023 · -24.4%
- By 2100
- 113,504 · -35.5%
Race, ethnicity, and origin ACS 2023
- Neighborhood character
- Predominantly White (68%)
- Race & ethnicity
- White 68% Hispanic / Latino 14% Black 11% Two or more races 10% Asian 2% Native American 1%
- Hispanic origin (detail)
- Mexican 5% Puerto Rican 4%
- Common ancestry
- Romanian 5% Iranian 3% Lithuanian 2%
- Foreign-born
- 11% · Canada, China
- Languages at home
- 85% English-only · Spanish 9% Other Indo-European 2% French/Haitian/Cajun 1%
Political lean MEDSL · Ulster
- 2024 margin
- D (+18.7) · D 59.3% · R 40.7%
- 2008→2024 swing
- -4.9pp toward R · 2008: 23.6pp · 2024: 18.7pp
- All cycles
- 2024: D+18.7 2020: D+20.9 2016: D+9.1 2012: D+21.9 2008: D+23.6
Not yet ingested
- Civics
- —
Market trends
- HPI YoY
- ▼ -262.90%
- Current HPI
- 369.1984
- Rent YoY
- ▲ 7.81%
- Metro
- Kingston, NY
- State GDP YoY
- ▲ 2.60%
- F500 in state
- 92
Industry mix (Fortune 500 HQ in NY)
| Industry | F500 HQs | Revenue |
|---|---|---|
| Financial Services | 10 | $950B |
|
||
| Consumer Goods | 9 | $162B |
|
||
| Insurance | 4 | $225B |
|
||
| Telecommunications | 2 | $144B |
|
||
| Pharmaceuticals | 2 | $112B |
|
||
| Media / Entertainment | 2 | $69B |
|
||
Price history
1 event — show timeline
- 2026-06-08 Listed $660,000 HVCRMLS
Cash-flow waterfall
monthlySold comps — $/sqft
last 12 mo · ≤1 miLoading sold comps…