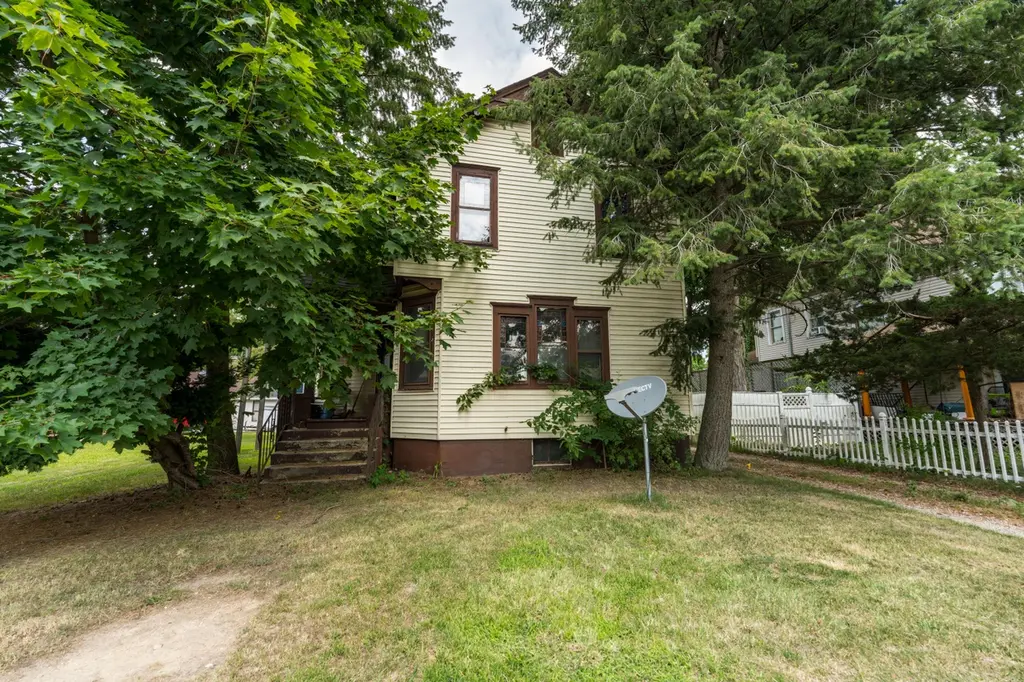
203 E Delaware St · Decatur, MI
Flood risk 1/10 · Minimal
- FEMA flood zone
- X (unshaded)
- Chance of flooding over 30 yrs
- 0.0%
- Est. flood insurance / yr
- $473 – $860
Fire risk 1/10 · Minimal
- Est. fire insurance / yr
- $784 – $1,456
Heat risk 2/10 · Minimal
- Hot days now (above 99°F)
- 7 days/yr
- Hot days in 30 yrs
- 15 days/yr
Wind risk 2/10 · Minimal
- Chance of severe wind over 30 yrs
- —
Air-quality risk 2/10 · Minimal
- Unhealthy air days now
- 1 days/yr
- Unhealthy air days in 30 yrs
- 1 days/yr
Risk factors via First Street. Map © Google.
Why this score? — see what drove the D- grade
The composite is a weighted blend of 9 inputs, each scored 0–100. Each bar is that input's sub-score; the figure is the points it added to the 100-point composite (weight × sub-score).
- Cash flow +17.7/30.0
- DSCR +5.5/10.0
- 1% rule +3.7/10.0
- Livability +3.3/5.0
- Rent growth +2.5/5.0
- Condition / age +2.5/5.0
- Schools +2.4/10.0
- ARV discount +0.0/15.0
- Appreciation +0.0/10.0
$140,000
🖨 Deal sheet 📄 Offer letter ✓ Due diligence
Listing remarks MLS
Investment opportunity. 2 unit (up & down) located in the Village of Decatur, MI. Units are currently vacant for market availability. Utilities are separately metered. The property is being sold in ''as is'' condition.
Key facts
- 8,276 sq ft lot
- 4 parking spots
- Built 1900
Neighborhood map
What this means for you Summary
Snapshot
- This is a 3-bed/2.0-bath single-family listed at $140k.
Deal economics
- At list price, monthly cash flow is $112 ($1k/yr) — positive.
- The deal already cash-flows at list — no discount required.
- To meet the 1% rule (rent ≥ 1% of price), the offer needs to be $121k (13.4% below list).
- Recommended offer: $121k (13.4% below list) — sets the bar for 1% rule.
Location & tenants
- Location reads 66/100 on livability (#437 in MI) — a middle-class / working-renter tenant base. Strengths: cost of living A+, housing A+, health & safety A-; Watch: crime C-, schools D-, amenities F.
- Decatur Public Schools (rural): math 21% / reading 37% proficiency, ranked #381 of 540 in MI (top 71%) — low school quality limits family demand, transient renter base, plan for 1-2y turnover.
- Market conditions: 35 active listings in the ZIP; 165 units permitted in Van Buren County in 2024 (0 in 5+ unit buildings).
Forward outlook
- Local home prices are declining (-3.0%/yr); year-one equity from $968 of loan paydown is wiped out by about $4k of value loss. Plan a longer hold.
- Van Buren County population projected at -23% by 2050 — secular population decline; favor cash flow + early exit over multi-decade hold.
Negotiation context
- It's been on market 96 days — a 9% lower offer ($127k) is reasonable based on typical stale-listing flexibility.
- 4 sale attempts; this cycle's ask has dropped $10k (7%) from the opening price — seller is motivated, your offer sets the floor, not the list.
Risks & watch-outs
- Watch-outs: built in 1900 — expect roof / HVAC / electrical / plumbing capex.
Questions for the listing agent
- It's been on market 96 days. Have you received any prior offers? Is the seller open to a 13% concession, seller financing, or rate buy-down credit?
- Built in 1900 — when were the roof, HVAC, electrical panel, plumbing, and water heater last replaced?
- Why hasn't it sold? Are there any deal-killer items the seller is aware of (foundation, flood, title, zoning, code violations)?
- Is there a deadline driving the sale (1031 exchange, divorce, estate, relocation)? That informs how much negotiation room exists.
- Schools are D-rated, which usually means shorter tenancies and higher turnover. Who's the typical renter profile here, and what's been the actual vacancy rate?
- The area grade is low — what's the realistic commute time and amenity access for the typical tenant pool here? Any planned neighborhood developments (good or bad) we should know about?
- What's the average days-on-market for RENTAL listings here right now (not sales)? A rising rental-DOM trend means longer vacancies and softer asking-rent achievability than the comps imply.
- What's the recent tenant-quality profile in this submarket — average credit score on applications, eviction rate, late-payment / NSF rate, and stable-employment percentage? A property-management company in the area should have these aggregated.
- How much new for-sale + rental construction is in the pipeline within 1–3 miles? Heavy new supply typically softens prices + rents 12–24 months out; constrained supply supports both.
Investment metrics
- 1% rule
- 0.87% ✗
- Cap rate
- 7.25%
- Cash-on-cash
- 3.44%
- DSCR
- 1.15
- GRM
- 9.6
CMA / ARV
- ARV (median comp)
- $97,000
- List price
- $140,000
- Delta
- 44.33%
- Verdict
- OVERPRICED
- Comps
- 3 within 1.0 mi
Show comp detail 11 sales within ~0.75 mi
| Address | Dist | Beds/Ba | Sqft | Sold | Price | $/sf | Match |
|---|---|---|---|---|---|---|---|
| 211 W Delaware St | 0.39mi | 3/1.5 | 1,600 (-8%) | 3mo | $129,500 | $81 | 64 |
| 202 Cedar St | 0.45mi | 3/2.5 | 1,624 (-6%) | 4mo | $210,000 | $129 | 63 |
| 210 W Saint Marys St | 0.39mi | 3/2.0 | 1,712 (-1%) | 21mo | $99,000 | $58 | 62 |
| 319 Clark St | 0.58mi | 3/2.0 | 1,710 (-2%) | 13mo | $289,500 | $169 | 60 |
| 44714 County Road 352 | 0.69mi | 3/2.0 | 1,724 (-1%) | 13mo | $255,000 | $148 | 56 |
| 309 E Delaware St | 0.18mi | 2/2.0 (-1) | 1,512 (-13%) | 11mo | $170,000 | $112 | 56 |
| 307 Pine St | 0.56mi | 3/2.0 | 1,576 (-9%) | 4mo | $220,000 | $140 | 55 |
| 315 E St Marys St | 0.24mi | 3/1.0 | 1,500 (-14%) | 9mo | $115,000 | $77 | 54 |
| 115 W Delaware St | 0.26mi | 4/2.0 (+1) | 1,556 (-10%) | 15mo | $99,000 | $64 | 53 |
| 109 Cedar St | 0.36mi | 4/1.0 (+1) | 1,552 (-11%) | 10mo | $188,000 | $121 | 48 |
| 545 Cherry Ln | 0.64mi | 3/1.5 | 1,495 (-14%) | 21mo | $210,000 | $140 | 28 |
Match score weights: distance 35% · size 25% · config 20% · recency 20%. Top-matched comps best support the ARV.
Projected returns pro-forma
-3.0% appreciation · 3.0% rent growth · sell at horizon
- IRR
- -10.9%
- Equity multiple
- 0.60×
- Total profit
- $-15,595
- Equity at exit
- $20,874
- IRR
- -1.7%
- Equity multiple
- 0.88×
- Total profit
- $-4,605
- Equity at exit
- $12,105
Cash invested: $39,200 (down + closing). Projections, not guarantees.
Landlord ↔ Tenant lean methodology
- Overall (STATE)
- 62 Landlord-Friendly
- State Michigan
- 62 Landlord-Friendly · EVEN
- County
- — inherits STATE
- City
- — inherits STATE
ZIP-level market 49045
- Home prices YoY
- -25.1%
- Active inventory
- 35
- Price-to-rent
- 9.6×
Monthly cashflow live
- Estimated rent
- $1,213 medium interval (Pro) →
- Mortgage (P&I)
- −$734
- Tax from tax record
- −$53 /mo · $641/yr
- Insurance
- −$58
- HOA
- −$0
- Vacancy / Maint / Mgmt
- −$255
- Net cashflow
- $112
Break-even live
UW: 25.0% down · 7.5% · 30yr · 1.5% tax · 5.0% vac · 8.0% maint · 8.0% mgmt
Financing live
Cash to close
- Down payment
- $35,000
- Closing costs
- $4,200
- Reserves months
- —
- Total cash needed
- —
Loan-product check · same deal, 3 products live
Conventional
25% down · 7.5% · 30yr
- Down + closing
- —
- Monthly P&I
- —
- Monthly cashflow
- —
- DSCR
- —
- Eligible?
- —
Personal DTI + credit; lowest rate.
DSCR
20% down · 8.5% · 30yr
- Down + closing
- —
- Monthly P&I
- —
- Monthly cashflow
- —
- DSCR
- —
- Eligible?
- —
No personal income docs; deal must DSCR.
Hard money
10% down · 12.0% · 12mo
- Down + closing
- —
- Monthly P&I
- —
- Monthly cashflow
- —
- DSCR
- —
- Eligible?
- —
Short-term bridge; refi at stabilization.
Listing history 22 events
-
2026-06-18days on market $140,000 Active 96 DOM
-
2026-06-17days on market $140,000 Active 95 DOM
-
2026-06-16days on market $140,000 Active 94 DOM
-
2026-06-15days on market $140,000 Active 93 DOM
-
2026-06-13days on market $140,000 Active 91 DOM
-
2026-06-12days on market $140,000 Active 90 DOM
-
2026-06-09days on market $140,000 Active 87 DOM
-
2026-06-08days on market $140,000 Active 86 DOM
-
2026-06-07days on market $140,000 Active 85 DOM
-
2026-06-07days on market $140,000 Active 84 DOM
-
2026-06-04days on market $140,000 Active 81 DOM
-
2026-06-02days on market $140,000 Active 80 DOM
-
2026-06-01days on market $140,000 Active 79 DOM
-
2026-05-31days on market $140,000 Active 78 DOM
-
2026-05-31days on market $140,000 Active 77 DOM
-
2026-04-16status Active 224-char remark
Show marketing remark (224 chars)
Investment opportunity. 2 unit (up & down) located in the Village of Decatur, MI. Units are currently vacant for market availability. Utilities are separately metered. The property is being sold in ''as is'' condition.
-
2026-04-16status Active 224-char remark
Show marketing remark (224 chars)
Investment opportunity. 2 unit (up & down) located in the Village of Decatur, MI. Units are currently vacant for market availability. Utilities are separately metered. The property is being sold in ''as is'' condition.
-
2025-08-16historical 224-char remark
Show marketing remark (224 chars)
Investment opportunity. 2 unit (up & down) located in the Village of Decatur, MI. Units are currently vacant for market availability. Utilities are separately metered. The property is being sold in ''as is'' condition.
-
2025-08-12price $140,000 224-char remark
Show marketing remark (224 chars)
Investment opportunity. 2 unit (up & down) located in the Village of Decatur, MI. Units are currently vacant for market availability. Utilities are separately metered. The property is being sold in ''as is'' condition.
-
2025-08-11price $140,000 224-char remark
Show marketing remark (224 chars)
Investment opportunity. 2 unit (up & down) located in the Village of Decatur, MI. Units are currently vacant for market availability. Utilities are separately metered. The property is being sold in ''as is'' condition.
-
2025-06-24$150,000 Active 224-char remark
Show marketing remark (224 chars)
Investment opportunity. 2 unit (up & down) located in the Village of Decatur, MI. Units are currently vacant for market availability. Utilities are separately metered. The property is being sold in ''as is'' condition.
-
2025-06-24$150,000 Active 224-char remark
Show marketing remark (224 chars)
Investment opportunity. 2 unit (up & down) located in the Village of Decatur, MI. Units are currently vacant for market availability. Utilities are separately metered. The property is being sold in ''as is'' condition.
ⓘ Source: listings_history table (triggers on properties + properties_extension) + one-shot
backfill from property_details.listing_events for pre-trigger history.
Tax reassessment forecast MI · Partial reset (capped growth)
- Current annual tax
- $641 · $53/mo
- Projected year-2 tax
- $1,398 · $117/mo
- Expected delta
- +$758/yr (+$63/mo · 118.3%)
ⓘ Screening estimate from a state-policy table — verify with the county assessor before closing.
Climate risk First Street
- Flood 1/10 Low FEMA zone X (unshaded) · 0% chance over 30 yrs
- Wildfire 1/10 Low
- Heat 2/10 Low 7 d/yr ≥99°F today · 15 d/yr by 30 yrs out
- Wind 2/10 Low
- Air quality 2/10 Low 1 unhealthy d/yr today · 1 by 30 yrs out
Nearby sold comps map
Loading sold comps map…
Walkable amenities ~0.75 mi
Loading nearby amenities…
Taxation est. · year 1
- Rental income
- $14,554
- − Mortgage interest
- −$7,842
- − Property taxes
- −$641
- − Insurance
- −$700
- − Repairs & maintenance
- −$1,164
- − Management
- −$1,164
- − Depreciation
- −$4,073
- Taxable loss
- −$1,030
- Est. tax savings @ 24.0%
- +$247
- After-tax cash flow
- $1,594/yr
For passive investors: Depreciation is non-cash, so a rental often shows a tax loss while cash-flowing — sheltering income. Rental losses are passive: they offset passive income freely, and up to $25,000/yr can offset ordinary (W-2) income if you actively participate and your MAGI is under $100k (phasing out to $0 by $150k); unused losses carry forward. On sale, claimed depreciation is recaptured at up to 25%, and gains may owe capital-gains tax (a 1031 exchange can defer both). Figures are a year-1 estimate at your 24.0% rate — not tax advice; consult a CPA.
Schools (NCES district)
- District
- Decatur Public Schools
- NCES district ID
- 2611670
- Math proficiency
- 21% ▼ -6.00%
- Reading proficiency
- 37% ▼ -7.00%
- Median HH income
- $41,230
- Composite
- 24.48/100
- National rank
- #7659
- State rank
- #381 of 540 in MI
Livability — Decatur
- Score
- 66/100
- State rank
- #437
- US rank
- #12164
Category grades
Schools grade is shown separately in the Schools card above.
Census & demographics
- Census place
- Decatur, MI
- Population (ZIP)
- 5,109
Population outlook (Van Buren County) Hauer SSP2
- Today (2025)
- 71,479 people
- By 2030
- 68,693 · -3.9%
- By 2040
- 62,093 · -13.1%
- By 2050
- 55,232 · -22.7%
- By 2075
- 40,786 · -42.9%
- By 2100
- 27,785 · -61.1%
Race, ethnicity, and origin ACS 2023
- Neighborhood character
- Predominantly White (84%)
- Race & ethnicity
- White 84% Hispanic / Latino 8% Two or more races 7% Black 2% Native American 2%
- Hispanic origin (detail)
- Mexican 6%
- Common ancestry
- Iranian 7% Romanian 6% Portuguese 2%
- Foreign-born
- 3% · Canada
- Languages at home
- 93% English-only · Spanish 6%
Political lean MEDSL · Van Buren
- 2024 margin
- R (+15.1) · D 41.7% · R 56.9% · Other 1.4%
- 2008→2024 swing
- -23.9pp toward R · 2008: 8.8pp · 2024: -15.1pp
- All cycles
- 2024: R+15.1 2020: R+12.3 2016: R+13.9 2012: D+0.5 2008: D+8.8
Not yet ingested
- Civics
- —
Market trends
- HPI YoY
- ▼ -70.63%
- Current HPI
- 211.3353
- Rent YoY
- —
- Metro
- —
- State GDP YoY
- ▲ 1.37%
- F500 in state
- 28
Industry mix (Fortune 500 HQ in MI)
| Industry | F500 HQs | Revenue |
|---|---|---|
| Automotive Parts | 3 | $48B |
|
||
| Automotive | 2 | $372B |
|
||
| Chemicals | 1 | $45B |
|
||
| Automotive Retail | 1 | $29B |
|
||
| Healthcare / Medical Devices | 1 | $23B |
|
||
| Automotive Technology | 1 | $20B |
|
||
Price history
-6.7% since first listed7 events — show timeline
- 2026-04-16 Relisted — REALCOMP
- 2026-04-16 Relisted — MiRealSource-MiMLS
- 2025-08-16 Listing Removed — MiRealSource-MiMLS
- 2025-08-12 Price Changed $140,000 MiRealSource-MiMLS
- 2025-08-11 Price Changed $140,000 REALCOMP
- 2025-06-24 Listed $150,000 MiRealSource-MiMLS
- 2025-06-24 Listed $150,000 REALCOMP
Property tax history
-5.7%/yrLatest (2025): $641 · -61.4% YoY. Source: county tax records.
Cash-flow waterfall
monthlySold comps — $/sqft
last 12 mo · ≤1 miLoading sold comps…