 Multi-family
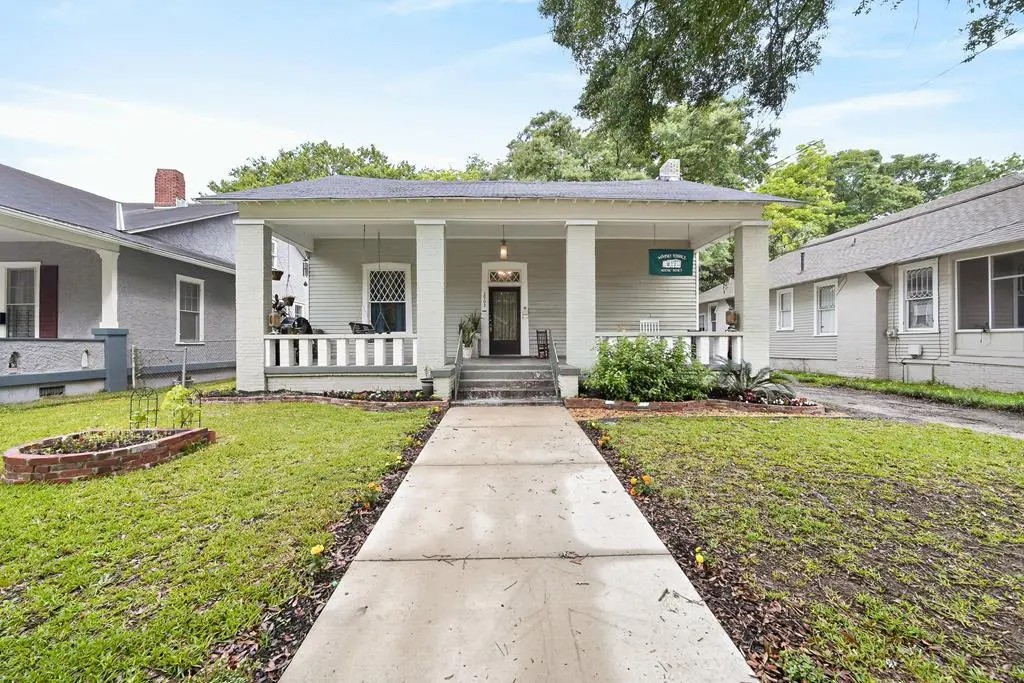
2903 Beacon Ave · Columbus, GA
Flood risk 1/10 · Minimal
- FEMA flood zone
- X (unshaded)
- Chance of flooding over 30 yrs
- 0.0%
- Est. flood insurance / yr
- $507 – $1,088
Fire risk 1/10 · Minimal
- Est. fire insurance / yr
- $963 – $1,789
Heat risk 7/10 · Major
- Hot days now (above 107°F)
- 7 days/yr
- Hot days in 30 yrs
- 19 days/yr
Wind risk 6/10 · Moderate
- Chance of severe wind over 30 yrs
- 68.0%
Air-quality risk 5/10 · Moderate
- Unhealthy air days now
- 7 days/yr
- Unhealthy air days in 30 yrs
- 8 days/yr
Risk factors via First Street. Map © Google.
Why this score? — see what drove the B- grade
The composite is a weighted blend of 9 inputs, each scored 0–100. Each bar is that input's sub-score; the figure is the points it added to the 100-point composite (weight × sub-score).
- Cash flow +30.0/30.0
- DSCR +10.0/10.0
- 1% rule +9.8/10.0
- ARV discount +7.5/15.0
- Rent growth +3.3/5.0
- Livability +3.2/5.0
- Condition / age +2.5/5.0
- Schools +2.2/10.0
- Appreciation +0.0/10.0
$238,500
🖨 Deal sheet 📄 Offer letter ✓ Due diligence
Multi-family units
County records classify this as Multi-Family (2-4 Unit). Listing-text estimate: 1 unit. estimate disagrees with records
Listing remarks MLS
Own a home in Historic Columbus. This home is 110 years old with MANY updates. This would also make a great Air BNB! The roof, hvac, & water heater are from 2020, along with plumbing and electrical updates. New flooring was just added! This home still has plenty of historical character like a decorative fireplace in each room. The large hallway & high ceilings make each room feel grand. There are 3 bedrooms and 2.5 baths. The master bathroom has a tiled shower and walk-in closet storage system. The kitchen has beautiful gray cabinetry & butcher block counters. The backyard is fenced & there are sidewalks throughout the neighborhood.
Key facts
- Gilded ceilings
- Transom windows
- Fenced backyard
Tags
Property features AI
Exterior
- Home design: Residential single-family home; Located in WAVERLY TERRACE
- Exterior features: Pets allowed; Directions: Take Veterans Parkway to River Road, right on Hamilton Road, left on 27th Street, left on Beacon Avenue; house on the left
Interior
- Bathrooms: 2 full bathrooms; 1 half bathroom
- Interior features: Fireplace (3 total)
Neighborhood map
What this means for you Summary
Snapshot
- This is a 3-bed/2.0-bath multifamily listed at $238k.
Deal economics
- At list price, monthly cash flow is $1k ($14k/yr) — positive.
- The deal already cash-flows at list — no discount required.
- Meets the 1% rule at list price ($4k rent vs $238k).
- Recommended offer: $235k (1.5% below list) — sets the bar for market timing.
- Cap rate 12.0% vs local median 4.7% in Columbus — top-decile yield for the area; either an underpriced asset or a hidden risk that comps aren't pricing in. Stress-test before assuming the spread holds.
Location & tenants
- Location reads 64/100 on livability (#254 in GA) — a middle-class / working-renter tenant base. Strengths: cost of living A+, housing A+, health & safety B; Watch: amenities D+, schools F, crime F.
- Muscogee County (urban): math 21% / reading 30% proficiency, ranked #120 of 174 in GA (top 69%) — low school quality limits family demand, transient renter base, plan for 1-2y turnover; 61% free/reduced lunch — lower-income household profile, screen leases tightly.
- Market conditions: Rents rising (+3.0%/yr); 327 active listings in the ZIP; 2 comparable units currently listed for rent nearby; 291 units permitted in Muscogee County in 2024 (30 in 5+ unit buildings).
- At $3,518/mo this rent would consume 64% of the median local household income ($66k/yr) (locally 2030% of renters already pay >50% of income on rent) — very limited rent-growth headroom before tenants either downsize or default.
Forward outlook
- Local home prices are declining (-3.0%/yr); year-one equity from $2k of loan paydown is wiped out by about $7k of value loss. Plan a longer hold.
- Muscogee County population projected at +15% by 2050 — modest demand growth; plan on rents tracking national, not racing it.
- At projected returns (-3.0% appreciation + 3.0% rent growth), your $67k cash investment doubles in ~6 years — after that, you're playing with house money.
Negotiation context
- It's been on market 16 days — a 2% lower offer ($235k) is reasonable based on typical stale-listing flexibility.
- 5 sale attempts since 7y ago with the ask held roughly flat each time — persistent listings suggest the price (not the market) is what's stuck; bring a comps-based counter.
- Current owner paid $202k; 18% above their basis — modest negotiation headroom, anchor on the comps not their cost.
Risks & watch-outs
- Watch-outs: built in 1914 — expect roof / HVAC / electrical / plumbing capex.
- Climate carrying-cost: major wind risk, 68% chance of damaging wind over 30y; extreme-heat days projected 7→19/yr by 2055 (HVAC capex compounding) — expect insurance premiums to compound above CPI over the hold.
Questions for the listing agent
- Built in 1914 — when were the roof, HVAC, electrical panel, plumbing, and water heater last replaced?
- Is there a deadline driving the sale (1031 exchange, divorce, estate, relocation)? That informs how much negotiation room exists.
- Schools are F-rated, which usually means shorter tenancies and higher turnover. Who's the typical renter profile here, and what's been the actual vacancy rate?
- Crime grade is F in this area — have there been break-ins, vandalism, or insurance claims at this property in the last 3 years? What carrier currently insures it and at what premium?
- What's the average days-on-market for RENTAL listings here right now (not sales)? A rising rental-DOM trend means longer vacancies and softer asking-rent achievability than the comps imply.
- What's the recent tenant-quality profile in this submarket — average credit score on applications, eviction rate, late-payment / NSF rate, and stable-employment percentage? A property-management company in the area should have these aggregated.
- How much new apartment / multifamily construction is in the pipeline within 1–3 miles? Heavy new supply (>2% of stock underway) typically softens rents 12–24 months out; light construction supports rent growth.
Investment metrics
- 1% rule
- 1.48% ✓
- Cap rate
- 12.01%
- Cash-on-cash
- 20.40%
- DSCR
- 1.91
- GRM
- 5.6
CMA / ARV
No comps found within radius.
Projected returns pro-forma
-3.0% appreciation · 3.04% rent growth · sell at horizon
- IRR
- 12.7%
- Equity multiple
- 1.51×
- Total profit
- $33,863
- Equity at exit
- $35,561
- IRR
- 21.7%
- Equity multiple
- 2.85×
- Total profit
- $123,394
- Equity at exit
- $20,621
Cash invested: $66,780 (down + closing). Projections, not guarantees.
Landlord ↔ Tenant lean methodology
- Overall (STATE)
- 90 Strongly Landlord-Friendly
- State Georgia
- 90 Strongly Landlord-Friendly · R+3
- County
- — inherits STATE
- City
- — inherits STATE
ZIP-level market 31904
- Rents YoY
- 3.0%
- Active inventory
- 327
- Price-to-rent
- 16.9×
Monthly cashflow live
- Estimated rent
- $3,518 high interval (Pro) →
- Mortgage (P&I)
- −$1,251
- Tax from tax record
- −$294 /mo · $3,524/yr
- Insurance
- −$99
- HOA
- −$0
- Vacancy / Maint / Mgmt
- −$739
- Net cashflow
- $1,135
Break-even live
3-unit breakdown (identical units grouped — click to expand)
| Units | Beds | Baths | Est. rent |
|---|---|---|---|
| 3× units | 3 | 2.5 | $3,519 |
| #1 | 3 | 2.5 | $1,173 |
| #2 | 3 | 2.5 | $1,173 |
| #3 | 3 | 2.5 | $1,173 |
| Total (3 units) | $3,518 | ||
UW: 25.0% down · 7.5% · 30yr · 1.5% tax · 5.0% vac · 8.0% maint · 8.0% mgmt
Financing live
Cash to close
- Down payment
- $59,625
- Closing costs
- $7,155
- Reserves months
- —
- Total cash needed
- —
Loan-product check · same deal, 3 products live
Conventional
25% down · 7.5% · 30yr
- Down + closing
- —
- Monthly P&I
- —
- Monthly cashflow
- —
- DSCR
- —
- Eligible?
- —
Personal DTI + credit; lowest rate.
DSCR
20% down · 8.5% · 30yr
- Down + closing
- —
- Monthly P&I
- —
- Monthly cashflow
- —
- DSCR
- —
- Eligible?
- —
No personal income docs; deal must DSCR.
Hard money
10% down · 12.0% · 12mo
- Down + closing
- —
- Monthly P&I
- —
- Monthly cashflow
- —
- DSCR
- —
- Eligible?
- —
Short-term bridge; refi at stabilization.
Rent comps 2 comps
| Address | Beds | Baths | Sqft | Rent | $/sqft | DOM | Units | Dist |
|---|---|---|---|---|---|---|---|---|
| 2908 10th Ave Columbus, GA | 3.0 | 2.0 | 2232 | $2,000 | $0.90 | 43d | 1 | 0.05mi |
| 1908 Garrard St Columbus, GA | 4.0 | 2.0 | 1716 | $1,600 | $0.93 | 21d | 1 | 1.01mi |
Listing history 13 events
-
2026-06-18days on market $238,500 Active 16 DOM
-
2026-06-17days on market $238,500 Active 15 DOM
-
2026-06-16days on market $238,500 Active 14 DOM
-
2026-06-15days on market $238,500 Active 13 DOM
-
2026-06-14days on market $238,500 Active 11 DOM
-
2026-06-13days on market $238,500 Active 10 DOM
-
2026-06-10days on market $238,500 Active 8 DOM
-
2026-06-09days on market $238,500 Active 7 DOM
-
2026-06-08days on market $238,500 Active 6 DOM
-
2026-06-07days on market $238,500 Active 5 DOM
-
2026-06-05days on market $238,500 Active 2 DOM
-
2026-06-03remarks 699-char remark
-
2026-06-03$238,500 Active 1 DOM
ⓘ Source: listings_history table (triggers on properties + properties_extension) + one-shot
backfill from property_details.listing_events for pre-trigger history.
Tax reassessment forecast GA · Resets to sale price
- Current annual tax
- $3,524 · $294/mo
- Projected year-2 tax
- $3,524 · $294/mo
- Expected delta
- $0/yr ($0/mo · 0.0%)
ⓘ Screening estimate from a state-policy table — verify with the county assessor before closing.
Climate risk First Street
- Flood 1/10 Low FEMA zone X (unshaded) · 0% chance over 30 yrs
- Wildfire 1/10 Low
- Heat 7/10 Severe 7 d/yr ≥107°F today · 19 d/yr by 30 yrs out
- Wind 6/10 Major 68% chance of damaging wind over 30 yrs
- Air quality 5/10 Major 7 unhealthy d/yr today · 8 by 30 yrs out
Nearby sold comps map
Loading sold comps map…
Walkable amenities ~0.75 mi
Loading nearby amenities…
Taxation est. · year 1
- Rental income
- $42,216
- − Mortgage interest
- −$13,360
- − Property taxes
- −$3,524
- − Insurance
- −$1,192
- − Repairs & maintenance
- −$3,377
- − Management
- −$3,377
- − Depreciation
- −$6,938
- Taxable income
- $10,447
- Est. tax owed @ 24.0%
- −$2,507
- After-tax cash flow
- $11,118/yr
For passive investors: Depreciation is non-cash, so a rental often shows a tax loss while cash-flowing — sheltering income. Rental losses are passive: they offset passive income freely, and up to $25,000/yr can offset ordinary (W-2) income if you actively participate and your MAGI is under $100k (phasing out to $0 by $150k); unused losses carry forward. On sale, claimed depreciation is recaptured at up to 25%, and gains may owe capital-gains tax (a 1031 exchange can defer both). Figures are a year-1 estimate at your 24.0% rate — not tax advice; consult a CPA.
Schools (NCES district)
- District
- Muscogee County
- NCES district ID
- 1303870
- Math proficiency
- 21% ▼ -11.00%
- Reading proficiency
- 30% ▼ -7.00%
- Median HH income
- $41,176
- Composite
- 21.6/100
- National rank
- #8297
- State rank
- #120 of 174 in GA
Livability — Columbus
- Score
- 64/100
- State rank
- #254
- US rank
- #14102
Category grades
Schools grade is shown separately in the Schools card above.
Census & demographics
- Census place
- Columbus, GA
- County
- Muscogee County · 180,764 people
- City population
- 180,764
- Metro
- Columbus, GA-AL
- Population (ZIP)
- 35,405
- Household income
- $66,291
- Rent vs Own
- Severe rent burden
- 2030.0
Population outlook (Muscogee County) Hauer SSP2
- Today (2025)
- 216,729 people
- By 2030
- 224,504 · +3.6%
- By 2040
- 238,318 · +10.0%
- By 2050
- 249,027 · +14.9%
- By 2075
- 264,862 · +22.2%
- By 2100
- 254,786 · +17.6%
Race, ethnicity, and origin ACS 2023
- Neighborhood character
- Diverse neighborhood (Simpson 0.60)
- Race & ethnicity
- White 56% Black 28% Two or more races 8% Hispanic / Latino 7% Asian 2%
- Hispanic origin (detail)
- Mexican 3% Puerto Rican 1%
- Common ancestry
- Slovak 1% Italian 1% Romanian 1%
- Foreign-born
- 5% · Canada, South Korea
- Languages at home
- 93% English-only · Spanish 4% Korean 1% German/W. Germanic 1%
Political lean MEDSL · Muscogee
- 2024 margin
- Strong D (+23.4) · D 61.4% · R 38.0%
- 2008→2024 swing
- +3.7pp toward D · 2008: 19.7pp · 2024: 23.4pp
- All cycles
- 2024: D+23.4 2020: D+24.0 2016: D+18.6 2012: D+21.3 2008: D+19.7
Not yet ingested
- Civics
- —
Market trends
- HPI YoY
- ▼ -152.06%
- Current HPI
- 155.1405
- Rent YoY
- ▲ 3.04%
- Metro
- Columbus, GA-AL
- State GDP YoY
- ▲ 2.66%
- F500 in state
- 28
Industry mix (Fortune 500 HQ in GA)
| Industry | F500 HQs | Revenue |
|---|---|---|
| Paper / Packaging | 2 | $29B |
|
||
| Retail | 1 | $160B |
|
||
| Transportation / Logistics | 1 | $91B |
|
||
| Airlines | 1 | $62B |
|
||
| Consumer Goods | 1 | $47B |
|
||
| Utilities | 1 | $25B |
|
||
Price history
+1092.5% since first listed16 events — show timeline
- 2026-06-02 Listed $238,500 CBOR
- 2024-08-20 Sold (Public Records) $202,500 Public Records
- 2024-08-19 Sold (MLS) $202,500 CBOR
- 2024-07-15 Pending — CBOR
- 2024-07-01 Price Changed $190,000 CBOR
- 2024-06-14 Price Changed $193,000 CBOR
- 2024-05-10 Relisted — CBOR
- 2024-04-23 Pending — CBOR
- 2024-03-22 Listed $199,900 CBOR
- 2020-12-08 Sold (Public Records) $163,000 Public Records
- 2020-12-04 Sold (MLS) $163,000 CBOR
- 2020-10-28 Listed $169,000 CBOR
- 2020-03-12 Sold (Public Records) $34,000 Public Records
- 2020-03-09 Sold (MLS) $34,000 CBOR
- 2019-06-23 Listed $34,900 CBOR
- 2016-11-15 Sold (Public Records) $20,000 Public Records
Property tax history
+8.6%/yrLatest (2025): $3,524 · +8.1% YoY. Source: county tax records.
Cash-flow waterfall
monthlySold comps — $/sqft
last 12 mo · ≤1 miLoading sold comps…