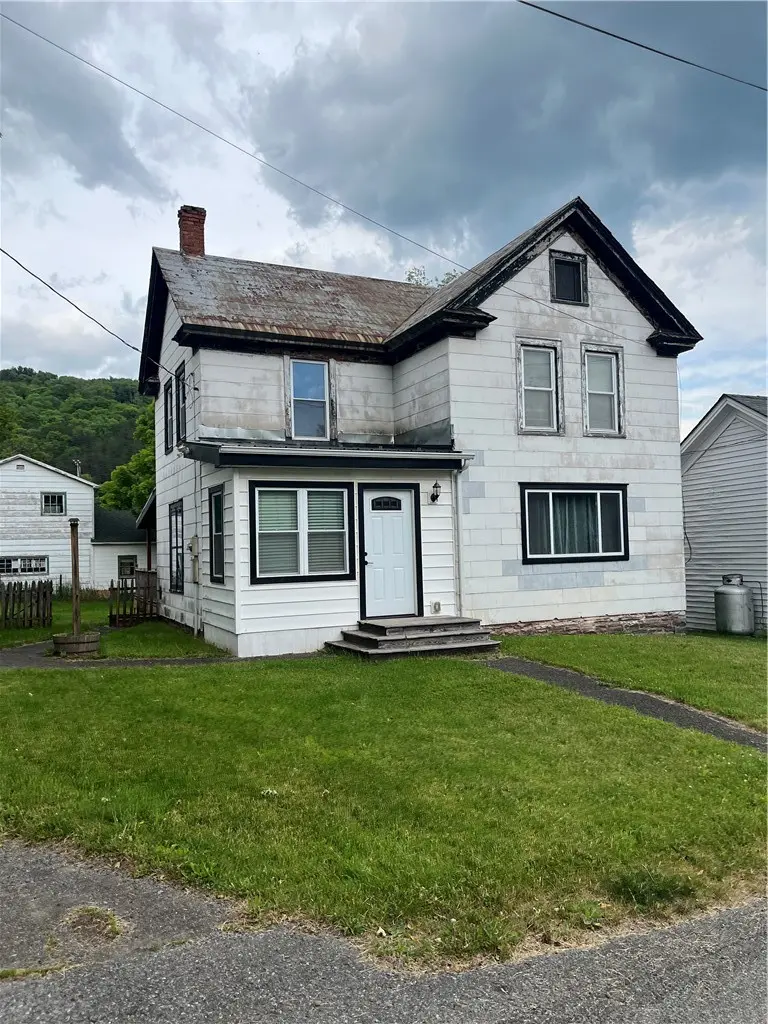
48 Church St · Bloomville, NY
Flood risk 1/10 · Minimal
- FEMA flood zone
- X (unshaded)
- Chance of flooding over 30 yrs
- 0.0%
- Est. flood insurance / yr
- $473 – $860
Fire risk 1/10 · Minimal
- Est. fire insurance / yr
- $691 – $1,283
Heat risk 2/10 · Minimal
- Hot days now (above 89°F)
- 8 days/yr
- Hot days in 30 yrs
- 19 days/yr
Wind risk 2/10 · Minimal
- Chance of severe wind over 30 yrs
- 1.0%
Air-quality risk 1/10 · Minimal
- Unhealthy air days now
- 0 days/yr
- Unhealthy air days in 30 yrs
- 0 days/yr
Risk factors via First Street. Map © Google.
Why this score? — see what drove the B+ grade
The composite is a weighted blend of 9 inputs, each scored 0–100. Each bar is that input's sub-score; the figure is the points it added to the 100-point composite (weight × sub-score).
- Cash flow +30.0/30.0
- 1% rule +10.0/10.0
- DSCR +10.0/10.0
- Appreciation +8.6/10.0
- ARV discount +7.5/15.0
- Schools +4.1/10.0
- Livability +3.2/5.0
- Rent growth +2.5/5.0
- Condition / age +2.5/5.0
$125,000
🖨 Deal sheet (PDF) 📄 Offer letter ✓ Due diligence
Listing remarks MLS
This quiet, cozy country home has so much to offer. Neatly nestled in a small country town, this home includes an additional rent producing dwelling. In need of some TLC this home is conveniently located within walking distance to a beautiful park and playground. Make this charmer yours today.
Key facts
- In-law suite
- Workshop area
- Above storage
Tags
Property features AI
Exterior
- Parking: Detached garage with electricity, heating, and storage (1.5 garage spaces)
- Utilities: Electricity connected; High-speed internet available; Public water connected; Sewer connected
- Home design: 2-story house; Resale property; Metal roof; Rectangular residential lot on a city street (approx. 69 x 110)
- Construction: Aluminum siding; Composite siding; Frame construction; Stone accents; Wood siding; Stone foundation; PEX plumbing
- Exterior features: Blacktop driveway; Deck; Covered porch; Porch; Barn(s); Outbuilding
Interior
- Kitchen: Gas oven; Gas range; Refrigerator; Eat-in kitchen layout
- Bedrooms: Includes convertible bedroom and in-law suite
- Flooring: Carpet; Hardwood; Laminate; Tile; Varies
- Bathrooms: 1 full bathroom; 1 half bathroom; One main-level bathroom
- Heating & cooling: Oil heating; Forced air heating
- Interior features: Ceiling fan(s); Separate/formal dining room; Eat-in kitchen; Separate/formal living room; Pull-down attic stairs; Storage; Natural woodwork; Convertible bedroom; In-law floorplan; See remarks
- Laundry & utility: Main-level laundry
Neighborhood map
What this means for you Summary
Snapshot
- This is a 3-bed/1.5-bath single-family listed at $125k.
Deal economics
- At list price, monthly cash flow is $2k ($22k/yr) — positive.
- The deal already cash-flows at list — no discount required.
- Meets the 1% rule at list price ($4k rent vs $125k).
Location & tenants
- Location reads 64/100 on livability (#771 in NY) — a middle-class / working-renter tenant base. Strengths: cost of living A+, housing A-; Watch: health & safety C-, schools F, crime F.
- South Kortright Central School District (rural): math 50% / reading 40% proficiency, ranked #558 of 755 in NY (top 74%) — families likely to look elsewhere, expect single-tenant / working-renter base with shorter leases.
- Market conditions: 16 active listings in the ZIP; 66 units permitted in Delaware County in 2024 (0 in 5+ unit buildings).
Forward outlook
- In year one you build about $10k of equity ($864 loan paydown + $9k appreciation (7.3% local appreciation)).
- Delaware County population projected at -27% by 2050 — secular population decline; favor cash flow + early exit over multi-decade hold.
- At projected returns (7.3% appreciation + 3.0% rent growth), your $35k cash investment doubles in ~2 years — after that, you're playing with house money.
- By year 4, paydown + projected appreciation supports a ~$34k cash-out refi (75% LTV) — recoverable capital for the next deal without selling this one.
Negotiation context
- Only 12 days on market — expect competitive offers; lowballing is unlikely to land.
- 2 sale attempts since 19y ago with the ask held roughly flat each time — persistent listings suggest the price (not the market) is what's stuck; bring a comps-based counter.
- Current owner paid $98k; 27% above their basis — modest negotiation headroom, anchor on the comps not their cost.
Risks & watch-outs
- Watch-outs: built in 1906 — expect roof / HVAC / electrical / plumbing capex.
Questions for the listing agent
- Built in 1906 — when were the roof, HVAC, electrical panel, plumbing, and water heater last replaced?
- Is there a deadline driving the sale (1031 exchange, divorce, estate, relocation)? That informs how much negotiation room exists.
- Schools are F-rated, which usually means shorter tenancies and higher turnover. Who's the typical renter profile here, and what's been the actual vacancy rate?
- Crime grade is F in this area — have there been break-ins, vandalism, or insurance claims at this property in the last 3 years? What carrier currently insures it and at what premium?
- What's the average days-on-market for RENTAL listings here right now (not sales)? A rising rental-DOM trend means longer vacancies and softer asking-rent achievability than the comps imply.
- What's the recent tenant-quality profile in this submarket — average credit score on applications, eviction rate, late-payment / NSF rate, and stable-employment percentage? A property-management company in the area should have these aggregated.
- How much new for-sale + rental construction is in the pipeline within 1–3 miles? Heavy new supply typically softens prices + rents 12–24 months out; constrained supply supports both.
Investment metrics
- 1% rule
- 2.83% ✓
- Cap rate
- 23.96%
- Cash-on-cash
- 63.08%
- DSCR
- 3.81
- GRM
- 2.9
CMA / ARV
No comps found within radius.
Projected returns pro-forma
7.26% appreciation · 3.0% rent growth · sell at horizon
- IRR
- 72.1%
- Equity multiple
- 5.66×
- Total profit
- $162,967
- Equity at exit
- $88,777
- IRR
- 68.2%
- Equity multiple
- 12.03×
- Total profit
- $386,056
- Equity at exit
- $170,625
Cash invested: $35,000 (down + closing). Projections, not guarantees.
Landlord ↔ Tenant lean methodology
- Overall (STATE)
- 15 Strongly Tenant-Friendly
- State New York
- 15 Strongly Tenant-Friendly · D+10
- County
- — inherits STATE
- City
- — inherits STATE
ZIP-level market 13739
- Home prices YoY
- 2.0%
- Active inventory
- 16
- Price-to-rent
- 2.9×
Monthly cashflow live
- Estimated rent
- $3,535 medium interval (Pro) →
- Mortgage (P&I)
- −$656
- Tax from tax record
- −$245 /mo · $2,942/yr
- Insurance
- −$52
- HOA
- −$0
- Vacancy / Maint / Mgmt
- −$742
- Net cashflow
- $1,840
Break-even live
Sensitivity live
| Price | -10% $1,911 | -5% $1,875 | +0% $1,840 | +5% $1,805 | +10% $1,769 |
|---|---|---|---|---|---|
| Rent | -10% $1,561 | -5% $1,700 | +0% $1,840 | +5% $1,980 | +10% $2,119 |
| Rate | -1.0pp $1,903 | -0.5pp $1,872 | base $1,840 | +0.5pp $1,807 | +1.0pp $1,775 |
UW: 25.0% down · 7.5% · 30yr · 1.5% tax · 5.0% vac · 8.0% maint · 8.0% mgmt
Financing live
Cash to close
- Down payment
- $31,250
- Closing costs
- $3,750
- Reserves months
- —
- Total cash needed
- —
Loan-product check · same deal, 3 products live
Conventional
25% down · 7.5% · 30yr
- Down + closing
- —
- Monthly P&I
- —
- Monthly cashflow
- —
- DSCR
- —
- Eligible?
- —
Personal DTI + credit; lowest rate.
DSCR
20% down · 8.5% · 30yr
- Down + closing
- —
- Monthly P&I
- —
- Monthly cashflow
- —
- DSCR
- —
- Eligible?
- —
No personal income docs; deal must DSCR.
Hard money
10% down · 12.0% · 12mo
- Down + closing
- —
- Monthly P&I
- —
- Monthly cashflow
- —
- DSCR
- —
- Eligible?
- —
Short-term bridge; refi at stabilization.
Listing history 9 events
-
2026-06-21days on market $125,000 Active 12 DOM
-
2026-06-21days on market $125,000 Active 11 DOM
-
2026-06-18days on market $125,000 Active 9 DOM
-
2026-06-17days on market $125,000 Active 8 DOM
-
2026-06-16days on market $125,000 Active 7 DOM
-
2026-06-15days on market $125,000 Active 6 DOM
-
2026-06-13days on market $125,000 Active 4 DOM
-
2026-06-12remarks 583-char remark
-
2026-06-12$125,000 Active 3 DOM
ⓘ Source: listings_history table (triggers on properties + properties_extension) + one-shot
backfill from property_details.listing_events for pre-trigger history.
Tax reassessment forecast NY · Partial reset (capped growth)
- Current annual tax
- $2,942 · $245/mo
- Projected year-2 tax
- $2,942 · $245/mo
- Expected delta
- $0/yr ($0/mo · 0.0%)
ⓘ Screening estimate from a state-policy table — verify with the county assessor before closing.
Climate risk First Street
- Flood 1/10 Low FEMA zone X (unshaded) · 0% chance over 30 yrs
- Wildfire 1/10 Low
- Heat 2/10 Low 8 d/yr ≥89°F today · 19 d/yr by 30 yrs out
- Wind 2/10 Low 100% chance of damaging wind over 30 yrs
- Air quality 1/10 Low 0 unhealthy d/yr today · 0 by 30 yrs out
Nearby sold comps map
Loading sold comps map…
Walkable amenities ~0.75 mi
Loading nearby amenities…
Taxation est. · year 1
- Rental income
- $42,420
- − Mortgage interest
- −$7,002
- − Property taxes
- −$2,942
- − Insurance
- −$625
- − Repairs & maintenance
- −$3,394
- − Management
- −$3,394
- − Depreciation
- −$3,636
- Taxable income
- $21,427
- Est. tax owed @ 24.0%
- −$5,143
- After-tax cash flow
- $16,936/yr
For passive investors: Depreciation is non-cash, so a rental often shows a tax loss while cash-flowing — sheltering income. Rental losses are passive: they offset passive income freely, and up to $25,000/yr can offset ordinary (W-2) income if you actively participate and your MAGI is under $100k (phasing out to $0 by $150k); unused losses carry forward. On sale, claimed depreciation is recaptured at up to 25%, and gains may owe capital-gains tax (a 1031 exchange can defer both). Figures are a year-1 estimate at your 24.0% rate — not tax advice; consult a CPA.
Schools (NCES district)
- District
- South Kortright Central School District
- NCES district ID
- 3627330
- Math proficiency
- 50% ▼ -5.00%
- Reading proficiency
- 40% ▼ -10.00%
- Median HH income
- $50,971
- Composite
- 40.98/100
- National rank
- #7488
- State rank
- #558 of 755 in NY
Livability — Bloomville
- Score
- 64/100
- State rank
- #771
- US rank
- #14764
Category grades
Schools grade is shown separately in the Schools card above.
Census & demographics
- Census place
- Bloomville, NY
- Population (ZIP)
- 792
Population outlook (Delaware County) Hauer SSP2
- Today (2025)
- 42,668 people
- By 2030
- 40,337 · -5.5%
- By 2040
- 35,514 · -16.8%
- By 2050
- 31,265 · -26.7%
- By 2075
- 24,455 · -42.7%
- By 2100
- 19,529 · -54.2%
Race, ethnicity, and origin ACS 2023
- Neighborhood character
- Predominantly White (97%)
- Race & ethnicity
- White 97% Asian 2% Two or more races 1%
- Common ancestry
- Romanian 10% Portuguese 9% Slovak 9%
- Foreign-born
- 4%
- Languages at home
- 96% English-only · Spanish 1% German/W. Germanic 1% Tagalog/Filipino 1%
Political lean MEDSL · Delaware
- 2024 margin
- R (+19.8) · D 40.1% · R 59.9%
- 2008→2024 swing
- -14.6pp toward R · 2008: -5.2pp · 2024: -19.8pp
- All cycles
- 2024: R+19.8 2020: R+18.4 2016: R+29.2 2012: R+9.6 2008: R+5.2
Not yet ingested
- Civics
- —
Market trends
- HPI YoY
- ▲ 7.26%
- Current HPI
- 361.1407
- Rent YoY
- —
- Metro
- —
- State GDP YoY
- ▲ 2.60%
- F500 in state
- 92
Industry mix (Fortune 500 HQ in NY)
| Industry | F500 HQs | Revenue |
|---|---|---|
| Financial Services | 10 | $950B |
|
||
| Consumer Goods | 9 | $162B |
|
||
| Insurance | 4 | $225B |
|
||
| Telecommunications | 2 | $144B |
|
||
| Pharmaceuticals | 2 | $112B |
|
||
| Media / Entertainment | 2 | $69B |
|
||
Price history
+26.3% since first listed4 events — show timeline
- 2026-06-07 Listed $125,000 UNYREIS
- 2007-08-13 Sold (Public Records) $98,050 Public Records
- 2007-07-18 Sold (MLS) $92,500 UNYREIS
- 2007-06-01 Listed $99,000 UNYREIS
Property tax history
+3.2%/yrLatest (2025): $2,942 · +1.5% YoY. Source: county tax records.
Cash-flow waterfall
monthlySold comps — $/sqft
last 12 mo · ≤1 miLoading sold comps…