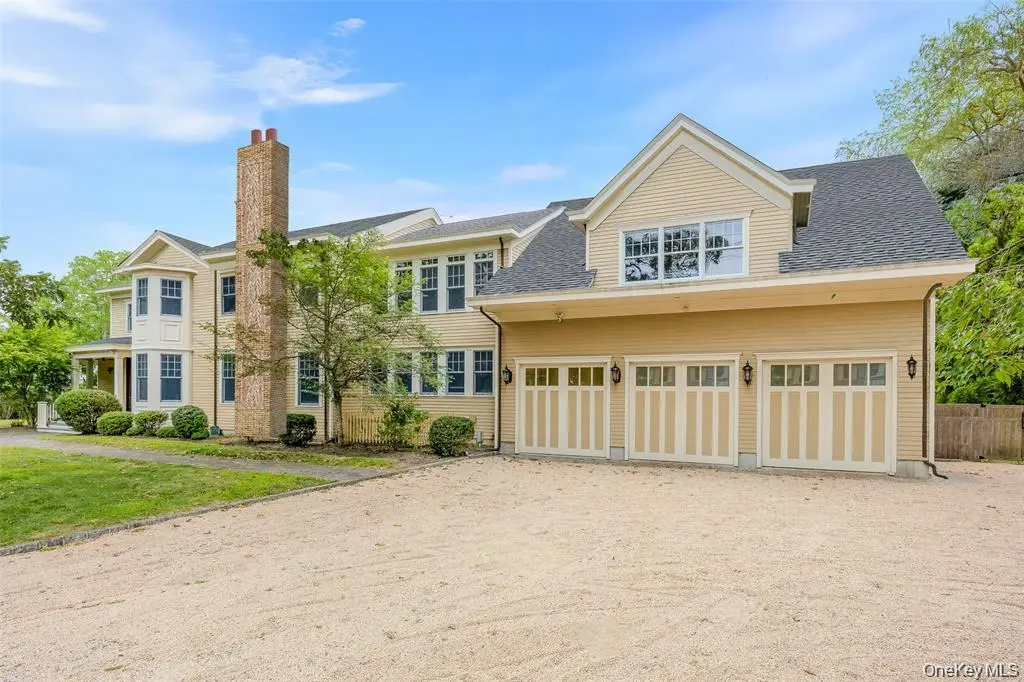
52 Brushy Neck Ln · Westhampton, NY
Flood risk 1/10 · Minimal
- FEMA flood zone
- X (unshaded)
- Chance of flooding over 30 yrs
- 0.0%
- Est. flood insurance / yr
- $507 – $1,088
Fire risk 1/10 · Minimal
- Est. fire insurance / yr
- $691 – $1,283
Heat risk 4/10 · Minor
- Hot days now (above 91°F)
- 7 days/yr
- Hot days in 30 yrs
- 19 days/yr
Wind risk 8/10 · Major
- Chance of severe wind over 30 yrs
- 80.0%
Air-quality risk 4/10 · Minor
- Unhealthy air days now
- 4 days/yr
- Unhealthy air days in 30 yrs
- 5 days/yr
Risk factors via First Street. Map © Google.
Why this score? — see what drove the A grade
The composite is a weighted blend of 9 inputs, each scored 0–100. Each bar is that input's sub-score; the figure is the points it added to the 100-point composite (weight × sub-score).
- Cash flow +30.0/30.0
- ARV discount +15.0/15.0
- DSCR +10.0/10.0
- Appreciation +9.4/10.0
- 1% rule +7.8/10.0
- Schools +6.6/10.0
- Livability +3.0/5.0
- Rent growth +2.5/5.0
- Condition / age +2.5/5.0
$1,899,000
🖨 Deal sheet (PDF) 📄 Offer letter ✓ Due diligence
Listing remarks
Now fully refreshed, vacant, and ready for immediate showings, this Westhampton estate is being reintroduced to the market with renewed appeal. Blending Victorian charm with modern luxury, the residence offers over 5,100 sq ft of finished living space, plus an additional unfinished bonus room and walk-out lower level that bring the total potential to nearly 7,000 sq ft. Set on 1.02 acres south of Montauk Highway, the home features Brazilian cherry floors with maple inlays, intricate millwork, and five fireplaces. The chef’s kitchen is equipped with propane cooking, dual dishwashers, premium appliances, and a wood-burning stove that doubles as a pizza oven. A first-floor guest suite, f
Key facts
- Dual dishwashers
- Propane cooking
- Five fireplaces
Tags
Neighborhood map
What this means for you Summary
Snapshot
- This is a 5-bed/3.5-bath single-family listed at $1.90M.
Deal economics
- At list price, monthly cash flow is $7k ($87k/yr) — positive.
- The deal already cash-flows at list — no discount required.
- Meets the 1% rule at list price ($24k rent vs $1.90M).
- Recommended offer: $1.67M (12.0% below list) — sets the bar for market timing.
- Cap rate 10.9% vs local median 9.0% in Westhampton — meaningfully above typical; check what's discounted (condition, days-on-market, listing class) to confirm the premium yield is real.
Location & tenants
- Location reads 60/100 on livability (#969 in NY) — a middle-class / working-renter tenant base. Strengths: crime A+, employment A+; Watch: housing C-, amenities F, commute F.
- Westhampton Beach Union Free School District (suburban): math 72% / reading 75% proficiency, ranked #81 of 590 in NY (top 14%) — strong family-tenant draw, lease renewals of 3-5y typical.
- Zoned schools: Westhampton Beach Elementary School (math 67% / reading 67%, grade B+, #525 of 2,108 statewide, top 27%, 356 students, 43% FRL); Westhampton Middle School (math 61% / reading 63%, grade B+, #136 of 729 statewide, top 20%, 434 students, 26% FRL); Westhampton Beach Senior High School (math 90% / reading 96%, grade A+, #147 of 1,100 statewide, top 14%, 964 students, 24% FRL).
- Market conditions: 66 active listings in the ZIP; 5 comparable units currently listed for rent nearby; rentals at typical pace (median 24d on market — plan ~3-4 weeks tenant-placement turnaround); 40% of comp listings sitting > 30 days — soft ceiling on asking rent; high-income renter base; 1,366 units permitted in Suffolk County in 2024 (216 in 5+ unit buildings).
Forward outlook
- In year one you build about $181k of equity ($13k loan paydown + $168k appreciation (8.8% local appreciation)).
- Suffolk County population projected to shrink 5% by 2050 — rents likely to lag national; underwrite the cash flow, not the appreciation.
- At projected returns (8.8% appreciation + 3.0% rent growth), your $532k cash investment doubles in ~2 years — after that, you're playing with house money.
- By year 2, paydown + projected appreciation supports a ~$290k cash-out refi (75% LTV) — recoverable capital for the next deal without selling this one.
Negotiation context
- It's been on market 150 days — a 12% lower offer ($1.67M) is reasonable based on typical stale-listing flexibility.
- 10 sale attempts since 6y ago; this cycle's ask has dropped $251k (12%) from the opening price — seller is motivated, your offer sets the floor, not the list.
- Current owner paid $595k; list at $1.90M implies a 219% gain — meaningful room to come down on a strong offer.
Risks & watch-outs
- Climate carrying-cost: severe wind risk, 80% chance of damaging wind over 30y — expect insurance premiums to compound above CPI over the hold.
Questions for the listing agent
- It's been on market 150 days. Have you received any prior offers? Is the seller open to a 12% concession, seller financing, or rate buy-down credit?
- Why hasn't it sold? Are there any deal-killer items the seller is aware of (foundation, flood, title, zoning, code violations)?
- Is there a deadline driving the sale (1031 exchange, divorce, estate, relocation)? That informs how much negotiation room exists.
- Schools are D-rated, which usually means shorter tenancies and higher turnover. Who's the typical renter profile here, and what's been the actual vacancy rate?
- What's the average days-on-market for RENTAL listings here right now (not sales)? A rising rental-DOM trend means longer vacancies and softer asking-rent achievability than the comps imply.
- What's the recent tenant-quality profile in this submarket — average credit score on applications, eviction rate, late-payment / NSF rate, and stable-employment percentage? A property-management company in the area should have these aggregated.
- How much new for-sale + rental construction is in the pipeline within 1–3 miles? Heavy new supply typically softens prices + rents 12–24 months out; constrained supply supports both.
Investment metrics
- 1% rule
- 1.28% ✓
- Cap rate
- 10.89%
- Cash-on-cash
- 16.43%
- DSCR
- 1.73
- GRM
- 6.5
CMA / ARV
- ARV (median comp)
- $3,376,074
- List price
- $1,899,000
- Delta
- -43.75%
- Verdict
- UNDERPRICED
- Comps
- 20 within 1.0 mi
Show comp detail 4 sales within ~0.75 mi
| Address | Dist | Beds/Ba | Sqft | Sold | Price | $/sf | Match |
|---|---|---|---|---|---|---|---|
| 124 Montauk Hwy | 0.39mi | 4/6.5 (-1) | 5,200 (+0%) | 3mo | $2,575,000 | $495 | 62 |
| 15 Summit Blvd | 0.69mi | 6/5.5 (+1) | 5,097 (-2%) | 17mo | $2,250,000 | $441 | 38 |
| 1 Brushy Neck Ln | 0.62mi | 6/6.5 (+1) | 4,500 (-13%) | 4mo | $4,295,000 | $954 | 29 |
| 34 Jagger Ln | 0.61mi | 5/7.5 | 4,600 (-11%) | 14mo | $3,930,000 | $854 | 26 |
Match score weights: distance 35% · size 25% · config 20% · recency 20%. Top-matched comps best support the ARV.
Projected returns pro-forma
8.82% appreciation · 3.0% rent growth · sell at horizon
- IRR
- 34.3%
- Equity multiple
- 3.53×
- Total profit
- $1,347,171
- Equity at exit
- $1,550,678
- IRR
- 30.1%
- Equity multiple
- 7.72×
- Total profit
- $3,572,866
- Equity at exit
- $3,187,178
Cash invested: $531,720 (down + closing). Projections, not guarantees.
Landlord ↔ Tenant lean methodology
- Overall (STATE)
- 15 Strongly Tenant-Friendly
- State New York
- 15 Strongly Tenant-Friendly · D+10
- County
- — inherits STATE
- City
- — inherits STATE
ZIP-level market 11977
- Home prices YoY
- 2.3%
- Active inventory
- 66
- Price-to-rent
- 6.5×
Monthly cashflow live
- Estimated rent
- $24,309 medium interval (Pro) →
- Mortgage (P&I)
- −$9,959
- Tax from tax record
- −$1,172 /mo · $14,067/yr
- Insurance
- −$791
- HOA
- −$0
- Vacancy / Maint / Mgmt
- −$5,105
- Net cashflow
- $7,282
Break-even live
Sensitivity live
| Price | -10% $8,357 | -5% $7,819 | +0% $7,282 | +5% $6,744 | +10% $6,207 |
|---|---|---|---|---|---|
| Rent | -10% $5,361 | -5% $6,322 | +0% $7,282 | +5% $8,242 | +10% $9,202 |
| Rate | -1.0pp $8,238 | -0.5pp $7,765 | base $7,282 | +0.5pp $6,790 | +1.0pp $6,289 |
UW: 25.0% down · 7.5% · 30yr · 1.5% tax · 5.0% vac · 8.0% maint · 8.0% mgmt
Financing live
Cash to close
- Down payment
- $474,750
- Closing costs
- $56,970
- Reserves months
- —
- Total cash needed
- —
Loan-product check · same deal, 3 products live
Conventional
25% down · 7.5% · 30yr
- Down + closing
- —
- Monthly P&I
- —
- Monthly cashflow
- —
- DSCR
- —
- Eligible?
- —
Personal DTI + credit; lowest rate.
DSCR
20% down · 8.5% · 30yr
- Down + closing
- —
- Monthly P&I
- —
- Monthly cashflow
- —
- DSCR
- —
- Eligible?
- —
No personal income docs; deal must DSCR.
Hard money
10% down · 12.0% · 12mo
- Down + closing
- —
- Monthly P&I
- —
- Monthly cashflow
- —
- DSCR
- —
- Eligible?
- —
Short-term bridge; refi at stabilization.
Rent comps 5 comps
| Address | Beds | Baths | Sqft | Rent | $/sqft | DOM | Units | Dist |
|---|---|---|---|---|---|---|---|---|
| 3 Pine Grove Ct Westhampton, NY | 4.0 | 3.5 | 3500 | $35,000 | $10.00 | 23d | 1 | 0.18mi |
| 8 Sweetgrass Rd Westhampton, NY | 5.0 | 4.5 | 4050 | $13,000 | $3.21 | 0d | 1 | 0.47mi |
| 35 Hollow Ln Westhampton, NY | 5.0 | 3.5 | 3500 | $22,000 | $6.29 | 0d | 1 | 0.51mi |
| 6 Bay Meadow Ln Westhampton, NY | 6.0 | 5.0 | 3500 | $40,000 | $11.43 | 45d | 1 | 0.86mi |
| 9 Plume Grass Way Westhampton, NY | 4.0 | 5.5 | 4405 | $40,000 | $9.08 | 45d | 1 | 1.08mi |
Listing history 41 events
-
2026-06-21statusdays on market $1,899,000 Pending 150 DOM
-
2026-06-18days on market $1,899,000 Active 148 DOM
-
2026-06-17days on market $1,899,000 Active 147 DOM
-
2026-06-16days on market $1,899,000 Active 146 DOM
-
2026-06-15days on market $1,899,000 Active 145 DOM
-
2026-06-13days on market $1,899,000 Active 143 DOM
-
2026-06-09days on market $1,899,000 Active 139 DOM
-
2026-06-08days on market $1,899,000 Active 138 DOM
-
2026-06-07days on market $1,899,000 Active 137 DOM
-
2026-06-04days on market $1,899,000 Active 134 DOM
-
2026-06-03days on market $1,899,000 Active 133 DOM
-
2026-06-02days on market $1,899,000 Active 132 DOM
-
2026-06-01days on market $1,899,000 Active 131 DOM
-
2026-05-31days on market $1,899,000 Active 130 DOM
-
2026-05-16historical
-
2026-05-07price $1,899,000
-
2026-04-17price $1,949,000
-
2026-03-24price $1,995,000
-
2026-01-15$2,150,000 Active
-
2026-01-02historical
-
2025-12-20price $2,175,000
-
2025-11-23price $2,249,000
-
2025-08-29$2,299,000 Active
-
2025-04-15$2,650,000 Active
-
2025-03-03price $1,980,000
-
2025-03-02$19,800,000 Active
-
2025-02-27status Active
-
2025-02-24status Pending
-
2025-02-02price $1,999,000
-
2025-01-28$2,295,000 Active
-
2024-11-17$2,295,000 Active
-
2024-10-29historical
-
2024-08-16price $1,899,000
-
2024-07-29historical
-
2024-07-29$2,100,000 Active
-
2024-01-13price $2,100,000
-
2023-11-20$2,550,000 Active
-
2021-03-19historical
-
2020-09-29$2,100,000 Active
-
2004-08-09soldstatus $595,000
-
1987-12-02soldstatus $192,500
ⓘ Source: listings_history table (triggers on properties + properties_extension) + one-shot
backfill from property_details.listing_events for pre-trigger history.
Tax reassessment forecast NY · Partial reset (capped growth)
- Current annual tax
- $14,067 · $1,172/mo
- Projected year-2 tax
- $23,080 · $1,923/mo
- Expected delta
- +$9,013/yr (+$751/mo · 64.1%)
ⓘ Screening estimate from a state-policy table — verify with the county assessor before closing.
Climate risk First Street
- Flood 1/10 Low FEMA zone X (unshaded) · 0% chance over 30 yrs
- Wildfire 1/10 Low
- Heat 4/10 Moderate 7 d/yr ≥91°F today · 19 d/yr by 30 yrs out
- Wind 8/10 Severe 80% chance of damaging wind over 30 yrs
- Air quality 4/10 Moderate 4 unhealthy d/yr today · 5 by 30 yrs out
Nearby sold comps map
Loading sold comps map…
Walkable amenities ~0.75 mi
Loading nearby amenities…
Taxation est. · year 1
- Rental income
- $291,704
- − Mortgage interest
- −$106,374
- − Property taxes
- −$14,067
- − Insurance
- −$9,495
- − Repairs & maintenance
- −$23,336
- − Management
- −$23,336
- − Depreciation
- −$55,244
- Taxable income
- $59,853
- Est. tax owed @ 24.0%
- −$14,365
- After-tax cash flow
- $73,017/yr
For passive investors: Depreciation is non-cash, so a rental often shows a tax loss while cash-flowing — sheltering income. Rental losses are passive: they offset passive income freely, and up to $25,000/yr can offset ordinary (W-2) income if you actively participate and your MAGI is under $100k (phasing out to $0 by $150k); unused losses carry forward. On sale, claimed depreciation is recaptured at up to 25%, and gains may owe capital-gains tax (a 1031 exchange can defer both). Figures are a year-1 estimate at your 24.0% rate — not tax advice; consult a CPA.
Schools (NCES district)
- District
- Westhampton Beach Union Free School District
- NCES district ID
- 3631020
- Math proficiency
- 72% ▼ -5.00%
- Reading proficiency
- 75% ▲ 3.00%
- Median HH income
- $88,137
- Composite
- 65.91/100
- National rank
- #444
- State rank
- #81 of 590 in NY
Livability — Westhampton
- Score
- 60/100
- State rank
- #969
- US rank
- #18972
Category grades
Schools grade is shown separately in the Schools card above.
Census & demographics
- Census place
- Westhampton, NY
- County
- Suffolk County · 679,920 people
- City population
- 2,843
- Metro
- New York-Newark-Jersey City, NY-NJ-PA
- Population (ZIP)
- 2,843
- Household income
- $151,375
- Rent vs Own
- Severe rent burden
- 14.0
Population outlook (Suffolk County) Hauer SSP2
- Today (2025)
- 1,505,262 people
- By 2030
- 1,498,318 · -0.5%
- By 2040
- 1,471,101 · -2.3%
- By 2050
- 1,424,848 · -5.3%
- By 2075
- 1,337,157 · -11.2%
- By 2100
- 1,217,720 · -19.1%
Race, ethnicity, and origin ACS 2023
- Neighborhood character
- Predominantly White (89%)
- Race & ethnicity
- White 89% Hispanic / Latino 5% Asian 3% Two or more races 2%
- Hispanic origin (detail)
- Common ancestry
- Scotch-Irish 3% Romanian 3% Subsaharan African 1%
- Foreign-born
- 11% · Canada, South Korea
- Languages at home
- 89% English-only · Spanish 5% Other Indo-European 4% Korean 2%
Political lean MEDSL · Suffolk
- 2024 margin
- Lean R (+10.0) · D 45.0% · R 55.0%
- 2008→2024 swing
- -16.0pp toward R · 2008: 6.0pp · 2024: -10.0pp
- All cycles
- 2024: R+10.0 2020: R+0.0 2016: R+8.2 2012: D+2.9 2008: D+6.0
Not yet ingested
- Civics
- —
Market trends
- HPI YoY
- ▲ 8.82%
- Current HPI
- 391.8868
- Rent YoY
- —
- Metro
- New York-Newark-Jersey City, NY-NJ-PA
- State GDP YoY
- ▲ 2.60%
- F500 in state
- 92
Industry mix (Fortune 500 HQ in NY)
| Industry | F500 HQs | Revenue |
|---|---|---|
| Financial Services | 10 | $950B |
|
||
| Consumer Goods | 9 | $162B |
|
||
| Insurance | 4 | $225B |
|
||
| Telecommunications | 2 | $144B |
|
||
| Pharmaceuticals | 2 | $112B |
|
||
| Media / Entertainment | 2 | $69B |
|
||
Price history
+886.5% since first listed27 events — show timeline
- 2026-05-16 Listing Removed — OneKey® MLS as Distributed by MLS Grid
- 2026-05-07 Price Changed $1,899,000 OneKey® MLS as Distributed by MLS Grid
- 2026-04-17 Price Changed $1,949,000 OneKey® MLS as Distributed by MLS Grid
- 2026-03-24 Price Changed $1,995,000 OneKey® MLS as Distributed by MLS Grid
- 2026-01-15 Listed $2,150,000 OneKey® MLS as Distributed by MLS Grid
- 2026-01-02 Listing Removed — OneKey® MLS as Distributed by MLS Grid
- 2025-12-20 Price Changed $2,175,000 OneKey® MLS as Distributed by MLS Grid
- 2025-11-23 Price Changed $2,249,000 OneKey® MLS as Distributed by MLS Grid
- 2025-08-29 Listed $2,299,000 OneKey® MLS as Distributed by MLS Grid
- 2025-04-15 Listed $2,650,000 OneKey® MLS as Distributed by MLS Grid
- 2025-03-03 Price Changed $1,980,000 OneKey® MLS as Distributed by MLS Grid
- 2025-03-02 Listed $19,800,000 OneKey® MLS as Distributed by MLS Grid
- 2025-02-27 Relisted — OneKey® MLS as Distributed by MLS Grid
- 2025-02-24 Pending — OneKey® MLS as Distributed by MLS Grid
- 2025-02-02 Price Changed $1,999,000 OneKey® MLS as Distributed by MLS Grid
- 2025-01-28 Listed $2,295,000 OneKey® MLS as Distributed by MLS Grid
- 2024-11-17 Listed $2,295,000 OneKey® MLS as Distributed by MLS Grid
- 2024-10-29 Listing Removed — OneKey® MLS as Distributed by MLS Grid
- 2024-08-16 Price Changed $1,899,000 OneKey® MLS as Distributed by MLS Grid
- 2024-07-29 Listing Removed — OneKey® MLS as Distributed by MLS Grid
- 2024-07-29 Listed $2,100,000 OneKey® MLS as Distributed by MLS Grid
- 2024-01-13 Price Changed $2,100,000 OneKey® MLS as Distributed by MLS Grid
- 2023-11-20 Listed $2,550,000 OneKey® MLS as Distributed by MLS Grid
- 2021-03-19 Listing Removed — OneKey® MLS as Distributed by MLS Grid
- 2020-09-29 Listed $2,100,000 OneKey® MLS as Distributed by MLS Grid
- 2004-08-09 Sold (Public Records) $595,000 Public Records
- 1987-12-02 Sold (Public Records) $192,500 Public Records
Property tax history
+6.4%/yrLatest (2022): $14,067 · +0.0% YoY. Source: county tax records.
Cash-flow waterfall
monthlySold comps — $/sqft
last 12 mo · ≤1 miLoading sold comps…