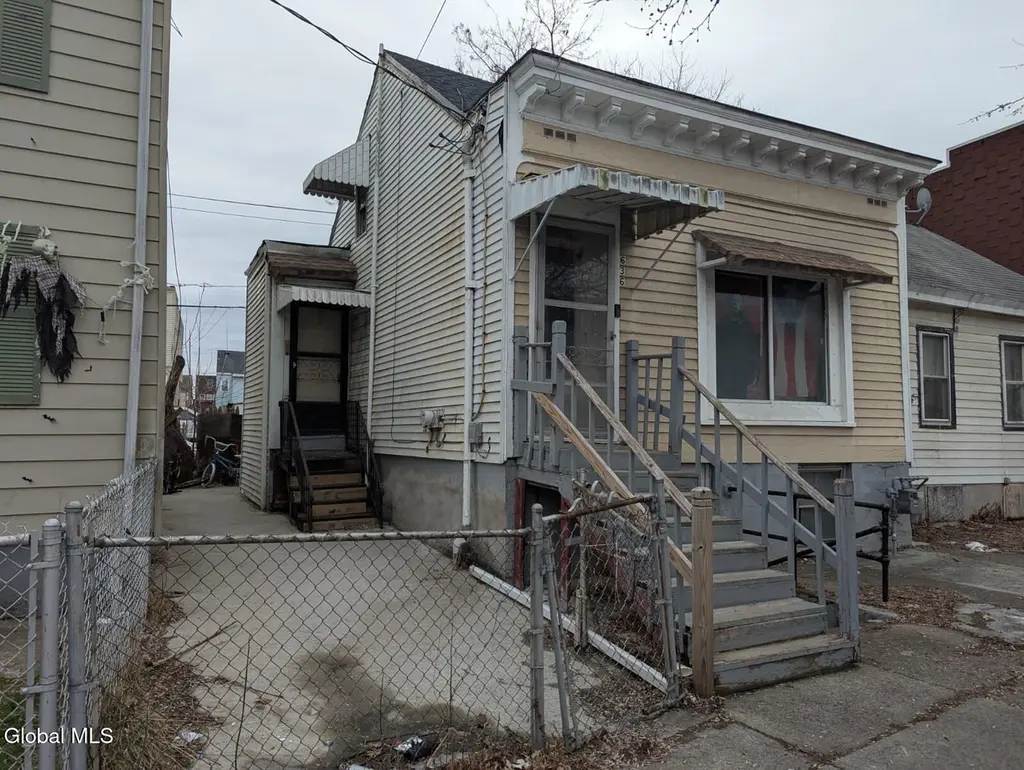
636 Clinton Ave · Albany, NY
Flood risk 1/10 · Minimal
- FEMA flood zone
- X (unshaded)
- Chance of flooding over 30 yrs
- 0.0%
- Est. flood insurance / yr
- $473 – $860
Fire risk 1/10 · Minimal
- Est. fire insurance / yr
- $691 – $1,283
Heat risk 4/10 · Minor
- Hot days now (above 97°F)
- 7 days/yr
- Hot days in 30 yrs
- 16 days/yr
Wind risk 3/10 · Minor
- Chance of severe wind over 30 yrs
- 6.0%
Air-quality risk 1/10 · Minimal
- Unhealthy air days now
- 0 days/yr
- Unhealthy air days in 30 yrs
- 0 days/yr
Risk factors via First Street. Map © Google.
Why this score? — see what drove the C+ grade
The composite is a weighted blend of 9 inputs, each scored 0–100. Each bar is that input's sub-score; the figure is the points it added to the 100-point composite (weight × sub-score).
- Cash flow +25.8/30.0
- DSCR +8.6/10.0
- 1% rule +6.6/10.0
- ARV discount +5.9/15.0
- Livability +4.0/5.0
- Rent growth +3.8/5.0
- Schools +3.2/10.0
- Condition / age +2.5/5.0
- Appreciation +0.0/10.0
$140,000
🖨 Deal sheet (PDF) 📄 Offer letter ✓ Due diligence
Listing remarks MLS
Great opportunity to own a 2-bedroom home for living or investment property located on Clinton Avenue in Albany, NY. This property is currently rented, providing immediate cash flow, making it an excellent choice for investors, first-time landlords, or anyone looking to start or expand their real estate portfolio. The home features a functional layout with two bedrooms and solid bones. The basement offers additional potential and can be converted into a small studio or extra living space, adding future value and increased rental income (buyer to verify with local zoning). Conveniently located near public transportation, shops, schools, and major routes, this property offers both accessibility and long-term rental demand.
Key facts
- Basement potential
- Major routes
- Functional layout
Tags
Neighborhood map
What this means for you Summary
Snapshot
- This is a 2-bed/1.0-bath single-family listed at $140k.
Deal economics
- At list price, monthly cash flow is $338 ($4k/yr) — positive.
- The deal already cash-flows at list — no discount required.
- Meets the 1% rule at list price ($2k rent vs $140k).
- Recommended offer: $123k (12.0% below list) — sets the bar for market timing.
- Cap rate 9.2% vs local median 5.7% in Albany — top-decile yield for the area; either an underpriced asset or a hidden risk that comps aren't pricing in. Stress-test before assuming the spread holds.
Location & tenants
- Location reads 79/100 on livability (#129 in NY, #2,083 nationally) — a middle-class / working-renter tenant base. Strengths: amenities A+, commute A+, housing A+; Watch: employment C-, crime F.
- Albany City School District (urban): math 37% / reading 40% proficiency, ranked #543 of 590 in NY (top 92%) — families likely to look elsewhere, expect single-tenant / working-renter base with shorter leases; 66% free/reduced lunch — lower-income household profile, screen leases tightly.
- Market conditions: Rents rising fast (+5.4%/yr); 89 active listings in the ZIP; 40 comparable units currently listed for rent nearby; rentals at typical pace (median 25d on market — plan ~3-4 weeks tenant-placement turnaround); 45% of comp listings sitting > 30 days — soft ceiling on asking rent; lower-income renter base — watch delinquency; 675 units permitted in Albany County in 2024 (451 in 5+ unit buildings).
- At $1,631/mo this rent would consume 47% of the median local household income ($42k/yr) (locally 2035% of renters already pay >50% of income on rent) — very limited rent-growth headroom before tenants either downsize or default.
Forward outlook
- Local home prices are declining (-3.0%/yr); year-one equity from $968 of loan paydown is wiped out by about $4k of value loss. Plan a longer hold.
- Albany County population projected at +9% by 2050 — modest demand growth; plan on rents tracking national, not racing it.
- At projected returns (-3.0% appreciation + 5.4% rent growth), your $39k cash investment doubles in ~9 years — after that, you're playing with house money.
Negotiation context
- It's been on market 159 days — a 12% lower offer ($123k) is reasonable based on typical stale-listing flexibility.
- 3 sale attempts since 25y ago; this cycle's ask has dropped $15k (10%) from the opening price — seller is motivated, your offer sets the floor, not the list.
- Current owner paid $8k; list at $140k implies a 1547% gain — meaningful room to come down on a strong offer.
Risks & watch-outs
- Watch-outs: built in 1890 — expect roof / HVAC / electrical / plumbing capex.
Questions for the listing agent
- It's been on market 159 days. Have you received any prior offers? Is the seller open to a 12% concession, seller financing, or rate buy-down credit?
- Built in 1890 — when were the roof, HVAC, electrical panel, plumbing, and water heater last replaced?
- Why hasn't it sold? Are there any deal-killer items the seller is aware of (foundation, flood, title, zoning, code violations)?
- Is there a deadline driving the sale (1031 exchange, divorce, estate, relocation)? That informs how much negotiation room exists.
- Crime grade is F in this area — have there been break-ins, vandalism, or insurance claims at this property in the last 3 years? What carrier currently insures it and at what premium?
- What's the average days-on-market for RENTAL listings here right now (not sales)? A rising rental-DOM trend means longer vacancies and softer asking-rent achievability than the comps imply.
- What's the recent tenant-quality profile in this submarket — average credit score on applications, eviction rate, late-payment / NSF rate, and stable-employment percentage? A property-management company in the area should have these aggregated.
- How much new for-sale + rental construction is in the pipeline within 1–3 miles? Heavy new supply typically softens prices + rents 12–24 months out; constrained supply supports both.
Investment metrics
- 1% rule
- 1.16% ✓
- Cap rate
- 9.19%
- Cash-on-cash
- 10.35%
- DSCR
- 1.46
- GRM
- 7.2
CMA / ARV
- ARV (median comp)
- $135,326
- List price
- $140,000
- Delta
- 3.45%
- Verdict
- FAIR
- Comps
- 20 within 1.0 mi
Show comp detail 8 sales within ~0.75 mi
| Address | Dist | Beds/Ba | Sqft | Sold | Price | $/sf | Match |
|---|---|---|---|---|---|---|---|
| 152 Ontario St | 0.19mi | 3/1.0 (+1) | 935 (-1%) | 8mo | $125,350 | $134 | 78 |
| 89 Benson St | 0.29mi | 2/1.0 | 897 (-5%) | 1mo | $194,000 | $216 | 77 |
| 317 Sherman St | 0.11mi | 2/1.0 | 1,050 (+11%) | 4mo | $65,000 | $62 | 73 |
| 423 3rd St | 0.26mi | 3/1.5 (+1) | 930 (-2%) | 11mo | $60,000 | $65 | 69 |
| 252 Yates St | 0.73mi | 2/1.5 | 980 (+4%) | 1mo | $150,000 | $153 | 57 |
| 368 Elk St | 0.34mi | 3/1.0 (+1) | 1,040 (+10%) | 17mo | $77,000 | $74 | 49 |
| 9 Robin St | 0.39mi | 3/1.5 (+1) | 1,056 (+12%) | 16mo | $114,450 | $108 | 42 |
| 127 Sherman St | 0.54mi | 3/1.0 (+1) | 1,064 (+12%) | 16mo | $48,000 | $45 | 35 |
Match score weights: distance 35% · size 25% · config 20% · recency 20%. Top-matched comps best support the ARV.
Projected returns pro-forma
-3.0% appreciation · 5.37% rent growth · sell at horizon
- IRR
- 1.8%
- Equity multiple
- 1.07×
- Total profit
- $2,841
- Equity at exit
- $20,874
- IRR
- 13.6%
- Equity multiple
- 2.21×
- Total profit
- $47,403
- Equity at exit
- $12,105
Cash invested: $39,200 (down + closing). Projections, not guarantees.
Landlord ↔ Tenant lean methodology
- Overall (STATE)
- 15 Strongly Tenant-Friendly
- State New York
- 15 Strongly Tenant-Friendly · D+10
- County
- — inherits STATE
- City
- — inherits STATE
ZIP-level market 12206
- Home prices YoY
- -9.9%
- Rents YoY
- 5.4%
- Active inventory
- 89
- Price-to-rent
- 7.2×
Monthly cashflow live
- Estimated rent
- $1,631 high interval (Pro) →
- Mortgage (P&I)
- −$734
- Tax from tax record
- −$158 /mo · $1,890/yr
- Insurance
- −$58
- HOA
- −$0
- Vacancy / Maint / Mgmt
- −$342
- Net cashflow
- $338
Break-even live
Sensitivity live
| Price | -10% $417 | -5% $378 | +0% $338 | +5% $298 | +10% $259 |
|---|---|---|---|---|---|
| Rent | -10% $209 | -5% $274 | +0% $338 | +5% $403 | +10% $467 |
| Rate | -1.0pp $409 | -0.5pp $374 | base $338 | +0.5pp $302 | +1.0pp $265 |
UW: 25.0% down · 7.5% · 30yr · 1.5% tax · 5.0% vac · 8.0% maint · 8.0% mgmt
Financing live
Cash to close
- Down payment
- $35,000
- Closing costs
- $4,200
- Reserves months
- —
- Total cash needed
- —
Loan-product check · same deal, 3 products live
Conventional
25% down · 7.5% · 30yr
- Down + closing
- —
- Monthly P&I
- —
- Monthly cashflow
- —
- DSCR
- —
- Eligible?
- —
Personal DTI + credit; lowest rate.
DSCR
20% down · 8.5% · 30yr
- Down + closing
- —
- Monthly P&I
- —
- Monthly cashflow
- —
- DSCR
- —
- Eligible?
- —
No personal income docs; deal must DSCR.
Hard money
10% down · 12.0% · 12mo
- Down + closing
- —
- Monthly P&I
- —
- Monthly cashflow
- —
- DSCR
- —
- Eligible?
- —
Short-term bridge; refi at stabilization.
Rent comps 40 comps
| Address | Beds | Baths | Sqft | Rent | $/sqft | DOM | Units | Dist |
|---|---|---|---|---|---|---|---|---|
| 400 Central Ave Albany, NY | 2.0 | 1.0 | 675 | $1,591 | $2.36 | 45d | 11 | 0.18mi |
| 260 Bradford St Unit 205 Albany, NY | 3.0 | 2.0 | 912 | $1,700 | $1.86 | 25d | 1 | 0.18mi |
| 260 Bradford St Unit 105 Albany, NY | 2.0 | 1.0 | 745 | $1,500 | $2.01 | 25d | 1 | 0.18mi |
| 260 Bradford St Unit 102 Albany, NY | 1.0 | 1.0 | 571 | $1,300 | $2.28 | 25d | 1 | 0.18mi |
| 530 3rd St Apt 2 Albany, NY | 2.0 | 1.0 | 900 | $1,400 | $1.56 | 45d | 1 | 0.26mi |
| 460 Washington Ave Albany, NY | 2.0 | 1.0 | 950 | $1,650 | $1.74 | 25d | 1 | 0.32mi |
| 469 Livingston Ave Albany, NY | 1.0–3.0 | 1.0 | 685 | $1,452 | $2.12 | 15d | 1 | 0.36mi |
| 184 Quail St Albany, NY | 3.0 | 1.0 | 618 | $1,600 | $2.59 | 45d | 1 | 0.38mi |
| 526 Central Ave Albany, NY | 1.0–2.0 | 1.0 | 957 | $1,435 | $1.50 | 45d | 1 | 0.40mi |
| 223 Western Ave #1 Albany, NY | 3.0 | 1.0 | 1100 | $1,750 | $1.59 | 25d | 1 | 0.40mi |
| 180 Western Ave Unit 1st Floor Albany, NY | 2.0 | 1.0 | 900 | $1,550 | $1.72 | 45d | 1 | 0.43mi |
| 180 Western Ave Unit 2nd Floor Albany, NY | 2.0 | 1.0 | 1000 | $1,575 | $1.57 | 45d | 1 | 0.43mi |
| 273 Western Ave Unit 3 Albany, NY | 3.0 | 1.0 | 1100 | $1,850 | $1.68 | 25d | 1 | 0.43mi |
| 273 Western Ave Unit 2 Albany, NY | 3.0 | 1.0 | 1000 | $1,800 | $1.80 | 25d | 1 | 0.43mi |
| 152 Western Ave Unit 3R Albany, NY | 1.0 | 1.0 | 675 | $1,195 | $1.77 | 15d | 1 | 0.44mi |
| 316 2nd St Albany, NY | 3.0 | 1.0 | 850 | $1,700 | $2.00 | 45d | 1 | 0.47mi |
| 39 S Lake Ave Unit 1 Albany, NY | 1.0 | 1.0 | 900 | $1,600 | $1.78 | 45d | 1 | 0.49mi |
| 336 Washington Ave Unit 1 Albany, NY | 1.0 | 1.0 | 750 | $1,495 | $1.99 | 45d | 1 | 0.55mi |
| 489 Hamilton St Unit 1 Albany, NY | 3.0 | 1.0 | 1100 | $1,800 | $1.64 | 15d | 1 | 0.55mi |
| 1 Bleecker Ter Albany, NY | 1.0–2.0 | 1.0 | 609 | $1,499 | $2.46 | 15d | 1 | 0.58mi |
| 800 Madison Ave Albany, NY | 1.0–2.0 | 1.0 | 800 | $1,650 | $2.06 | 15d | 2 | 0.65mi |
| 336 Clinton Ave Albany, NY | 2.0 | 1.0 | 900 | $1,700 | $1.89 | 45d | 1 | 0.68mi |
| 504 Morris St Albany, NY | 2.0 | 1.0 | 720 | $1,395 | $1.94 | 25d | 1 | 0.75mi |
| 504 Morris St Albany, NY | 2.0 | 1.0 | 720 | $1,450 | $2.01 | 45d | 1 | 0.75mi |
| 110 Lark St Unit STREET-1 Albany, NY | 2.0 | 1.0 | 975 | $1,150 | $1.18 | 15d | 1 | 0.83mi |
| 110 Lark St Unit STREET-1 Albany, NY | 2.0 | 1.0 | 975 | $1,150 | $1.18 | 22d | 1 | 0.83mi |
| 614 Park Ave Albany, NY | 3.0 | 1.0 | 1118 | $2,500 | $2.24 | 45d | 1 | 0.85mi |
| 11 King Ave Unit 2 Albany, NY | 3.0 | 1.0 | 1100 | $1,600 | $1.45 | 15d | 1 | 0.85mi |
| 65 Lark St Albany, NY | 1.0 | 1.0 | 900 | $1,200 | $1.33 | 45d | 1 | 0.86mi |
| 254 Sheridan Ave Unit 2 Albany, NY | 3.0 | 1.0 | 900 | $1,300 | $1.44 | 25d | 1 | 0.86mi |
| 199 Lark St Albany, NY | 3.0 | 1.0 | 1000 | $1,800 | $1.80 | 45d | 1 | 0.87mi |
| 363 Ontario St Albany, NY | 1.0–2.0 | 1.0–2.5 | 1610 | $3,485 | $2.16 | 15d | 1 | 0.89mi |
| 521 Warren St Albany, NY | 2.0 | 1.0 | 850 | $2,300 | $2.71 | 15d | 1 | 0.89mi |
| 520 Madison Ave Unit 1 Albany, NY | 3.0 | 1.0 | 1080 | $1,700 | $1.57 | 45d | 1 | 0.90mi |
| 86 Dana Ave Albany, NY | 1.0 | 1.0 | 731 | $1,750 | $2.39 | 15d | 4 | 0.92mi |
| 155 Chestnut St Albany, NY | 2.0 | 1.0 | 850 | $2,000 | $2.35 | 15d | 1 | 0.94mi |
| 326 State St Albany, NY | 1.0 | 1.0 | 1000 | $1,600 | $1.60 | 45d | 1 | 0.95mi |
| 88 Willett St Albany, NY | 3.0 | 1.0 | 825 | $1,802 | $2.18 | 15d | 10 | 0.96mi |
| 484 Madison Ave Albany, NY | 1.0 | 1.0 | 800 | $1,850 | $2.31 | 45d | 1 | 0.96mi |
| 170 Washington Ave Albany, NY | 1.0 | 1.0 | 600 | $1,700 | $2.83 | 45d | 1 | 0.96mi |
Listing history 24 events
-
2026-06-21days on market $140,000 Active 159 DOM
-
2026-06-18days on market $140,000 Active 156 DOM
-
2026-06-17days on market $140,000 Active 155 DOM
-
2026-06-16days on market $140,000 Active 154 DOM
-
2026-06-15days on market $140,000 Active 153 DOM
-
2026-06-14days on market $140,000 Active 151 DOM
-
2026-06-10days on market $140,000 Active 148 DOM
-
2026-06-08days on market $140,000 Active 146 DOM
-
2026-06-07days on market $140,000 Active 145 DOM
-
2026-06-03days on market $140,000 Active 141 DOM
-
2026-06-02days on market $140,000 Active 140 DOM
-
2026-06-01days on market $140,000 Active 139 DOM
-
2026-05-31days on market $140,000 Active 138 DOM
-
2026-05-31days on market $140,000 Active 137 DOM
-
2026-04-30price $140,000 736-char remark
Show marketing remark (736 chars)
Great opportunity to own a 2-bedroom home for living or investment property located on Clinton Avenue in Albany, NY. This property is currently rented, providing immediate cash flow, making it an excellent choice for investors, first-time landlords, or anyone looking to start or expand their real estate portfolio. The home features a functional layout with two bedrooms and solid bones. The basement offers additional potential and can be converted into a small studio or extra living space, adding future value and increased rental income (buyer to verify with local zoning). Conveniently located near public transportation, shops, schools, and major routes, this property offers both accessibility and long-term rental demand.
-
2026-01-13$155,000 Active 736-char remark
Show marketing remark (736 chars)
Great opportunity to own a 2-bedroom home for living or investment property located on Clinton Avenue in Albany, NY. This property is currently rented, providing immediate cash flow, making it an excellent choice for investors, first-time landlords, or anyone looking to start or expand their real estate portfolio. The home features a functional layout with two bedrooms and solid bones. The basement offers additional potential and can be converted into a small studio or extra living space, adding future value and increased rental income (buyer to verify with local zoning). Conveniently located near public transportation, shops, schools, and major routes, this property offers both accessibility and long-term rental demand.
-
2016-09-21soldstatus $8,500 Closed (Final Sale) 81-char remark
Show marketing remark (81 chars)
Charming bungalow w/great potential on the Main drag, needs rehab. Fair Condition
-
2016-08-21status Pend (Under Cntr) 81-char remark
Show marketing remark (81 chars)
Charming bungalow w/great potential on the Main drag, needs rehab. Fair Condition
-
2016-08-05$12,500 New 81-char remark
Show marketing remark (81 chars)
Charming bungalow w/great potential on the Main drag, needs rehab. Fair Condition
-
2001-12-19soldstatus $5,020
-
2001-11-06historical
-
2001-02-15$6,000
-
2001-02-02soldstatus $28,000
-
2000-09-19soldstatus $28,000
ⓘ Source: listings_history table (triggers on properties + properties_extension) + one-shot
backfill from property_details.listing_events for pre-trigger history.
Tax reassessment forecast NY · Partial reset (capped growth)
- Current annual tax
- $1,890 · $158/mo
- Projected year-2 tax
- $2,128 · $177/mo
- Expected delta
- +$238/yr (+$20/mo · 12.6%)
ⓘ Screening estimate from a state-policy table — verify with the county assessor before closing.
Climate risk First Street
- Flood 1/10 Low FEMA zone X (unshaded) · 0% chance over 30 yrs
- Wildfire 1/10 Low
- Heat 4/10 Moderate 7 d/yr ≥97°F today · 16 d/yr by 30 yrs out
- Wind 3/10 Moderate 6% chance of damaging wind over 30 yrs
- Air quality 1/10 Low 0 unhealthy d/yr today · 0 by 30 yrs out
Nearby sold comps map
Loading sold comps map…
Walkable amenities ~0.75 mi
Loading nearby amenities…
Taxation est. · year 1
- Rental income
- $19,567
- − Mortgage interest
- −$7,842
- − Property taxes
- −$1,890
- − Insurance
- −$700
- − Repairs & maintenance
- −$1,565
- − Management
- −$1,565
- − Depreciation
- −$4,073
- Taxable income
- $1,931
- Est. tax owed @ 24.0%
- −$463
- After-tax cash flow
- $3,594/yr
For passive investors: Depreciation is non-cash, so a rental often shows a tax loss while cash-flowing — sheltering income. Rental losses are passive: they offset passive income freely, and up to $25,000/yr can offset ordinary (W-2) income if you actively participate and your MAGI is under $100k (phasing out to $0 by $150k); unused losses carry forward. On sale, claimed depreciation is recaptured at up to 25%, and gains may owe capital-gains tax (a 1031 exchange can defer both). Figures are a year-1 estimate at your 24.0% rate — not tax advice; consult a CPA.
Schools (NCES district)
- District
- Albany City School District
- NCES district ID
- 3602460
- Math proficiency
- 37% ▲ 6.00%
- Reading proficiency
- 40% ▲ 7.00%
- Median HH income
- $40,568
- Composite
- 32.34/100
- National rank
- #5744
- State rank
- #543 of 590 in NY
Livability — Albany
- Score
- 79/100
- State rank
- #129
- US rank
- #2083
Category grades
Schools grade is shown separately in the Schools card above.
Census & demographics
- Census place
- Albany, NY
- County
- Albany County · 196,626 people
- City population
- 116,921
- Metro
- Albany-Schenectady-Troy, NY
- Population (ZIP)
- 14,572
- Household income
- $41,548
- Rent vs Own
- Severe rent burden
- 2035.0
Population outlook (Albany County) Hauer SSP2
- Today (2025)
- 320,794 people
- By 2030
- 327,401 · +2.1%
- By 2040
- 338,218 · +5.4%
- By 2050
- 348,467 · +8.6%
- By 2075
- 381,693 · +19.0%
- By 2100
- 393,809 · +22.8%
Race, ethnicity, and origin ACS 2023
- Neighborhood character
- Highly diverse neighborhood (Simpson 0.75)
- Race & ethnicity
- Black 38% White 27% Hispanic / Latino 15% Two or more races 12% Asian 10%
- Hispanic origin (detail)
- Puerto Rican 10% Dominican 1%
- Common ancestry
- Italian 2% Lithuanian 2% Romanian 1%
- Foreign-born
- 22% · Canada, China
- Languages at home
- 75% English-only · Spanish 10% Other Indo-European 5% Chinese 3%
Political lean MEDSL · Albany
- 2024 margin
- Strong D (+25.8) · D 62.9% · R 37.1%
- 2008→2024 swing
- -3.6pp toward R · 2008: 29.4pp · 2024: 25.8pp
- All cycles
- 2024: D+25.8 2020: D+31.4 2016: D+24.3 2012: D+31.0 2008: D+29.4
Not yet ingested
- Civics
- —
Market trends
- HPI YoY
- ▼ -30.24%
- Current HPI
- 275.8109
- Rent YoY
- ▲ 5.37%
- Metro
- Albany-Schenectady-Troy, NY
- State GDP YoY
- ▲ 2.60%
- F500 in state
- 92
Industry mix (Fortune 500 HQ in NY)
| Industry | F500 HQs | Revenue |
|---|---|---|
| Financial Services | 10 | $950B |
|
||
| Consumer Goods | 9 | $162B |
|
||
| Insurance | 4 | $225B |
|
||
| Telecommunications | 2 | $144B |
|
||
| Pharmaceuticals | 2 | $112B |
|
||
| Media / Entertainment | 2 | $69B |
|
||
Price history
+400.0% since first listed10 events — show timeline
- 2026-04-30 Price Changed $140,000 Global MLS
- 2026-01-13 Listed $155,000 Global MLS
- 2016-09-21 Sold (MLS) $8,500 Global MLS
- 2016-08-21 Pending — Global MLS
- 2016-08-05 Listed $12,500 Global MLS
- 2001-12-19 Sold (MLS) $5,020 Global MLS
- 2001-11-06 Listing Removed — Global MLS
- 2001-02-15 Listed $6,000 Global MLS
- 2001-02-02 Sold (Public Records) $28,000 Public Records
- 2000-09-19 Sold (Public Records) $28,000 Public Records
Property tax history
+10.5%/yrLatest (2025): $1,890 · +11.4% YoY. Source: county tax records.
Cash-flow waterfall
monthlySold comps — $/sqft
last 12 mo · ≤1 miLoading sold comps…