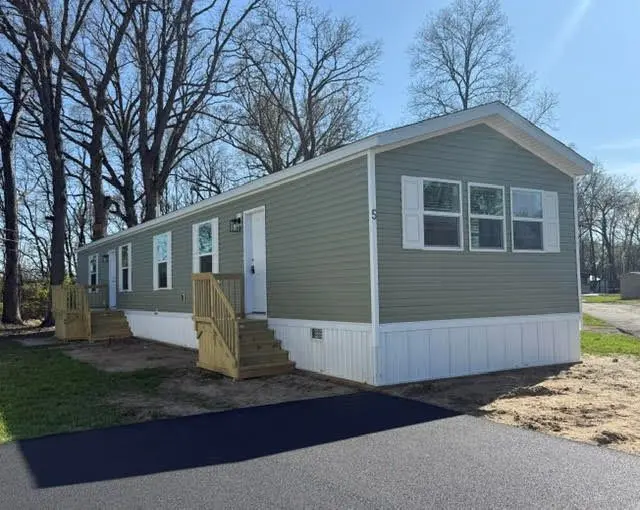
210 Rainbow Dr #5 · Burns Harbor, IN
Flood risk 6/10 · Moderate
- FEMA flood zone
- X (unshaded)
- Chance of flooding over 30 yrs
- 0.68%
- Est. flood insurance / yr
- $507 – $1,088
Fire risk 2/10 · Minimal
- Est. fire insurance / yr
- $717 – $1,331
Heat risk 2/10 · Minimal
- Hot days now (above 100°F)
- 7 days/yr
- Hot days in 30 yrs
- 15 days/yr
Wind risk 2/10 · Minimal
- Chance of severe wind over 30 yrs
- 0.0%
Air-quality risk 3/10 · Minor
- Unhealthy air days now
- 3 days/yr
- Unhealthy air days in 30 yrs
- 4 days/yr
Risk factors via First Street. Map © Google.
Why this score? — see what drove the B grade
The composite is a weighted blend of 9 inputs, each scored 0–100. Each bar is that input's sub-score; the figure is the points it added to the 100-point composite (weight × sub-score).
- Cash flow +30.0/30.0
- 1% rule +10.0/10.0
- DSCR +10.0/10.0
- ARV discount +7.5/15.0
- Schools +4.7/10.0
- Condition / age +4.0/5.0
- Livability +3.7/5.0
- Rent growth +2.5/5.0
- Appreciation +0.0/10.0
$69,000
🖨 Deal sheet 📄 Offer letter ✓ Due diligence
Listing remarks
Welcome to this beautifully designed 16' x 76' Clayton Harborview home, offering 3 spacious bedrooms and 2 full bathrooms with a bright, open-concept layout perfect for everyday living. This brand-new home features a thoughtfully designed floor plan with a large living area that flows seamlessly into the kitchen and dining space-ideal for entertaining or spending time with family. The kitchen comes equipped with modern cabinetry, ample counter space, and energy-efficient appliances, making both cooking and gathering effortless. The private primary suite includes a generous bedroom, walk-in closet, and a full ensuite bathroom, creating a comfortable retreat at the end of the day. Two additio
Key facts
- Large living area
- Modern cabinetry
- Walk-in closet
Tags
Property features AI
Finance
- Other: Living area approximately 1,216; Address: 210 Rainbow Dr #5, Burns Harbor, IN 46304
- Financial info: List price $76,000
Exterior
- Utilities: Natural gas heating; Central air conditioning
- Home design: 16x76 Clayton Harborview manufactured home (Spec); Single-story
- Construction: Manufactured home
- Exterior features: Asphalt roof
Interior
- Kitchen: Includes dishwasher and refrigerator
- Bedrooms: 3 bedrooms
- Bathrooms: 2 full bathrooms
- Heating & cooling: Natural gas forced air heating; Central air conditioning
- Interior features: Dishwasher; Refrigerator
Neighborhood map
What this means for you Summary
Snapshot
- This is a 3-bed/2.0-bath manufactured listed at $69k. Condition is rated good.
Deal economics
- At list price, monthly cash flow is $833 ($10k/yr) — positive.
- The deal already cash-flows at list — no discount required.
- Meets the 1% rule at list price ($2k rent vs $69k).
- Recommended offer: $67k (3.0% below list) — sets the bar for market timing.
Location & tenants
- Location reads 73/100 on livability (#94 in IN) — a middle-class / working-renter tenant base. Strengths: crime A+, employment A+, cost of living A+; Watch: schools D-, amenities F, commute F.
- Duneland School Corporation (suburban): math 53% / reading 53% proficiency, ranked #30 of 301 in IN (top 10%) — acceptable for families but not a draw, mixed tenant base, ~2y average lease.
- Market conditions: 222 active listings in the ZIP; solid renter incomes; 542 units permitted in Porter County in 2024 (0 in 5+ unit buildings).
Forward outlook
- Local home prices are declining (-3.0%/yr); year-one equity from $477 of loan paydown is wiped out by about $2k of value loss. Plan a longer hold.
- Porter County population projected at +6% by 2050 — modest demand growth; plan on rents tracking national, not racing it.
- At projected returns (-3.0% appreciation + 3.0% rent growth), your $19k cash investment doubles in ~3 years — after that, you're playing with house money.
Negotiation context
- It's been on market 51 days — a 3% lower offer ($67k) is reasonable based on typical stale-listing flexibility.
Risks & watch-outs
- Climate carrying-cost: major flood risk — expect insurance premiums to compound above CPI over the hold.
Questions for the listing agent
- It's been on market 51 days. Have you received any prior offers? Is the seller open to a 3% concession, seller financing, or rate buy-down credit?
- Is there a deadline driving the sale (1031 exchange, divorce, estate, relocation)? That informs how much negotiation room exists.
- Schools are D-rated, which usually means shorter tenancies and higher turnover. Who's the typical renter profile here, and what's been the actual vacancy rate?
- What's the average days-on-market for RENTAL listings here right now (not sales)? A rising rental-DOM trend means longer vacancies and softer asking-rent achievability than the comps imply.
- What's the recent tenant-quality profile in this submarket — average credit score on applications, eviction rate, late-payment / NSF rate, and stable-employment percentage? A property-management company in the area should have these aggregated.
- How much new for-sale + rental construction is in the pipeline within 1–3 miles? Heavy new supply typically softens prices + rents 12–24 months out; constrained supply supports both.
Investment metrics
- 1% rule
- 2.40% ✓
- Cap rate
- 20.79%
- Cash-on-cash
- 51.77%
- DSCR
- 3.30
- GRM
- 3.5
CMA / ARV
No comps found within radius.
Projected returns pro-forma
-3.0% appreciation · 3.0% rent growth · sell at horizon
- IRR
- 49.7%
- Equity multiple
- 3.17×
- Total profit
- $41,928
- Equity at exit
- $10,288
- IRR
- 55.2%
- Equity multiple
- 6.43×
- Total profit
- $104,966
- Equity at exit
- $5,966
Cash invested: $19,320 (down + closing). Projections, not guarantees.
Landlord ↔ Tenant lean methodology
- Overall (STATE)
- 90 Strongly Landlord-Friendly
- State Indiana
- 90 Strongly Landlord-Friendly · R+11
- County
- — inherits STATE
- City
- — inherits STATE
ZIP-level market 46304
- Active inventory
- 222
- Price-to-rent
- 3.5×
Monthly cashflow live
- Estimated rent
- $1,659 medium interval (Pro) →
- Mortgage (P&I)
- −$362
- Tax est. 1.5%
- −$86 /mo · $1,035/yr
- Insurance
- −$29
- HOA
- −$0
- Vacancy / Maint / Mgmt
- −$348
- Net cashflow
- $833
Break-even live
UW: 25.0% down · 7.5% · 30yr · 1.5% tax · 5.0% vac · 8.0% maint · 8.0% mgmt
Financing live
Cash to close
- Down payment
- $17,250
- Closing costs
- $2,070
- Reserves months
- —
- Total cash needed
- —
Loan-product check · same deal, 3 products live
Conventional
25% down · 7.5% · 30yr
- Down + closing
- —
- Monthly P&I
- —
- Monthly cashflow
- —
- DSCR
- —
- Eligible?
- —
Personal DTI + credit; lowest rate.
DSCR
20% down · 8.5% · 30yr
- Down + closing
- —
- Monthly P&I
- —
- Monthly cashflow
- —
- DSCR
- —
- Eligible?
- —
No personal income docs; deal must DSCR.
Hard money
10% down · 12.0% · 12mo
- Down + closing
- —
- Monthly P&I
- —
- Monthly cashflow
- —
- DSCR
- —
- Eligible?
- —
Short-term bridge; refi at stabilization.
Listing history 16 events
-
2026-06-18days on market $69,000 Active 51 DOM
-
2026-06-17days on market $69,000 Active 50 DOM
-
2026-06-16days on market $69,000 Active 49 DOM
-
2026-06-15days on market $69,000 Active 48 DOM
-
2026-06-13days on market $69,000 Active 46 DOM
-
2026-06-13days on market $69,000 Active 45 DOM
-
2026-06-09days on market $69,000 Active 42 DOM
-
2026-06-08days on market $69,000 Active 41 DOM
-
2026-06-07days on market $69,000 Active 40 DOM
-
2026-06-04days on market $69,000 Active 37 DOM
-
2026-06-03days on market $69,000 Active 36 DOM
-
2026-06-02days on market $69,000 Active 35 DOM
-
2026-06-01days on market $69,000 Active 34 DOM
-
2026-05-31days on market $69,000 Active 33 DOM
-
2026-05-01price $69,000 1256-char remark
-
2026-04-28$76,000 Active 1256-char remark
ⓘ Source: listings_history table (triggers on properties + properties_extension) + one-shot
backfill from property_details.listing_events for pre-trigger history.
Climate risk First Street
- Flood 6/10 Major FEMA zone X (unshaded) · 68% chance over 30 yrs
- Wildfire 2/10 Low
- Heat 2/10 Low 7 d/yr ≥100°F today · 15 d/yr by 30 yrs out
- Wind 2/10 Low 0% chance of damaging wind over 30 yrs
- Air quality 3/10 Moderate 3 unhealthy d/yr today · 4 by 30 yrs out
Nearby sold comps map
Loading sold comps map…
Walkable amenities ~0.75 mi
Loading nearby amenities…
Taxation est. · year 1
- Rental income
- $19,903
- − Mortgage interest
- −$3,865
- − Property taxes
- −$1,035
- − Insurance
- −$345
- − Repairs & maintenance
- −$1,592
- − Management
- −$1,592
- − Depreciation
- −$2,007
- Taxable income
- $9,467
- Est. tax owed @ 24.0%
- −$2,272
- After-tax cash flow
- $7,730/yr
For passive investors: Depreciation is non-cash, so a rental often shows a tax loss while cash-flowing — sheltering income. Rental losses are passive: they offset passive income freely, and up to $25,000/yr can offset ordinary (W-2) income if you actively participate and your MAGI is under $100k (phasing out to $0 by $150k); unused losses carry forward. On sale, claimed depreciation is recaptured at up to 25%, and gains may owe capital-gains tax (a 1031 exchange can defer both). Figures are a year-1 estimate at your 24.0% rate — not tax advice; consult a CPA.
Condition & rehab AI · 1 photo
This beautifully designed Clayton Harborview manufactured home is in excellent condition with no visible repairs needed. It offers a spacious floor plan, modern amenities, and a well-maintained exterior, making it an ideal move-in-ready property.
Value-add opportunities
- Both Landscaping improvements — Enhances curb appeal and adds value.
- Both Interior paint touch-ups — Fresh paint can make the home feel new and inviting.
- Both Add a smart home system — Improves convenience and adds modern features that appeal to buyers and renters.
Renovation cost estimate screening
Value-add ROI direction
- Both Landscaping improvements — Enhances curb appeal and adds value. ↑
- Both Interior paint touch-ups — Fresh paint can make the home feel new and inviting. ↑
- Both Add a smart home system — Improves convenience and adds modern features that appeal to buyers and renters. ↑
ⓘ Cost ranges are severity-bucket heuristics (US national rule-of-thumb). Get contractor quotes + a written scope before underwriting a rehab budget.
Schools (NCES district)
- District
- Duneland School Corporation
- NCES district ID
- 1802800
- Math proficiency
- 53% ▼ -4.00%
- Reading proficiency
- 53% ▼ -1.00%
- Median HH income
- $70,498
- Composite
- 47.24/100
- National rank
- #2310
- State rank
- #30 of 301 in IN
Livability — Burns Harbor
- Score
- 73/100
- State rank
- #94
- US rank
- #5352
Category grades
Schools grade is shown separately in the Schools card above.
Census & demographics
- Census place
- Burns Harbor, IN
- County
- Porter County · 151,647 people
- Metro
- Chicago-Naperville-Elgin, IL-IN-WI
- Population (ZIP)
- 28,307
- Household income
- $91,326
- Rent vs Own
- Severe rent burden
- 409.0
Population outlook (Porter County) Hauer SSP2
- Today (2025)
- 177,804 people
- By 2030
- 181,552 · +2.1%
- By 2040
- 185,830 · +4.5%
- By 2050
- 187,498 · +5.5%
- By 2075
- 189,585 · +6.6%
- By 2100
- 183,722 · +3.3%
Race, ethnicity, and origin ACS 2023
- Neighborhood character
- Predominantly White (84%)
- Race & ethnicity
- White 84% Hispanic / Latino 10% Two or more races 7% Black 2% Asian 2%
- Hispanic origin (detail)
- Mexican 7% Puerto Rican 2%
- Common ancestry
- Romanian 8% Italian 3% Iranian 2%
- Foreign-born
- 4% · Canada, China
- Languages at home
- 94% English-only · Spanish 3% Russian/Polish/Slavic 1% Other Asian/Pacific 1%
Political lean MEDSL · Porter
- 2024 margin
- R (+10.5) · D 43.8% · R 54.3% · Other 1.8%
- 2008→2024 swing
- -17.7pp toward R · 2008: 7.2pp · 2024: -10.5pp
- All cycles
- 2024: R+10.5 2020: R+6.1 2016: R+6.8 2012: D+3.8 2008: D+7.2
Not yet ingested
- Civics
- —
Market trends
- HPI YoY
- ▼ -150.59%
- Current HPI
- 178.7691
- Rent YoY
- —
- Metro
- Chicago-Naperville-Elgin, IL-IN-WI
- State GDP YoY
- ▲ 2.90%
- F500 in state
- 18
Industry mix (Fortune 500 HQ in IN)
| Industry | F500 HQs | Revenue |
|---|---|---|
| Industrial Machinery | 2 | $37B |
|
||
| Healthcare | 1 | $177B |
|
||
| Pharmaceuticals | 1 | $45B |
|
||
| Metals / Steel | 1 | $18B |
|
||
| Agriculture | 1 | $17B |
|
||
| Packaging | 1 | $12B |
|
||
Cash-flow waterfall
monthlySold comps — $/sqft
last 12 mo · ≤1 miLoading sold comps…