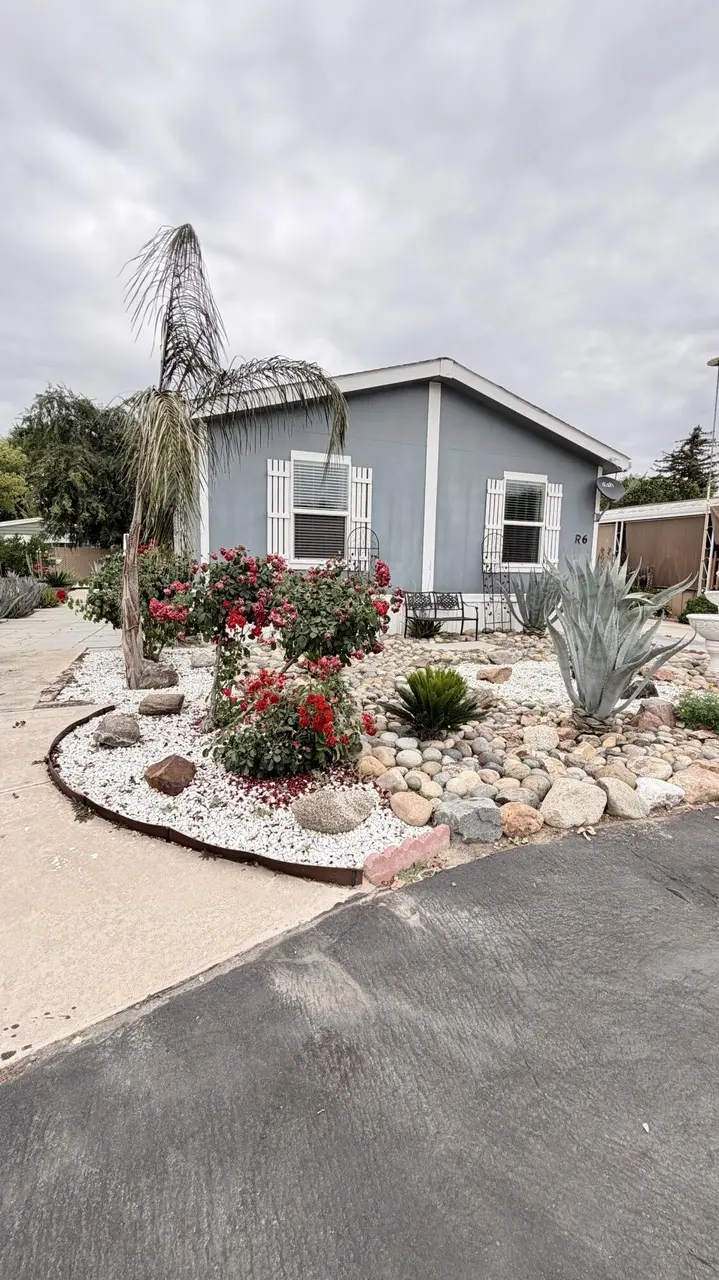
2400 W Midvalley Ave Unit R6 · Visalia, CA
Flood risk 4/10 · Minor
- FEMA flood zone
- X (shaded)
- Chance of flooding over 30 yrs
- 0.21%
- Est. flood insurance / yr
- $507 – $1,088
Fire risk 6/10 · Moderate
- Est. fire insurance / yr
- $659 – $1,223
Heat risk 8/10 · Major
- Hot days now (above 105°F)
- 7 days/yr
- Hot days in 30 yrs
- 17 days/yr
Wind risk 1/10 · Minimal
- Chance of severe wind over 30 yrs
- —
Air-quality risk 10/10 · Severe
- Unhealthy air days now
- 40 days/yr
- Unhealthy air days in 30 yrs
- 43 days/yr
Risk factors via First Street. Map © Google.
Why this score? — see what drove the B grade
The composite is a weighted blend of 9 inputs, each scored 0–100. Each bar is that input's sub-score; the figure is the points it added to the 100-point composite (weight × sub-score).
- Cash flow +30.0/30.0
- 1% rule +10.0/10.0
- DSCR +10.0/10.0
- ARV discount +7.5/15.0
- Condition / age +3.8/5.0
- Livability +3.6/5.0
- Rent growth +3.3/5.0
- Schools +3.0/10.0
- Appreciation +0.0/10.0
$89,000
🖨 Deal sheet 📄 Offer letter ✓ Due diligence
Listing remarks
Step into comfort and charm in this beautifully maintained 3 bedroom, 2 bathroom home nestled within a peaceful 55+ community. Offering approximately 940 sq ft of inviting living space on a spacious 4,000 sq ft lot, this home features vaulted ceilings that create an airy open feel throughout the main living areas. The thoughtfully designed floorplan flows seamlessly from the bright kitchen with ample cabinetry and stainless steel appliances into the cozy living and dining spaces perfect for relaxing or entertaining. The spacious primary suite includes an oversized vanity and generous bathroom layout, while the additional bedrooms provide flexibility for guests, hobbies, or office space. Out
Key facts
- Bright kitchen
- Oversized vanity
- Vaulted ceilings
Tags
Property features AI
Exterior
- Parking: Assigned parking; Driveway
- Utilities: Public water; Public sewer; Water connected; Sewer connected
- Home design: Manufactured in park (double wide); No common walls
- Construction: Stucco exterior; Composition roof; Concrete perimeter, pillar/post/pier foundation (raised)
- Exterior features: Private yard; Storage; Community and private pool
Interior
- Kitchen: Range / Gas range; Free-standing range; Microwave; Refrigerator; Ice maker
- Flooring: Laminate flooring; Wood flooring
- Bathrooms: 2 full bathrooms
- Heating & cooling: Central air conditioning; Ceiling fan(s); Forced air heating
- Interior features: Ceiling fans; Open floor plan; Stone counters
- Laundry & utility: Dedicated laundry room
Neighborhood map
What this means for you Summary
Snapshot
- This is a 3-bed/2.0-bath manufactured listed at $89k. Condition is rated good.
Deal economics
- At list price, monthly cash flow is $839 ($10k/yr) — positive.
- The deal already cash-flows at list — no discount required.
- Meets the 1% rule at list price ($2k rent vs $89k).
- Recommended offer: $88k (1.5% below list) — sets the bar for market timing.
- Cap rate 17.6% vs local median 3.3% in Visalia — top-decile yield for the area; either an underpriced asset or a hidden risk that comps aren't pricing in. Stress-test before assuming the spread holds.
Location & tenants
- Location reads 72/100 on livability (#196 in CA) — a middle-class / working-renter tenant base. Strengths: commute A+, housing A+, employment B; Watch: amenities D, crime D-, cost of living F.
- Tulare Joint Union High (suburban): math 18% / reading 52% proficiency, ranked #280 of 517 in CA (top 54%) — families likely to look elsewhere, expect single-tenant / working-renter base with shorter leases.
- Market conditions: Rents rising (+3.3%/yr); 233 active listings in the ZIP; 5 comparable units currently listed for rent nearby; rentals lingering (median 44d on market — plan ~5-8 weeks vacancy on turnover, expect pricing pressure); 100% of comp listings sitting > 30 days — soft ceiling on asking rent; solid renter incomes; 1,447 units permitted in Tulare County in 2024 (307 in 5+ unit buildings).
Forward outlook
- Local home prices are declining (-3.0%/yr); year-one equity from $615 of loan paydown is wiped out by about $3k of value loss. Plan a longer hold.
- Tulare County population projected at +10% by 2050 — modest demand growth; plan on rents tracking national, not racing it.
- At projected returns (-3.0% appreciation + 3.3% rent growth), your $25k cash investment doubles in ~3 years — after that, you're playing with house money.
Negotiation context
- It's been on market 24 days — a 2% lower offer ($88k) is reasonable based on typical stale-listing flexibility.
- 4 sale attempts since 8y ago with the ask held roughly flat each time — persistent listings suggest the price (not the market) is what's stuck; bring a comps-based counter.
- Current owner paid $45k; list at $89k implies a 98% gain — meaningful room to come down on a strong offer.
Risks & watch-outs
- Climate carrying-cost: major wildfire risk; extreme-heat days projected 7→17/yr by 2055 (HVAC capex compounding) — expect insurance premiums to compound above CPI over the hold.
Questions for the listing agent
- Built in 1971 — when were the roof, HVAC, electrical panel, plumbing, and water heater last replaced?
- Is there a deadline driving the sale (1031 exchange, divorce, estate, relocation)? That informs how much negotiation room exists.
- Crime grade is D in this area — have there been break-ins, vandalism, or insurance claims at this property in the last 3 years? What carrier currently insures it and at what premium?
- What's the average days-on-market for RENTAL listings here right now (not sales)? A rising rental-DOM trend means longer vacancies and softer asking-rent achievability than the comps imply.
- What's the recent tenant-quality profile in this submarket — average credit score on applications, eviction rate, late-payment / NSF rate, and stable-employment percentage? A property-management company in the area should have these aggregated.
- How much new for-sale + rental construction is in the pipeline within 1–3 miles? Heavy new supply typically softens prices + rents 12–24 months out; constrained supply supports both.
Investment metrics
- 1% rule
- 2.07% ✓
- Cap rate
- 17.60%
- Cash-on-cash
- 40.39%
- DSCR
- 2.80
- GRM
- 4.0
CMA / ARV
- ARV (on-the-fly)
- $49,820
- Comps found
- 5
Show comp detail 5 sales within ~0.75 mi
| Address | Dist | Beds/Ba | Sqft | Sold | Price | $/sf | Match |
|---|---|---|---|---|---|---|---|
| 4715 S Verde Vista St | 0.22mi | 2/2.0 (-1) | 1,044 (+11%) | 0mo | $299,000 | $286 | 66 |
| 2627 W Mid Valley Ave #46 | 0.30mi | 3/2.0 | 1,056 (+12%) | 2mo | $55,900 | $53 | 64 |
| 2400 W Midvalley Ave Unit L14 | 0.00mi | 2/2.0 (-1) | 800 (-15%) | 13mo | $35,000 | $44 | 59 |
| 26814 S Mooney Blvd Unit B52 | 0.42mi | 2/2.0 (-1) | 900 (-4%) | 14mo | $39,500 | $44 | 57 |
| 2627 W Midvalley Ave #34 | 0.23mi | 2/1.0 (-1) | 800 (-15%) | 24mo | $47,000 | $59 | 36 |
Match score weights: distance 35% · size 25% · config 20% · recency 20%. Top-matched comps best support the ARV.
Projected returns pro-forma
-3.0% appreciation · 3.32% rent growth · sell at horizon
- IRR
- 37.2%
- Equity multiple
- 2.59×
- Total profit
- $39,617
- Equity at exit
- $13,270
- IRR
- 43.9%
- Equity multiple
- 5.25×
- Total profit
- $105,848
- Equity at exit
- $7,695
Cash invested: $24,920 (down + closing). Projections, not guarantees.
Landlord ↔ Tenant lean methodology
- Overall (STATE)
- 18 Strongly Tenant-Friendly
- State California
- 18 Strongly Tenant-Friendly · D+13
- County
- — inherits STATE
- City
- — inherits STATE
ZIP-level market 93277
- Rents YoY
- 3.3%
- Active inventory
- 233
- Price-to-rent
- 4.0×
Monthly cashflow live
- Estimated rent
- $1,840 high interval (Pro) →
- Mortgage (P&I)
- −$467
- Tax est. 1.5%
- −$111 /mo · $1,335/yr
- Insurance
- −$37
- HOA
- −$0
- Vacancy / Maint / Mgmt
- −$386
- Net cashflow
- $839
Break-even live
UW: 25.0% down · 7.5% · 30yr · 1.5% tax · 5.0% vac · 8.0% maint · 8.0% mgmt
Financing live
Cash to close
- Down payment
- $22,250
- Closing costs
- $2,670
- Reserves months
- —
- Total cash needed
- —
Loan-product check · same deal, 3 products live
Conventional
25% down · 7.5% · 30yr
- Down + closing
- —
- Monthly P&I
- —
- Monthly cashflow
- —
- DSCR
- —
- Eligible?
- —
Personal DTI + credit; lowest rate.
DSCR
20% down · 8.5% · 30yr
- Down + closing
- —
- Monthly P&I
- —
- Monthly cashflow
- —
- DSCR
- —
- Eligible?
- —
No personal income docs; deal must DSCR.
Hard money
10% down · 12.0% · 12mo
- Down + closing
- —
- Monthly P&I
- —
- Monthly cashflow
- —
- DSCR
- —
- Eligible?
- —
Short-term bridge; refi at stabilization.
Rent comps 5 comps
| Address | Beds | Baths | Sqft | Rent | $/sqft | DOM | Units | Dist |
|---|---|---|---|---|---|---|---|---|
| 3940 S Shady Ct Unit 123 Visalia, CA | 2.0 | 1.0 | 910 | $1,695 | $1.86 | 43d | 1 | 0.38mi |
| 3940 S Shady Ct Apt 107 Visalia, CA | 2.0 | 2.0 | 950 | $1,695 | $1.78 | 43d | 1 | 0.38mi |
| 3940 S Shady Ct Apt 223 Visalia, CA | 2.0 | 2.0 | 910 | $1,950 | $2.14 | 43d | 1 | 0.39mi |
| 2401 W Sunnyside Ave Unit 2403 Visalia, CA | 2.0 | 2.0 | 768 | $1,600 | $2.08 | 43d | 1 | 0.91mi |
| 1917 W Whitendale Ave Unit 1917 Visalia, CA | 2.0 | 2.0 | 1048 | $1,295 | $1.24 | 43d | 1 | 1.11mi |
Listing history 18 events
-
2026-06-01days on market $89,000 Active 24 DOM
-
2026-05-31days on market $89,000 Active 23 DOM
-
2026-05-30days on market $89,000 Active 22 DOM
-
2026-05-08$89,000 Active
-
2025-10-29price $99,900
-
2025-10-29price $99,900
-
2025-10-17price $109,900
-
2025-10-17price $109,900
-
2025-05-22price $114,900
-
2025-05-22price $114,900
-
2025-04-21price $119,900
-
2025-04-21price $119,900
-
2025-03-24price $124,900
-
2025-03-24price $124,900
-
2024-11-26$129,900 Active
-
2024-11-25$129,900 Active
-
2018-04-25soldstatus $45,000
-
2018-01-05$49,500
ⓘ Source: listings_history table (triggers on properties + properties_extension) + one-shot
backfill from property_details.listing_events for pre-trigger history.
Climate risk First Street
- Flood 4/10 Moderate FEMA zone X (shaded) · 21% chance over 30 yrs
- Wildfire 6/10 Major
- Heat 8/10 Severe 7 d/yr ≥105°F today · 17 d/yr by 30 yrs out
- Wind 1/10 Low
- Air quality 10/10 Extreme 40 unhealthy d/yr today · 43 by 30 yrs out
Nearby sold comps map
Loading sold comps map…
Walkable amenities ~0.75 mi
Loading nearby amenities…
Taxation est. · year 1
- Rental income
- $22,082
- − Mortgage interest
- −$4,985
- − Property taxes
- −$1,335
- − Insurance
- −$445
- − Repairs & maintenance
- −$1,767
- − Management
- −$1,767
- − Depreciation
- −$2,589
- Taxable income
- $9,195
- Est. tax owed @ 24.0%
- −$2,207
- After-tax cash flow
- $7,858/yr
For passive investors: Depreciation is non-cash, so a rental often shows a tax loss while cash-flowing — sheltering income. Rental losses are passive: they offset passive income freely, and up to $25,000/yr can offset ordinary (W-2) income if you actively participate and your MAGI is under $100k (phasing out to $0 by $150k); unused losses carry forward. On sale, claimed depreciation is recaptured at up to 25%, and gains may owe capital-gains tax (a 1031 exchange can defer both). Figures are a year-1 estimate at your 24.0% rate — not tax advice; consult a CPA.
Condition & rehab AI · 9 photos
This 3-bedroom, 2-bathroom home in a 55+ community is in good condition with minimal repairs needed. It offers a good return on investment with updates that can significantly increase its value.
Value-add opportunities
- Both Paint exterior siding — Enhances curb appeal and value
- Both Replace ceiling fan — Improves air circulation and aesthetics
- Resale Update kitchen backsplash — Modernizes kitchen and adds value
- Rental Install smart home devices — Attracts tech-savvy renters
Renovation cost estimate screening
Value-add ROI direction
- Both Paint exterior siding — Enhances curb appeal and value ↑
- Both Replace ceiling fan — Improves air circulation and aesthetics ↑
- Resale Update kitchen backsplash — Modernizes kitchen and adds value ↑
- Rental Install smart home devices — Attracts tech-savvy renters ↑
ⓘ Cost ranges are severity-bucket heuristics (US national rule-of-thumb). Get contractor quotes + a written scope before underwriting a rehab budget.
Schools (NCES district)
- District
- Tulare Joint Union High
- NCES district ID
- 0639930
- Math proficiency
- 18% ▼ -6.00%
- Reading proficiency
- 52% ▼ -1.00%
- Median HH income
- $46,858
- Composite
- 29.91/100
- National rank
- #6384
- State rank
- #280 of 517 in CA
Livability — Visalia
- Score
- 72/100
- State rank
- #196
- US rank
- #6351
Category grades
Schools grade is shown separately in the Schools card above.
Census & demographics
- Census place
- Visalia, CA
- County
- Tulare County · 323,826 people
- City population
- 163,333
- Metro
- Visalia, CA
- Population (ZIP)
- 53,985
- Household income
- $80,548
- Rent vs Own
- Severe rent burden
- 1896.0
Population outlook (Tulare County) Hauer SSP2
- Today (2025)
- 484,681 people
- By 2030
- 496,241 · +2.4%
- By 2040
- 518,507 · +7.0%
- By 2050
- 534,920 · +10.4%
- By 2075
- 548,417 · +13.2%
- By 2100
- 513,085 · +5.9%
Race, ethnicity, and origin ACS 2023
- Neighborhood character
- Diverse neighborhood (Simpson 0.60)
- Race & ethnicity
- Hispanic / Latino 48% White 40% Two or more races 21% Asian 4% Black 2% Native American 2%
- Hispanic origin (detail)
- Mexican 44%
- Common ancestry
- Russian 3% Iranian 2% Italian 2%
- Foreign-born
- 12% · Canada, China
- Languages at home
- 73% English-only · Spanish 22% Chinese 2% Other Asian/Pacific 1%
Political lean MEDSL · Tulare
- 2024 margin
- Strong R (+20.7) · D 38.5% · R 59.2% · Other 2.3%
- 2008→2024 swing
- -5.4pp toward R · 2008: -15.3pp · 2024: -20.7pp
- All cycles
- 2024: R+20.7 2020: R+7.8 2016: R+12.1 2012: R+17.8 2008: R+15.3
Not yet ingested
- Civics
- —
Market trends
- HPI YoY
- ▼ -371.43%
- Current HPI
- 310.349
- Rent YoY
- ▲ 3.32%
- Metro
- Visalia, CA
- State GDP YoY
- ▲ 3.21%
- F500 in state
- 116
Industry mix (Fortune 500 HQ in CA)
| Industry | F500 HQs | Revenue |
|---|---|---|
| Technology | 27 | $1,492B |
|
||
| Financial Services | 3 | $174B |
|
||
| Retail | 3 | $44B |
|
||
| Insurance | 3 | $26B |
|
||
| Media / Entertainment | 2 | $115B |
|
||
| Pharmaceuticals / Biotech | 2 | $62B |
|
||
Price history
+79.8% since first listed15 events — show timeline
- 2026-05-08 Listed $89,000 TCMLS
- 2025-10-29 Price Changed $99,900 FRESNOMLS
- 2025-10-29 Price Changed $99,900 TCMLS
- 2025-10-17 Price Changed $109,900 TCMLS
- 2025-10-17 Price Changed $109,900 FRESNOMLS
- 2025-05-22 Price Changed $114,900 TCMLS
- 2025-05-22 Price Changed $114,900 FRESNOMLS
- 2025-04-21 Price Changed $119,900 FRESNOMLS
- 2025-04-21 Price Changed $119,900 TCMLS
- 2025-03-24 Price Changed $124,900 TCMLS
- 2025-03-24 Price Changed $124,900 FRESNOMLS
- 2024-11-26 Listed $129,900 FRESNOMLS
- 2024-11-25 Listed $129,900 TCMLS
- 2018-04-25 Sold (MLS) $45,000 TCMLS
- 2018-01-05 Listed $49,500 TCMLS
Cash-flow waterfall
monthlySold comps — $/sqft
last 12 mo · ≤1 miLoading sold comps…