61-26 245th Pl Unit F-2 · New York, NY
Flood risk 1/10 · Minimal
- FEMA flood zone
- X (unshaded)
- Chance of flooding over 30 yrs
- 0.0%
- Est. flood insurance / yr
- $507 – $1,088
Fire risk 2/10 · Minimal
- Est. fire insurance / yr
- $691 – $1,283
Heat risk 6/10 · Moderate
- Hot days now (above 97°F)
- 7 days/yr
- Hot days in 30 yrs
- 14 days/yr
Wind risk 6/10 · Moderate
- Chance of severe wind over 30 yrs
- 27.0%
Air-quality risk 4/10 · Minor
- Unhealthy air days now
- 6 days/yr
- Unhealthy air days in 30 yrs
- 7 days/yr
Risk factors via First Street. Map © Google.
Why this score? — see what drove the D grade
The composite is a weighted blend of 9 inputs, each scored 0–100. Each bar is that input's sub-score; the figure is the points it added to the 100-point composite (weight × sub-score).
- Cash flow +14.4/30.0
- ARV discount +7.5/15.0
- Schools +5.0/10.0
- DSCR +4.4/10.0
- 1% rule +4.0/10.0
- Livability +3.8/5.0
- Rent growth +2.5/5.0
- Condition / age +2.5/5.0
- Appreciation +0.0/10.0
$339,900
🖨 Deal sheet (PDF) 📄 Offer letter ✓ Due diligence
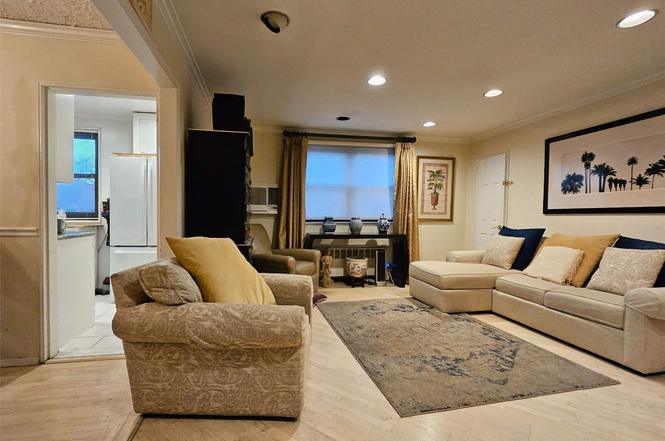
Listing remarks
Well-maintained and charming 2nd floor unit having spacious living room, fantastic dining room (originally a 3rd bedroom and can be easily converted back), and incredible walk-up attic storage space. The layout is open and the potential superb. Fantastic unit and location.
Key facts
- Built 1953
- Listed 46 days
Neighborhood map
What this means for you Summary
Snapshot
- This is a 2-bed/1.0-bath condo listed at $340k.
Deal economics
- At list price, monthly cash flow is $68 ($813/yr) — positive.
- The deal already cash-flows at list — no discount required.
- To meet the 1% rule (rent ≥ 1% of price), the offer needs to be $306k (10.0% below list).
- Recommended offer: $306k (10.0% below list) — sets the bar for 1% rule.
- Cap rate 6.5% vs local median 2.6% in New York — top-decile yield for the area; either an underpriced asset or a hidden risk that comps aren't pricing in. Stress-test before assuming the spread holds.
Location & tenants
- Location reads 75/100 on livability (#268 in NY, #4,188 nationally) — a middle-class / working-renter tenant base. Strengths: amenities A+, commute A+, health & safety A; Watch: crime F, cost of living F.
- Zoned schools: Elm Tree Elementary School (math 27% / reading 52%, grade F, #1,444 of 2,108 statewide, top 71%, 806 students, 94% FRL); Is 227 Louis Armstrong (math 52% / reading 69%, grade B+, #153 of 729 statewide, top 21%, 1,528 students, 68% FRL); Midwood High School (math 94% / reading 96%, grade A+, #83 of 1,100 statewide, top 8%, 4,062 students, 73% FRL).
- Market conditions: 162 active listings in the ZIP; 14 comparable units currently listed for rent nearby; rentals at typical pace (median 26d on market — plan ~3-4 weeks tenant-placement turnaround); high-income renter base; 5,302 units permitted in Queens County in 2024 (4,918 in 5+ unit buildings).
- This rent runs 30% of the median local income ($122k/yr) — at the standard rent-burdened threshold; future hikes will face affordability resistance.
Forward outlook
- Local home prices are declining (-3.0%/yr); year-one equity from $2k of loan paydown is wiped out by about $10k of value loss. Plan a longer hold.
- Queens County population projected at +16% by 2050 — long-run rental-demand tailwind backs the buy-and-hold thesis.
Negotiation context
- It's been on market 46 days — a 3% lower offer ($330k) is reasonable based on typical stale-listing flexibility.
Risks & watch-outs
- Watch-outs: built in 1953 — expect roof / HVAC / electrical / plumbing capex.
- Climate carrying-cost: major wind risk, 27% chance of damaging wind over 30y; extreme-heat days projected 7→14/yr by 2055 (HVAC capex compounding) — expect insurance premiums to compound above CPI over the hold.
Questions for the listing agent
- It's been on market 46 days. Have you received any prior offers? Is the seller open to a 10% concession, seller financing, or rate buy-down credit?
- Built in 1953 — when were the roof, HVAC, electrical panel, plumbing, and water heater last replaced?
- Any open or pending special assessments — roof, HVAC, plumbing, elevator, façade? What's the per-unit balance and payoff schedule, and is the seller paying it off at close or rolling it to the buyer?
- Is there a deadline driving the sale (1031 exchange, divorce, estate, relocation)? That informs how much negotiation room exists.
- Schools are B-rated — typically a magnet for longer-tenancy family renters. What's the average tenant stay here, and is there a school-zone premium baked into asking?
- Crime grade is F in this area — have there been break-ins, vandalism, or insurance claims at this property in the last 3 years? What carrier currently insures it and at what premium?
- The area grade is low — what's the realistic commute time and amenity access for the typical tenant pool here? Any planned neighborhood developments (good or bad) we should know about?
- What's the average days-on-market for RENTAL listings here right now (not sales)? A rising rental-DOM trend means longer vacancies and softer asking-rent achievability than the comps imply.
- What's the recent tenant-quality profile in this submarket — average credit score on applications, eviction rate, late-payment / NSF rate, and stable-employment percentage? A property-management company in the area should have these aggregated.
- How much new apartment / multifamily construction is in the pipeline within 1–3 miles? Heavy new supply (>2% of stock underway) typically softens rents 12–24 months out; light construction supports rent growth.
Investment metrics
- 1% rule
- 0.90% ✗
- Cap rate
- 6.53%
- Cash-on-cash
- 0.85%
- DSCR
- 1.04
- GRM
- 9.3
CMA / ARV
No comps found within radius.
Projected returns pro-forma
-3.0% appreciation · 3.0% rent growth · sell at horizon
- IRR
- -14.9%
- Equity multiple
- 0.47×
- Total profit
- $-50,715
- Equity at exit
- $50,680
- IRR
- -6.3%
- Equity multiple
- 0.60×
- Total profit
- $-38,416
- Equity at exit
- $29,388
Cash invested: $95,172 (down + closing). Projections, not guarantees.
Landlord ↔ Tenant lean methodology
- Overall (CITY)
- 0 Strongly Tenant-Friendly
- State New York
- 15 Strongly Tenant-Friendly · D+10
- County
- — inherits STATE
- City New York
- 0 Strongly Tenant-Friendly · D+34
ZIP-level market 11362
- Home prices YoY
- -31.1%
- Active inventory
- 162
- Price-to-rent
- 9.3×
Monthly cashflow live
- Estimated rent
- $3,059 high interval (Pro) →
- Mortgage (P&I)
- −$1,782
- Tax est. 1.5%
- −$425 /mo · $5,098/yr
- Insurance
- −$142
- HOA
- −$0
- Vacancy / Maint / Mgmt
- −$642
- Net cashflow
- $68
Break-even live
Sensitivity live
| Price | -10% $303 | -5% $185 | +0% $68 | +5% $-50 | +10% $-167 |
|---|---|---|---|---|---|
| Rent | -10% $-174 | -5% $-53 | +0% $68 | +5% $189 | +10% $309 |
| Rate | -1.0pp $239 | -0.5pp $154 | base $68 | +0.5pp $-20 | +1.0pp $-110 |
UW: 25.0% down · 7.5% · 30yr · 1.5% tax · 5.0% vac · 8.0% maint · 8.0% mgmt
Financing live
Cash to close
- Down payment
- $84,975
- Closing costs
- $10,197
- Reserves months
- —
- Total cash needed
- —
Loan-product check · same deal, 3 products live
Conventional
25% down · 7.5% · 30yr
- Down + closing
- —
- Monthly P&I
- —
- Monthly cashflow
- —
- DSCR
- —
- Eligible?
- —
Personal DTI + credit; lowest rate.
DSCR
20% down · 8.5% · 30yr
- Down + closing
- —
- Monthly P&I
- —
- Monthly cashflow
- —
- DSCR
- —
- Eligible?
- —
No personal income docs; deal must DSCR.
Hard money
10% down · 12.0% · 12mo
- Down + closing
- —
- Monthly P&I
- —
- Monthly cashflow
- —
- DSCR
- —
- Eligible?
- —
Short-term bridge; refi at stabilization.
Rent comps 14 comps
| Address | Beds | Baths | Sqft | Rent | $/sqft | DOM | Units | Dist |
|---|---|---|---|---|---|---|---|---|
| 245-63 61st Ave Unit 1FL Flushing, NY | 3.0 | 2.0 | 1000 | $3,000 | $3.00 | 26d | 1 | 0.11mi |
| 240-53 68th Ave Unit 1st Floor Douglaston, NY | 2.0 | 1.0 | 900 | $2,500 | $2.78 | 26d | 1 | 0.40mi |
| 253-15 60th Ave Unit 2nd Floor Flushing, NY | 3.0 | 2.0 | 1100 | $3,500 | $3.18 | 5d | 1 | 0.45mi |
| 232-15 67th Ave Unit 1FL Flushing, NY | 2.0 | 2.0 | 900 | $2,900 | $3.22 | 6d | 1 | 0.81mi |
| 4420 Douglaston Pkwy Unit 5A Little Neck, NY | 2.0 | 1.0 | 900 | $3,200 | $3.56 | 0d | 1 | 0.95mi |
| 245-24 77th Cres Jamaica, NY | 2.0 | 1.0 | 785 | $2,600 | $3.31 | 20d | 1 | 0.98mi |
| 4245 247th St Little Neck, NY | 3.0 | 1.0 | 1080 | $3,800 | $3.52 | 26d | 1 | 1.01mi |
| 76-37 Commonwealth Blvd Unit 2 Jamaica, NY | 1.0 | 1.0 | 641 | $2,200 | $3.43 | 26d | 1 | 1.02mi |
| 4212 Marathon Pkwy Little Neck, NY | 1.0 | 1.0 | 550 | $2,375 | $4.32 | 26d | 1 | 1.05mi |
| 246-17 Union Tpke Unit A Bellerose, NY | 3.0 | 1.0 | 799 | $3,200 | $4.01 | 26d | 1 | 1.08mi |
| 56-25 226th St Unit 3 Bayside, NY | 3.0 | 1.5 | 977 | $3,250 | $3.33 | 26d | 1 | 1.10mi |
| 4230 Douglaston Pkwy Little Neck, NY | 1.0 | 1.0 | 700 | $1,800 | $2.57 | 20d | 1 | 1.11mi |
| 6747 222nd St Oakland Gardens, NY | 3.0 | 1.0 | 924 | $2,700 | $2.92 | 4d | 1 | 1.33mi |
| 7608 269th St New Hyde Park, NY | 3.0 | 2.0 | 1031 | $4,500 | $4.36 | 0d | 1 | 1.37mi |
HOA detail condo
- Monthly dues
- $0 · $0/yr
- Assessments
- None detected in remarks — confirm with the listing agent.
Listing history 3 events
-
2025-02-24status Pending
-
2025-01-10$339,900 Active
-
2025-01-09historical $339,900
ⓘ Source: listings_history table (triggers on properties + properties_extension) + one-shot
backfill from property_details.listing_events for pre-trigger history.
Climate risk First Street
- Flood 1/10 Low FEMA zone X (unshaded) · 0% chance over 30 yrs
- Wildfire 2/10 Low
- Heat 6/10 Major 7 d/yr ≥97°F today · 14 d/yr by 30 yrs out
- Wind 6/10 Major 27% chance of damaging wind over 30 yrs
- Air quality 4/10 Moderate 6 unhealthy d/yr today · 7 by 30 yrs out
Nearby sold comps map
Loading sold comps map…
Walkable amenities ~0.75 mi
Loading nearby amenities…
Taxation est. · year 1
- Rental income
- $36,710
- − Mortgage interest
- −$19,040
- − Property taxes
- −$5,098
- − Insurance
- −$1,700
- − Repairs & maintenance
- −$2,937
- − Management
- −$2,937
- − Depreciation
- −$9,888
- Taxable loss
- −$4,889
- Est. tax savings @ 24.0%
- +$1,173
- After-tax cash flow
- $1,987/yr
For passive investors: Depreciation is non-cash, so a rental often shows a tax loss while cash-flowing — sheltering income. Rental losses are passive: they offset passive income freely, and up to $25,000/yr can offset ordinary (W-2) income if you actively participate and your MAGI is under $100k (phasing out to $0 by $150k); unused losses carry forward. On sale, claimed depreciation is recaptured at up to 25%, and gains may owe capital-gains tax (a 1031 exchange can defer both). Figures are a year-1 estimate at your 24.0% rate — not tax advice; consult a CPA.
Schools (NCES district)
No district data.
Livability — New York
- Score
- 75/100
- State rank
- #268
- US rank
- #4188
Category grades
Schools grade is shown separately in the Schools card above.
Census & demographics
- Census place
- New York, NY
- County
- Queens County · 1,914,869 people
- City population
- 7,731,280
- Metro
- New York-Newark-Jersey City, NY-NJ-PA
- Population (ZIP)
- 18,492
- Household income
- $122,090
- Rent vs Own
- Severe rent burden
- 250.0
Population outlook (Queens County) Hauer SSP2
- Today (2025)
- 2,546,320 people
- By 2030
- 2,643,059 · +3.8%
- By 2040
- 2,815,563 · +10.6%
- By 2050
- 2,944,423 · +15.6%
- By 2075
- 3,123,338 · +22.7%
- By 2100
- 3,098,688 · +21.7%
Race, ethnicity, and origin ACS 2023
- Neighborhood character
- Diverse neighborhood (Simpson 0.62)
- Race & ethnicity
- Asian 48% White 37% Hispanic / Latino 9% Two or more races 5% Black 3%
- Hispanic origin (detail)
- Puerto Rican 3% Dominican 1%
- Common ancestry
- Romanian 4% Hispanic 1% Scotch-Irish 1%
- Foreign-born
- 40% · China, South Korea, Canada
- Languages at home
- 47% English-only · Chinese 21% Korean 12% Other Indo-European 9%
Political lean MEDSL · Queens
- 2024 margin
- Strong D (+24.6) · D 62.3% · R 37.7%
- 2008→2024 swing
- -26.2pp toward R · 2008: 50.8pp · 2024: 24.6pp
- All cycles
- 2024: D+24.6 2020: D+45.2 2016: D+53.4 2012: D+58.5 2008: D+50.8
Not yet ingested
- Civics
- —
Market trends
- HPI YoY
- ▼ -117.12%
- Current HPI
- 259.773
- Rent YoY
- —
- Metro
- New York-Newark-Jersey City, NY-NJ-PA
- State GDP YoY
- ▲ 2.60%
- F500 in state
- 92
Industry mix (Fortune 500 HQ in NY)
| Industry | F500 HQs | Revenue |
|---|---|---|
| Financial Services | 10 | $950B |
|
||
| Consumer Goods | 9 | $162B |
|
||
| Insurance | 4 | $225B |
|
||
| Telecommunications | 2 | $144B |
|
||
| Pharmaceuticals | 2 | $112B |
|
||
| Media / Entertainment | 2 | $69B |
|
||
Price history
+0.0% since first listed3 events — show timeline
- 2025-02-24 Pending — OneKey® MLS as Distributed by MLS Grid
- 2025-01-10 Listed $339,900 OneKey® MLS as Distributed by MLS Grid
- 2025-01-09 Coming Soon $339,900 OneKey® MLS as Distributed by MLS Grid
Cash-flow waterfall
monthlySold comps — $/sqft
last 12 mo · ≤1 miLoading sold comps…