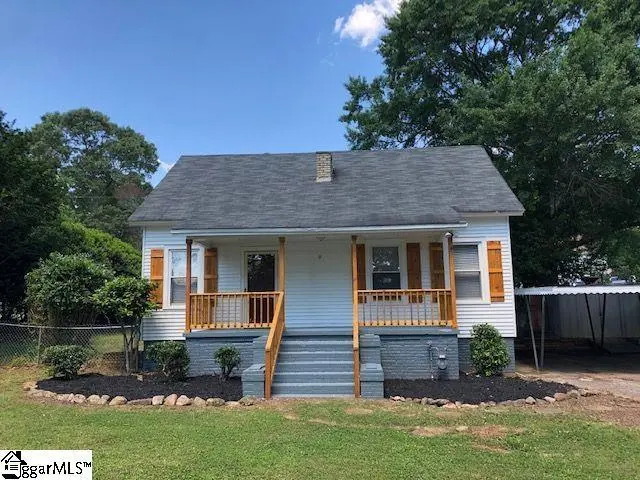
27 Wallace St · Dunean, SC
Flood risk 1/10 · Minimal
- FEMA flood zone
- X (unshaded)
- Chance of flooding over 30 yrs
- 0.0%
- Est. flood insurance / yr
- $507 – $1,088
Fire risk 1/10 · Minimal
- Est. fire insurance / yr
- $783 – $1,453
Heat risk 6/10 · Moderate
- Hot days now (above 102°F)
- 7 days/yr
- Hot days in 30 yrs
- 17 days/yr
Wind risk 2/10 · Minimal
- Chance of severe wind over 30 yrs
- 1.0%
Air-quality risk 4/10 · Minor
- Unhealthy air days now
- 4 days/yr
- Unhealthy air days in 30 yrs
- 4 days/yr
Risk factors via First Street. Map © Google.
Why this score? — see what drove the D grade
The composite is a weighted blend of 9 inputs, each scored 0–100. Each bar is that input's sub-score; the figure is the points it added to the 100-point composite (weight × sub-score).
- Cash flow +12.1/30.0
- ARV discount +10.7/15.0
- Schools +4.2/10.0
- Livability +4.0/5.0
- DSCR +3.6/10.0
- 1% rule +3.4/10.0
- Rent growth +3.4/5.0
- Condition / age +2.5/5.0
- Appreciation +0.0/10.0
$210,000
🖨 Deal sheet (PDF) 📄 Offer letter ✓ Due diligence
Listing remarks MLS
Yet another wonderful opportunity for Investor or First Time Home Buyers. The cute 2 bedroom 1 bathroom room home offers large rooms and several upgrades. Beautiful hardwoods through out. Large backyard for outdoor entertainment.
Key facts
- Fenced backyard
- 0.24 acre lot
- Garage
Tags
Property features AI
Finance
- HOA & community: No HOA fees
Exterior
- Parking: Detached carport (1-car); Driveway parking; Paved driveway
- Utilities: Public water; Public sewer; Electric power; Private garbage pickup
- Home design: Single-story residential home; Built in 1961; Crawl space foundation; Lead-based paint disclosure required; Residential property disclosure required
- Construction: Aluminum siding exterior; Composition shingle roof; Approximate year built: 1961
- Exterior features: Front porch; Corner lot; Fenced yard; Level lot; Sidewalk; Some trees; Outbuilding (storage)
Interior
- Kitchen: Dishwasher; Refrigerator; Electric cooktop; Electric freestanding range; Kitchen approx. 15 x 11
- Bedrooms: Two bedrooms on the main level; Primary bedroom on main level with full bath and tub/shower (approx. 15 x 13); Second bedroom approx. 13 x 11
- Flooring: Luxury vinyl tile/plank
- Bathrooms: One full bathroom on the main level
- Heating & cooling: Electric heating; Central forced cooling; Electric water heater
- Interior features: Cable available; 9-foot (and higher) ceilings; Ceiling fans; Blown (textured) ceilings; Smoke detector; Laminate countertops; One fireplace (not functional/none listed)
- Laundry & utility: Walk-in laundry
Neighborhood map
What this means for you Summary
Snapshot
- This is a 2-bed/1.0-bath single-family listed at $210k.
Deal economics
- At list price, monthly cash flow is $-47 ($-565/yr) — negative.
- To cash-flow at today's rent, offer at most $202k (4.0% below list).
- To meet the 1% rule (rent ≥ 1% of price), the offer needs to be $175k (16.5% below list).
- Recommended offer: $175k (16.5% below list) — sets the bar for 1% rule.
- Cap rate 6.0% vs local median 3.9% in Dunean — top-decile yield for the area; either an underpriced asset or a hidden risk that comps aren't pricing in. Stress-test before assuming the spread holds.
Location & tenants
- Location reads 79/100 on livability (#14 in SC, #2,248 nationally) — a middle-class / working-renter tenant base. Strengths: commute A+, cost of living A+, housing A+; Watch: amenities C-, employment F.
- Greenville 01 (suburban): math 44% / reading 54% proficiency, ranked #10 of 80 in SC (top 12%) — families likely to look elsewhere, expect single-tenant / working-renter base with shorter leases.
- Zoned schools: Thomas E. Kerns Elementary (math 34% / reading 28%, grade F, #385 of 597 statewide, top 65%, 504 students, 100% FRL) — zoned schools average 100% FRL vs 42% district-wide (58 pts higher); higher-poverty schools than district average — tighter screening recommended.
- Zoned-school proficiency averages 31% at this address vs 49% district-wide (-18 pts) — the specific schools serving this property underperform the Greenville 01 average; the district grade overstates school quality for this exact location.
- Market conditions: Rents rising (+3.7%/yr); 410 active listings in the ZIP; 20 comparable units currently listed for rent nearby; rentals at typical pace (median 25d on market — plan ~3-4 weeks tenant-placement turnaround); 5,595 units permitted in Greenville County in 2024 (566 in 5+ unit buildings).
- This rent runs 32% of the median local income ($66k/yr) — at the standard rent-burdened threshold; future hikes will face affordability resistance.
Forward outlook
- Local home prices are declining (-3.0%/yr); year-one equity from $1k of loan paydown is wiped out by about $6k of value loss. Plan a longer hold.
- Greenville County population projected at +34% by 2050 — long-run rental-demand tailwind backs the buy-and-hold thesis.
Negotiation context
- It's been on market 34 days — a 3% lower offer ($204k) is reasonable based on typical stale-listing flexibility.
- 4 sale attempts since 10y ago; this cycle's ask has dropped $15k (7%) from the opening price — seller is motivated, your offer sets the floor, not the list.
- Current owner paid $100k; list at $210k implies a 110% gain — meaningful room to come down on a strong offer.
Risks & watch-outs
- Climate carrying-cost: extreme-heat days projected 7→17/yr by 2055 (HVAC capex compounding) — expect insurance premiums to compound above CPI over the hold.
Questions for the listing agent
- What do current leases actually rent for vs. the listed asking? Can we see a recent rent roll and the last 12 months of T-12 income?
- It's been on market 34 days. Have you received any prior offers? Is the seller open to a 16% concession, seller financing, or rate buy-down credit?
- Built in 1961 — when were the roof, HVAC, electrical panel, plumbing, and water heater last replaced?
- Is there a deadline driving the sale (1031 exchange, divorce, estate, relocation)? That informs how much negotiation room exists.
- Schools are F-rated, which usually means shorter tenancies and higher turnover. Who's the typical renter profile here, and what's been the actual vacancy rate?
- The area grade is low — what's the realistic commute time and amenity access for the typical tenant pool here? Any planned neighborhood developments (good or bad) we should know about?
- What's the average days-on-market for RENTAL listings here right now (not sales)? A rising rental-DOM trend means longer vacancies and softer asking-rent achievability than the comps imply.
- What's the recent tenant-quality profile in this submarket — average credit score on applications, eviction rate, late-payment / NSF rate, and stable-employment percentage? A property-management company in the area should have these aggregated.
- How much new for-sale + rental construction is in the pipeline within 1–3 miles? Heavy new supply typically softens prices + rents 12–24 months out; constrained supply supports both.
Investment metrics
- 1% rule
- 0.84% ✗
- Cap rate
- 6.02%
- Cash-on-cash
- -0.96%
- DSCR
- 0.96
- GRM
- 10.0
CMA / ARV
- ARV (on-the-fly)
- $225,865
- Comps found
- 10
Show comp detail 10 sales within ~0.75 mi
| Address | Dist | Beds/Ba | Sqft | Sold | Price | $/sf | Match |
|---|---|---|---|---|---|---|---|
| 53 Smythe Ave | 0.34mi | 2/1.5 | 923 (-7%) | 9mo | $285,000 | $309 | 63 |
| 6 Goodrich St | 0.57mi | 2/1.0 | 1,055 (+6%) | 4mo | $101,000 | $96 | 60 |
| 106 E Wilburn Ave | 0.65mi | 2/1.0 | 1,000 (+0%) | 11mo | $225,000 | $225 | 60 |
| 16 Blake St | 0.13mi | 2/1.0 | 1,141 (+15%) | 13mo | $275,000 | $241 | 58 |
| 3 Cardwell St | 0.44mi | 2/1.0 | 938 (-6%) | 14mo | $207,500 | $221 | 58 |
| 12 Wrigley St | 0.53mi | 2/1.0 | 1,113 (+12%) | 7mo | $153,500 | $138 | 50 |
| 21 Webb St | 0.47mi | 2/1.0 | 1,109 (+12%) | 12mo | $195,000 | $176 | 49 |
| 65 Blake St | 0.32mi | 2/2.0 | 1,088 (+9%) | 21mo | $366,000 | $336 | 48 |
| 170 Otis St | 0.69mi | 2/1.0 | 1,100 (+11%) | 11mo | $250,000 | $227 | 41 |
| 323 Tremont Ave | 0.44mi | 2/2.0 | 1,138 (+14%) | 21mo | $272,800 | $240 | 34 |
Match score weights: distance 35% · size 25% · config 20% · recency 20%. Top-matched comps best support the ARV.
Projected returns pro-forma
-3.0% appreciation · 3.72% rent growth · sell at horizon
- IRR
- -17.1%
- Equity multiple
- 0.39×
- Total profit
- $-35,733
- Equity at exit
- $31,312
- IRR
- -7.7%
- Equity multiple
- 0.50×
- Total profit
- $-29,587
- Equity at exit
- $18,157
Cash invested: $58,800 (down + closing). Projections, not guarantees.
Landlord ↔ Tenant lean methodology
- Overall (STATE)
- 90 Strongly Landlord-Friendly
- State South Carolina
- 90 Strongly Landlord-Friendly · R+6
- County
- — inherits STATE
- City
- — inherits STATE
ZIP-level market 29605
- Rents YoY
- 3.7%
- Active inventory
- 410
- Price-to-rent
- 10.0×
Monthly cashflow live
- Estimated rent
- $1,754 high interval (Pro) →
- Mortgage (P&I)
- −$1,101
- Tax from tax record
- −$244 /mo · $2,928/yr
- Insurance
- −$88
- HOA
- −$0
- Vacancy / Maint / Mgmt
- −$368
- Net cashflow
- $-47
Break-even live
Sensitivity live
| Price | -10% $72 | -5% $12 | +0% $-47 | +5% $-107 | +10% $-166 |
|---|---|---|---|---|---|
| Rent | -10% $-186 | -5% $-116 | +0% $-47 | +5% $22 | +10% $91 |
| Rate | -1.0pp $59 | -0.5pp $6 | base $-47 | +0.5pp $-102 | +1.0pp $-157 |
UW: 25.0% down · 7.5% · 30yr · 1.5% tax · 5.0% vac · 8.0% maint · 8.0% mgmt
Financing live
Cash to close
- Down payment
- $52,500
- Closing costs
- $6,300
- Reserves months
- —
- Total cash needed
- —
Loan-product check · same deal, 3 products live
Conventional
25% down · 7.5% · 30yr
- Down + closing
- —
- Monthly P&I
- —
- Monthly cashflow
- —
- DSCR
- —
- Eligible?
- —
Personal DTI + credit; lowest rate.
DSCR
20% down · 8.5% · 30yr
- Down + closing
- —
- Monthly P&I
- —
- Monthly cashflow
- —
- DSCR
- —
- Eligible?
- —
No personal income docs; deal must DSCR.
Hard money
10% down · 12.0% · 12mo
- Down + closing
- —
- Monthly P&I
- —
- Monthly cashflow
- —
- DSCR
- —
- Eligible?
- —
Short-term bridge; refi at stabilization.
Rent comps 20 comps
| Address | Beds | Baths | Sqft | Rent | $/sqft | DOM | Units | Dist |
|---|---|---|---|---|---|---|---|---|
| 298 Werts St Greenville, SC | 2.0 | 2.0 | 1110 | $2,000 | $1.80 | 25d | 1 | 0.39mi |
| 400 Mills Ave Greenville, SC | 1.0 | 1.0 | 900 | $1,675 | $1.86 | 5d | 1 | 0.51mi |
| 8 Judson Rd Greenville, SC | 2.0 | 1.0 | 944 | $1,200 | $1.27 | 25d | 1 | 0.64mi |
| 806 Green Ave Greenville, SC | 3.0 | 1.0–2.0 | 1053 | $2,033 | $1.93 | 25d | 1 | 0.71mi |
| 317 Wilkins St Unit D Greenville, SC | 1.0 | 1.0 | 650 | $1,495 | $2.30 | 25d | 1 | 0.73mi |
| 321 Wilkins St Unit D Greenville, SC | 1.0 | 1.0 | 650 | $1,495 | $2.30 | 25d | 1 | 0.73mi |
| 119 Heatherly Dr Greenville, SC | 2.0 | 1.0 | 896 | $950 | $1.06 | 25d | 1 | 0.74mi |
| 101 Wilkins St Greenville, SC | 1.0 | 1.0 | 600 | $1,850 | $3.08 | 5d | 1 | 0.86mi |
| 4 Averill St Greenville, SC | 2.0 | 1.0 | 728 | $1,400 | $1.92 | 25d | 1 | 0.92mi |
| 701 Easley Bridge Rd Greenville, SC | 3.0 | 1.0–2.5 | 1324 | $2,758 | $2.08 | 4d | 110 | 1.02mi |
| 412 Green Ave Greenville, SC | 2.0 | 1.0 | 980 | $3,000 | $3.06 | 16d | 1 | 1.04mi |
| 29 4th St Greenville, SC | 3.0 | 2.0 | 1120 | $1,695 | $1.51 | 5d | 1 | 1.07mi |
| 100 Lewis Dr Unit 22-E Greenville, SC | 1.0 | 1.0 | 600 | $1,295 | $2.16 | 25d | 1 | 1.10mi |
| 4 Kilgore St Greenville, SC | 2.0 | 1.0 | 1050 | $1,500 | $1.43 | 25d | 1 | 1.28mi |
| 366 Field St Greenville, SC | 2.0 | 1.0–2.0 | 926 | $4,698 | $5.07 | 4d | 9 | 1.32mi |
| 301 Augusta St Unit 202 Greenville, SC | 1.0 | 1.5 | 861 | $1,725 | $2.00 | 25d | 1 | 1.33mi |
| 1108 S Main St Greenville, SC | 3.0 | 1.0–2.0 | 1060 | $2,883 | $2.72 | 5d | 25 | 1.38mi |
| 19 Dargan St Greenville, SC | 2.0 | 1.0 | 962 | $1,400 | $1.46 | 16d | 1 | 1.39mi |
| 823 S Church St Greenville, SC | 2.0 | 1.0–2.0 | 792 | $1,801 | $2.27 | 4d | 12 | 1.43mi |
| 111 N Calhoun St Greenville, SC | 2.0 | 1.0 | 650 | $1,250 | $1.92 | 25d | 1 | 1.48mi |
Listing history 29 events
-
2026-06-22days on market $210,000 Active 34 DOM
-
2026-06-18days on market $210,000 Active 31 DOM
-
2026-06-17days on market $210,000 Active 30 DOM
-
2026-06-16days on market $210,000 Active 29 DOM
-
2026-06-15pricedays on market $210,000 Active 28 DOM
-
2026-06-13days on market $225,000 Active 26 DOM
-
2026-06-13days on market $225,000 Active 25 DOM
-
2026-06-10days on market $225,000 Active 23 DOM
-
2026-06-09days on market $225,000 Active 22 DOM
-
2026-06-08days on market $225,000 Active 21 DOM
-
2026-06-07days on market $225,000 Active 20 DOM
-
2026-06-03days on market $225,000 Active 16 DOM
-
2026-06-03days on market $225,000 Active 15 DOM
-
2026-06-01days on market $225,000 Active 14 DOM
-
2026-05-31days on market $225,000 Active 13 DOM
-
2026-05-18$225,000 Active
-
2025-09-26historical $1,395
-
2025-09-06$1,395
-
2023-10-11historical $1,495
-
2023-10-07price $1,495
-
2023-09-30$1,525
-
2016-08-09soldstatus $100,000
-
2016-08-05historical 231-char remark
Show marketing remark (231 chars)
Yet another wonderful opportunity for Investor or First Time Home Buyers. The cute 2 bedroom 1 bathroom room home offers large rooms and several upgrades. Beautiful hardwoods through out. Large backyard for outdoor entertainment.
-
2016-08-05soldstatus $100,000 Sold 231-char remark
Show marketing remark (231 chars)
Yet another wonderful opportunity for Investor or First Time Home Buyers. The cute 2 bedroom 1 bathroom room home offers large rooms and several upgrades. Beautiful hardwoods through out. Large backyard for outdoor entertainment.
-
2016-06-22historical Contingency Contract 231-char remark
Show marketing remark (231 chars)
Yet another wonderful opportunity for Investor or First Time Home Buyers. The cute 2 bedroom 1 bathroom room home offers large rooms and several upgrades. Beautiful hardwoods through out. Large backyard for outdoor entertainment.
-
2016-06-08$105,000 Active 231-char remark
Show marketing remark (231 chars)
Yet another wonderful opportunity for Investor or First Time Home Buyers. The cute 2 bedroom 1 bathroom room home offers large rooms and several upgrades. Beautiful hardwoods through out. Large backyard for outdoor entertainment.
-
2014-10-03soldstatus $52,000
-
1997-01-01soldstatus $41,250
-
1990-12-05soldstatus $200,000
ⓘ Source: listings_history table (triggers on properties + properties_extension) + one-shot
backfill from property_details.listing_events for pre-trigger history.
Tax reassessment forecast SC · Resets to sale price
- Current annual tax
- $2,928 · $244/mo
- Projected year-2 tax
- $2,928 · $244/mo
- Expected delta
- $0/yr ($0/mo · 0.0%)
ⓘ Screening estimate from a state-policy table — verify with the county assessor before closing.
Climate risk First Street
- Flood 1/10 Low FEMA zone X (unshaded) · 0% chance over 30 yrs
- Wildfire 1/10 Low
- Heat 6/10 Major 7 d/yr ≥102°F today · 17 d/yr by 30 yrs out
- Wind 2/10 Low 100% chance of damaging wind over 30 yrs
- Air quality 4/10 Moderate 4 unhealthy d/yr today · 4 by 30 yrs out
Nearby sold comps map
Loading sold comps map…
Walkable amenities ~0.75 mi
Loading nearby amenities…
Taxation est. · year 1
- Rental income
- $21,049
- − Mortgage interest
- −$11,763
- − Property taxes
- −$2,928
- − Insurance
- −$1,050
- − Repairs & maintenance
- −$1,684
- − Management
- −$1,684
- − Depreciation
- −$6,109
- Taxable loss
- −$4,170
- Est. tax savings @ 24.0%
- +$1,001
- After-tax cash flow
- $436/yr
For passive investors: Depreciation is non-cash, so a rental often shows a tax loss while cash-flowing — sheltering income. Rental losses are passive: they offset passive income freely, and up to $25,000/yr can offset ordinary (W-2) income if you actively participate and your MAGI is under $100k (phasing out to $0 by $150k); unused losses carry forward. On sale, claimed depreciation is recaptured at up to 25%, and gains may owe capital-gains tax (a 1031 exchange can defer both). Figures are a year-1 estimate at your 24.0% rate — not tax advice; consult a CPA.
Schools (NCES district)
- District
- Greenville 01
- NCES district ID
- 4502310
- Math proficiency
- 44% ▼ -10.00%
- Reading proficiency
- 54% ▼ -2.00%
- Median HH income
- $49,596
- Composite
- 41.88/100
- National rank
- #3370
- State rank
- #10 of 80 in SC
Livability — Dunean
- Score
- 79/100
- State rank
- #14
- US rank
- #2248
Category grades
Schools grade is shown separately in the Schools card above.
Census & demographics
- Census place
- Dunean, SC
- County
- Greenville County · 573,815 people
- Metro
- Greenville-Anderson, SC
- Population (ZIP)
- 40,717
- Household income
- $65,648
- Rent vs Own
- Severe rent burden
- 978.0
Population outlook (Greenville County) Hauer SSP2
- Today (2025)
- 574,580 people
- By 2030
- 615,615 · +7.1%
- By 2040
- 695,373 · +21.0%
- By 2050
- 769,367 · +33.9%
- By 2075
- 933,296 · +62.4%
- By 2100
- 1,029,196 · +79.1%
Race, ethnicity, and origin ACS 2023
- Neighborhood character
- Diverse neighborhood (Simpson 0.66)
- Race & ethnicity
- White 45% Black 32% Hispanic / Latino 17% Two or more races 8%
- Hispanic origin (detail)
- Mexican 11%
- Common ancestry
- Slovak 3% Serbian 2% Italian 2%
- Foreign-born
- 9% · Canada, Jamaica
- Languages at home
- 85% English-only · Spanish 13% Other Indo-European 1%
Political lean MEDSL · Greenville
- 2024 margin
- Strong R (+22.2) · D 38.0% · R 60.2% · Other 1.8%
- 2008→2024 swing
- +1.7pp toward D · 2008: -23.9pp · 2024: -22.2pp
- All cycles
- 2024: R+22.2 2020: R+18.2 2016: R+24.7 2012: R+27.8 2008: R+23.9
Not yet ingested
- Civics
- —
Market trends
- HPI YoY
- ▼ -591.71%
- Current HPI
- 231.6906
- Rent YoY
- ▲ 3.72%
- Metro
- Greenville-Anderson, SC
- State GDP YoY
- ▲ 4.51%
- F500 in state
- 2
Industry mix (Fortune 500 HQ in SC)
| Industry | F500 HQs | Revenue |
|---|---|---|
| Packaging | 1 | $7B |
|
||
Price history
+12.5% since first listed14 events — show timeline
- 2026-05-18 Listed $225,000 Greater Greenville MLS
- 2025-09-26 Rental Removed $1,395 APPFOLIO
- 2025-09-06 Listed for Rent $1,395 APPFOLIO
- 2023-10-11 Rental Removed $1,495 RENT.
- 2023-10-07 Price Changed $1,495 RENT.
- 2023-09-30 Listed for Rent $1,525 RENT.
- 2016-08-09 Sold (Public Records) $100,000 Public Records
- 2016-08-05 Listing Removed — Greater Greenville MLS
- 2016-08-05 Sold (MLS) $100,000 Greater Greenville MLS
- 2016-06-22 Contingent — Greater Greenville MLS
- 2016-06-08 Listed $105,000 Greater Greenville MLS
- 2014-10-03 Sold (Public Records) $52,000 Public Records
- 1997-01-01 Sold (Public Records) $41,250 Public Records
- 1990-12-05 Sold (Public Records) $200,000 Public Records
Property tax history
+5.6%/yrLatest (2025): $2,928 · +3.8% YoY. Source: county tax records.
Cash-flow waterfall
monthlySold comps — $/sqft
last 12 mo · ≤1 miLoading sold comps…