 Multi-family
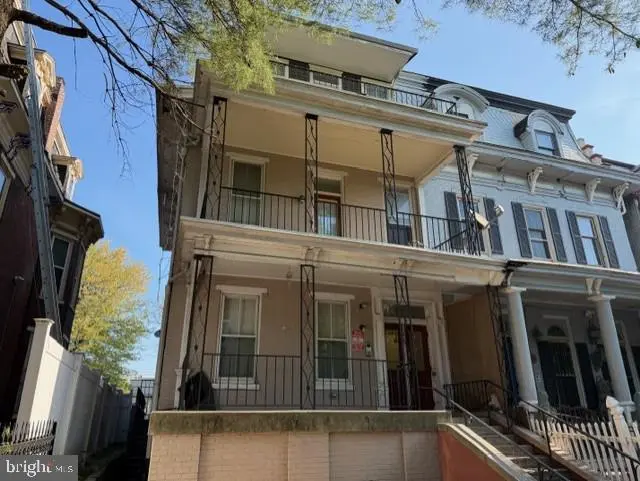
1330 Derry St · Harrisburg, PA
Flood risk No data
- FEMA flood zone
- —
- Chance of flooding over 30 yrs
- —
- Est. flood insurance / yr
- —
Fire risk No data
- Est. fire insurance / yr
- —
Heat risk No data
- Hot days now (above threshold)
- —
- Hot days in 30 yrs
- —
Wind risk No data
- Chance of severe wind over 30 yrs
- —
Air-quality risk No data
- Unhealthy air days now
- —
- Unhealthy air days in 30 yrs
- —
Risk factors via First Street. Map © Google.
Why this score? — see what drove the C+ grade
The composite is a weighted blend of 9 inputs, each scored 0–100. Each bar is that input's sub-score; the figure is the points it added to the 100-point composite (weight × sub-score).
- Cash flow +27.7/30.0
- DSCR +9.7/10.0
- 1% rule +7.6/10.0
- ARV discount +7.5/15.0
- Livability +4.2/5.0
- Rent growth +3.6/5.0
- Condition / age +2.2/5.0
- Schools +0.8/10.0
- Appreciation +0.0/10.0
$299,000
🖨 Deal sheet 📄 Offer letter ✓ Due diligence
Multi-family units
County records classify this as Multi-Family (5+ Unit). Listing-text estimate: 1 unit. estimate disagrees with records
5+ unit building — per-unit beds/baths from public records are typically unavailable; the breakdown below (if shown) is an estimate from the listing text.
Listing remarks
Three-unit investment property located in Harrisburg. Each unit features two spacious bedrooms with large room sizes and natural gas forced-air heat. The property offers a large balcony, generous outdoor space, and a rear yard, providing added appeal for tenants. A great opportunity for investors seeking a multi-unit property with strong rental potential.
Key facts
- 4,356 sq ft lot
- Built 1900
- Listed 56 days
Property features AI
Finance
- Financial info: Land assessed at $6,100; Improvements assessed at $26,700; Total tax assessed value $32,800 (tax year 2025); Annual taxes $1,668; Assessment year 2026
Exterior
- Parking: On-street parking
- Utilities: Public water; Public sewer; Natural gas service
- Home design: End of row townhouse/rowhouse; Fee simple ownership
- Construction: Brick construction; Block foundation
- Exterior features: No tidal water exposure; Other structures include above grade and below grade
Interior
- Bedrooms: Three 2-bedroom units
- Heating & cooling: Forced air heating; Natural gas heating and hot water
- Interior features: Three total residential units
Neighborhood map
What this means for you Summary
Snapshot
- This is a 6-bed/?-bath multifamily listed at $299k. Condition is rated fair.
Deal economics
- At list price, monthly cash flow is $899 ($11k/yr) — positive.
- The deal already cash-flows at list — no discount required.
- Meets the 1% rule at list price ($4k rent vs $299k).
- Recommended offer: $290k (3.0% below list) — sets the bar for market timing.
- Cap rate 9.9% vs local median 6.6% in Harrisburg — top-decile yield for the area; either an underpriced asset or a hidden risk that comps aren't pricing in. Stress-test before assuming the spread holds.
Location & tenants
- Location reads 84/100 on livability (#107 in PA, #826 nationally) — a professional / high-income tenant draw. Strengths: amenities A+, commute A+, cost of living A+; Watch: employment D, crime F.
- Harrisburg City SD (urban): math 6% / reading 13% proficiency, ranked #535 of 539 in PA (top 99%) — low school quality limits family demand, transient renter base, plan for 1-2y turnover; 82% free/reduced lunch — lower-income household profile, screen leases tightly.
- Zoned schools: Harrisburg Hs (math 24% / reading 10%, grade F, #399 of 437 statewide, top 92%, 1,230 students, 100% FRL) — zoned schools average 100% FRL vs 82% district-wide (18 pts higher); higher-poverty schools than district average — tighter screening recommended.
- Market conditions: Rents rising fast (+4.4%/yr); 67 active listings in the ZIP; 9 comparable units currently listed for rent nearby; rentals at typical pace (median 21d on market — plan ~3-4 weeks tenant-placement turnaround); 540 units permitted in Dauphin County in 2024 (194 in 5+ unit buildings).
- At $3,754/mo this rent would consume 97% of the median local household income ($47k/yr) (locally 1166% of renters already pay >50% of income on rent) — very limited rent-growth headroom before tenants either downsize or default.
Forward outlook
- Local home prices are declining (-3.0%/yr); year-one equity from $2k of loan paydown is wiped out by about $9k of value loss. Plan a longer hold.
- At projected returns (-3.0% appreciation + 4.4% rent growth), your $84k cash investment doubles in ~8 years — after that, you're playing with house money.
Negotiation context
- It's been on market 56 days — a 3% lower offer ($290k) is reasonable based on typical stale-listing flexibility.
- 3 sale attempts since 2y ago with the ask held roughly flat each time — persistent listings suggest the price (not the market) is what's stuck; bring a comps-based counter.
Risks & watch-outs
- Watch-outs: built in 1900 — expect roof / HVAC / electrical / plumbing capex.
Questions for the listing agent
- It's been on market 56 days. Have you received any prior offers? Is the seller open to a 3% concession, seller financing, or rate buy-down credit?
- Have any recent inspections been done? Can we get a copy of the seller's disclosures and any deferred-maintenance estimates?
- Built in 1900 — when were the roof, HVAC, electrical panel, plumbing, and water heater last replaced?
- Is there a deadline driving the sale (1031 exchange, divorce, estate, relocation)? That informs how much negotiation room exists.
- Crime grade is F in this area — have there been break-ins, vandalism, or insurance claims at this property in the last 3 years? What carrier currently insures it and at what premium?
- What's the average days-on-market for RENTAL listings here right now (not sales)? A rising rental-DOM trend means longer vacancies and softer asking-rent achievability than the comps imply.
- What's the recent tenant-quality profile in this submarket — average credit score on applications, eviction rate, late-payment / NSF rate, and stable-employment percentage? A property-management company in the area should have these aggregated.
- How much new apartment / multifamily construction is in the pipeline within 1–3 miles? Heavy new supply (>2% of stock underway) typically softens rents 12–24 months out; light construction supports rent growth.
Investment metrics
- 1% rule
- 1.26% ✓
- Cap rate
- 9.90%
- Cash-on-cash
- 12.89%
- DSCR
- 1.57
- GRM
- 6.6
CMA / ARV
- ARV (median comp)
- $169,613
- List price
- $299,000
- Delta
- 76.28%
- Verdict
- OVERPRICED
- Comps
- 20 within 1.0 mi
Show comp detail 12 sales within ~0.75 mi
| Address | Dist | Beds/Ba | Sqft | Sold | Price | $/sf | Match |
|---|---|---|---|---|---|---|---|
| 1254 Derry St | 0.09mi | 5/— (-1) | 2,756 | 2mo | $200,900 | $73 | 76 |
| 1252 Derry St | 0.10mi | 5/— (-1) | 2,800 | 4mo | $200,900 | $72 | 74 |
| 23 Evergreen St | 0.19mi | 6/2.0 | 2,016 | 8mo | $155,000 | $77 | 72 |
| 431 Hummel St | 0.28mi | 5/— (-1) | 2,176 | 0mo | $169,995 | $78 | 69 |
| 314 S 14th St | 0.12mi | 6/— | 2,135 | 16mo | $115,000 | $54 | 68 |
| 512 S 13th St | 0.33mi | 6/— | 2,280 | 5mo | $130,000 | $57 | 68 |
| 405 S 14th St | 0.20mi | 5/— (-1) | 1,980 | 12mo | $215,000 | $109 | 63 |
| 1621 Berryhill St | 0.36mi | 5/3.0 (-1) | 2,130 | 6mo | $225,000 | $106 | 61 |
| 60 Balm St | 0.37mi | 6/— | 2,890 | 17mo | $175,000 | $61 | 56 |
| 1426 State St | 0.52mi | 5/— (-1) | 2,390 | 8mo | $165,000 | $69 | 52 |
| 1414 State St | 0.51mi | 5/— (-1) | 2,354 | 15mo | $224,900 | $96 | 46 |
| 1923 State St | 0.72mi | 5/— (-1) | — | 3mo | $250,000 | — | 46 |
Match score weights: distance 35% · size 25% · config 20% · recency 20%. Top-matched comps best support the ARV.
Projected returns pro-forma
-3.0% appreciation · 4.43% rent growth · sell at horizon
- IRR
- 4.4%
- Equity multiple
- 1.17×
- Total profit
- $14,363
- Equity at exit
- $44,582
- IRR
- 15.1%
- Equity multiple
- 2.31×
- Total profit
- $109,638
- Equity at exit
- $25,852
Cash invested: $83,720 (down + closing). Projections, not guarantees.
Landlord ↔ Tenant lean methodology
- Overall (STATE)
- 62 Landlord-Friendly
- State Pennsylvania
- 62 Landlord-Friendly · EVEN
- County
- — inherits STATE
- City
- — inherits STATE
ZIP-level market 17104
- Home prices YoY
- -6.3%
- Rents YoY
- 4.4%
- Active inventory
- 67
- Price-to-rent
- 19.9×
Monthly cashflow live
- Estimated rent
- $3,754 high interval (Pro) →
- Mortgage (P&I)
- −$1,568
- Tax est. 1.5%
- −$374 /mo · $4,485/yr
- Insurance
- −$125
- HOA
- −$0
- Vacancy / Maint / Mgmt
- −$788
- Net cashflow
- $899
Break-even live
3-unit breakdown (identical units grouped — click to expand)
| Units | Beds | Baths | Est. rent |
|---|---|---|---|
| 3× units | 2 | 1 | $3,753 |
| #1 | 2 | 1 | $1,251 |
| #2 | 2 | 1 | $1,251 |
| #3 | 2 | 1 | $1,251 |
| Total (3 units) | $3,754 | ||
UW: 25.0% down · 7.5% · 30yr · 1.5% tax · 5.0% vac · 8.0% maint · 8.0% mgmt
Financing live
Cash to close
- Down payment
- $74,750
- Closing costs
- $8,970
- Reserves months
- —
- Total cash needed
- —
Loan-product check · same deal, 3 products live
Conventional
25% down · 7.5% · 30yr
- Down + closing
- —
- Monthly P&I
- —
- Monthly cashflow
- —
- DSCR
- —
- Eligible?
- —
Personal DTI + credit; lowest rate.
DSCR
20% down · 8.5% · 30yr
- Down + closing
- —
- Monthly P&I
- —
- Monthly cashflow
- —
- DSCR
- —
- Eligible?
- —
No personal income docs; deal must DSCR.
Hard money
10% down · 12.0% · 12mo
- Down + closing
- —
- Monthly P&I
- —
- Monthly cashflow
- —
- DSCR
- —
- Eligible?
- —
Short-term bridge; refi at stabilization.
Rent comps 9 comps
| Address | Beds | Baths | Sqft | Rent | $/sqft | DOM | Units | Dist |
|---|---|---|---|---|---|---|---|---|
| 227 Hummel St Harrisburg, PA | 5.0 | 2.0 | 2696 | $1,600 | $0.59 | 43d | 1 | 0.10mi |
| 29 S 15th St Harrisburg, PA | 5.0 | 1.0 | 1285 | $1,895 | $1.47 | 23d | 1 | 0.21mi |
| 1414 Berryhill St Harrisburg, PA | 5.0 | 2.0 | 1786 | $1,700 | $0.95 | 23d | 1 | 0.27mi |
| 14 S 17th St Harrisburg, PA | 5.0 | 2.0 | 2136 | $1,695 | $0.79 | 14d | 1 | 0.31mi |
| 66 N 17th St Harrisburg, PA | 5.0 | 2.0 | 1845 | $2,195 | $1.19 | 43d | 1 | 0.44mi |
| 111 N 17th St Harrisburg, PA | 5.0 | 1.0 | 1800 | $1,850 | $1.03 | 14d | 1 | 0.54mi |
| 1708 State St Harrisburg, PA | 5.0 | 1.5 | 2320 | $1,745 | $0.75 | 21d | 1 | 0.62mi |
| 1708 State St Harrisburg, PA | 5.0 | 3.0 | — | $1,745 | — | 14d | 1 | 0.62mi |
| 2368 Canby St Harrisburg, PA | 6.0 | 2.0 | 2142 | $2,300 | $1.07 | 21d | 1 | 1.35mi |
Listing history 21 events
-
2026-06-18days on market $299,000 Active 56 DOM
-
2026-06-17days on market $299,000 Active 55 DOM
-
2026-06-16days on market $299,000 Active 54 DOM
-
2026-06-15days on market $299,000 Active 53 DOM
-
2026-06-14days on market $299,000 Active 51 DOM
-
2026-06-13days on market $299,000 Active 50 DOM
-
2026-06-10days on market $299,000 Active 48 DOM
-
2026-06-09days on market $299,000 Active 47 DOM
-
2026-06-08days on market $299,000 Active 46 DOM
-
2026-06-07days on market $299,000 Active 45 DOM
-
2026-06-03days on market $299,000 Active 41 DOM
-
2026-06-02days on market $299,000 Active 40 DOM
-
2026-06-01days on market $299,000 Active 39 DOM
-
2026-05-31days on market $299,000 Active 38 DOM
-
2026-05-31days on market $299,000 Active 37 DOM
-
2026-04-23$299,000 Active 357-char remark
-
2024-09-21historical $900
-
2024-09-04$900
-
2024-03-14historical $900
-
2024-01-30$900
-
2022-03-13price $875
ⓘ Source: listings_history table (triggers on properties + properties_extension) + one-shot
backfill from property_details.listing_events for pre-trigger history.
Nearby sold comps map
Loading sold comps map…
Walkable amenities ~0.75 mi
Loading nearby amenities…
Taxation est. · year 1
- Rental income
- $45,048
- − Mortgage interest
- −$16,749
- − Property taxes
- −$4,485
- − Insurance
- −$1,495
- − Repairs & maintenance
- −$3,604
- − Management
- −$3,604
- − Depreciation
- −$8,698
- Taxable income
- $6,413
- Est. tax owed @ 24.0%
- −$1,539
- After-tax cash flow
- $9,253/yr
For passive investors: Depreciation is non-cash, so a rental often shows a tax loss while cash-flowing — sheltering income. Rental losses are passive: they offset passive income freely, and up to $25,000/yr can offset ordinary (W-2) income if you actively participate and your MAGI is under $100k (phasing out to $0 by $150k); unused losses carry forward. On sale, claimed depreciation is recaptured at up to 25%, and gains may owe capital-gains tax (a 1031 exchange can defer both). Figures are a year-1 estimate at your 24.0% rate — not tax advice; consult a CPA.
Condition & rehab AI · 12 photos
Three-unit investment property in Harrisburg with moderate repairs and maintenance needed. Upgrades to kitchen and bathroom would significantly enhance its resale and rental value.
Repairs flagged
- Major kitchen appliances — Old and worn
- Major bathroom fixtures — Basic and dated
- Moderate exterior siding — Shows some wear
Value-add opportunities
- Both Painting and updating kitchen appliances — Enhances curb appeal and interior aesthetics
- Both Updating bathroom fixtures — Improves functionality and appeal
- Both Re-siding exterior — Enhances curb appeal and structural integrity
Renovation cost estimate screening
| Repair item | Severity | Est. cost |
|---|---|---|
| kitchen appliances · Old and worn | Major | $15,000–50,000 |
| bathroom fixtures · Basic and dated | Major | $15,000–50,000 |
| exterior siding · Shows some wear | Moderate | $3,000–15,000 |
| Total estimated repair cost · 3 items | $33,000–115,000 |
Value-add ROI direction
- Both Painting and updating kitchen appliances — Enhances curb appeal and interior aesthetics ↑
- Both Updating bathroom fixtures — Improves functionality and appeal ↑
- Both Re-siding exterior — Enhances curb appeal and structural integrity ↑
ⓘ Cost ranges are severity-bucket heuristics (US national rule-of-thumb). Get contractor quotes + a written scope before underwriting a rehab budget.
Schools (NCES district)
- District
- Harrisburg City SD
- NCES district ID
- 4211580
- Math proficiency
- 6% ▼ -6.00%
- Reading proficiency
- 13% ▼ -10.00%
- Median HH income
- $33,432
- Composite
- 7.6/100
- National rank
- #9945
- State rank
- #535 of 539 in PA
Livability — Harrisburg
- Score
- 84/100
- State rank
- #107
- US rank
- #826
Category grades
Schools grade is shown separately in the Schools card above.
Census & demographics
- Census place
- Harrisburg, PA
- County
- Dauphin County · 247,857 people
- City population
- 184,296
- Metro
- Harrisburg-Carlisle, PA
- Population (ZIP)
- 18,541
- Household income
- $46,510
- Rent vs Own
- Severe rent burden
- 1166.0
Population outlook (Dauphin County) Hauer SSP2
- Today (2025)
- 281,628 people
- By 2030
- 283,549 · +0.7%
- By 2040
- 285,385 · +1.3%
- By 2050
- 286,188 · +1.6%
- By 2075
- 291,053 · +3.3%
- By 2100
- 282,374 · +0.3%
Race, ethnicity, and origin ACS 2023
- Neighborhood character
- Diverse neighborhood (Simpson 0.69)
- Race & ethnicity
- Black 44% Hispanic / Latino 29% White 19% Two or more races 12% Asian 3% Native American 1%
- Hispanic origin (detail)
- Puerto Rican 21% Dominican 6%
- Common ancestry
- Polish 1% Romanian 1% Slovak 1%
- Foreign-born
- 10% · Canada, China, Vietnam
- Languages at home
- 73% English-only · Spanish 21% Other Indo-European 1% Chinese 1%
Political lean MEDSL · Dauphin
- 2024 margin
- Lean D (+5.9) · D 52.4% · R 46.5% · Other 1.1%
- 2008→2024 swing
- -3.1pp toward R · 2008: 9.1pp · 2024: 5.9pp
- All cycles
- 2024: D+5.9 2020: D+8.5 2016: D+2.8 2012: D+6.0 2008: D+9.1
Not yet ingested
- Civics
- —
Market trends
- HPI YoY
- ▼ -22.83%
- Current HPI
- 340.2808
- Rent YoY
- ▲ 4.43%
- Metro
- Harrisburg-Carlisle, PA
- State GDP YoY
- ▲ 1.68%
- F500 in state
- 34
Industry mix (Fortune 500 HQ in PA)
| Industry | F500 HQs | Revenue |
|---|---|---|
| Healthcare | 2 | $309B |
|
||
| Insurance | 2 | $27B |
|
||
| Telecommunications / Media | 1 | $124B |
|
||
| Industrial Distribution | 1 | $22B |
|
||
| Financial Services | 1 | $20B |
|
||
| Chemicals / Materials | 1 | $18B |
|
||
Price history
6 events — show timeline
- 2026-04-23 Listed $299,000 BRIGHT MLS
- 2024-09-21 Rental Removed $900 APPFOLIO
- 2024-09-04 Listed for Rent $900 APPFOLIO
- 2024-03-14 Rental Removed $900 APPFOLIO
- 2024-01-30 Listed for Rent $900 APPFOLIO
- 2022-03-13 Price Changed $875 RENT.
Cash-flow waterfall
monthlySold comps — $/sqft
last 12 mo · ≤1 miLoading sold comps…