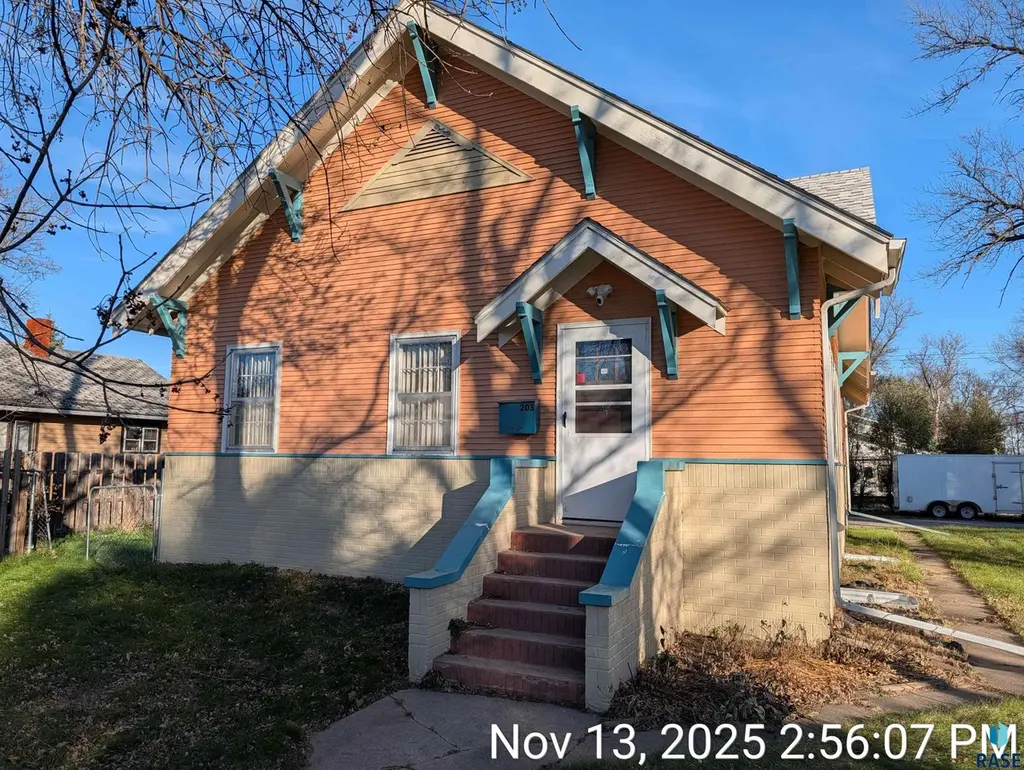
203 E 6th Ave Ave · Sisseton, SD
Flood risk 1/10 · Minimal
- FEMA flood zone
- X (unshaded)
- Chance of flooding over 30 yrs
- 0.0%
- Est. flood insurance / yr
- $473 – $860
Fire risk 5/10 · Moderate
- Est. fire insurance / yr
- $1,342 – $2,492
Heat risk 2/10 · Minimal
- Hot days now (above 99°F)
- 7 days/yr
- Hot days in 30 yrs
- 13 days/yr
Wind risk 2/10 · Minimal
- Chance of severe wind over 30 yrs
- —
Air-quality risk 3/10 · Minor
- Unhealthy air days now
- 3 days/yr
- Unhealthy air days in 30 yrs
- 3 days/yr
Risk factors via First Street. Map © Google.
Why this score? — see what drove the C grade
The composite is a weighted blend of 9 inputs, each scored 0–100. Each bar is that input's sub-score; the figure is the points it added to the 100-point composite (weight × sub-score).
- Cash flow +17.0/30.0
- ARV discount +15.0/15.0
- DSCR +5.3/10.0
- Appreciation +5.0/10.0
- 1% rule +4.6/10.0
- Livability +3.4/5.0
- Schools +3.2/10.0
- Rent growth +2.5/5.0
- Condition / age +2.5/5.0
$112,000
🖨 Deal sheet 📄 Offer letter ✓ Due diligence
Key facts
- 0.25 acre lot
- 3 garage spots
- Built 1936
Property features AI
Finance
- Financial info: Annual tax information available
Exterior
- Parking: Detached garage with 3 spaces; Garage dimensions: 23 x 23 and 11 x 22; Oversized garage with separate workshop
- Home design: Single family residence; Architectural style: Other
- Construction: Below-grade finished area and unfinished area present
- Exterior features: Composition roof; Land is owned; Lot dimensions approximately 88 x 125
Interior
- Kitchen: Kitchen on the main level (approx. 10 x 19)
- Bedrooms: Main-level master bedroom (approx. 13 x 15); Main-level second bedroom (approx. 11 x 11)
- Flooring: Tile; Vinyl; Wood
- Bathrooms: One full bathroom on the main level; One 3/4 bathroom in the basement
- Interior features: Formal dining room; Full basement with potential for another bedroom; Basement family room with fireplace
Neighborhood map
What this means for you Summary
Snapshot
- This is a 2-bed/2.0-bath other listed at $112k.
Deal economics
- At list price, monthly cash flow is $76 ($912/yr) — positive.
- The deal already cash-flows at list — no discount required.
- To meet the 1% rule (rent ≥ 1% of price), the offer needs to be $108k (3.9% below list).
- Recommended offer: $108k (3.9% below list) — sets the bar for 1% rule.
Location & tenants
- Location reads 67/100 on livability (#97 in SD) — a middle-class / working-renter tenant base. Strengths: cost of living A+, housing A+, crime A-; Watch: health & safety C-, schools F, amenities F.
- Sisseton School District 54-2 (rural): math 34% / reading 42% proficiency, ranked #54 of 59 in SD (top 92%) — families likely to look elsewhere, expect single-tenant / working-renter base with shorter leases.
- Market conditions: 5 active listings in the ZIP; 23 units permitted in Roberts County in 2024 (0 in 5+ unit buildings).
Forward outlook
- In year one you build about $4k of equity ($774 loan paydown + $3k appreciation (3.0% local appreciation)).
- Roberts County population projected at +8% by 2050 — modest demand growth; plan on rents tracking national, not racing it.
- At projected returns (3.0% appreciation + 3.0% rent growth), your $31k cash investment doubles in ~6 years — after that, you're playing with house money.
- By year 8, paydown + projected appreciation supports a ~$31k cash-out refi (75% LTV) — recoverable capital for the next deal without selling this one.
Negotiation context
- It's been on market 35 days — a 3% lower offer ($109k) is reasonable based on typical stale-listing flexibility.
- 2 sale attempts; this cycle's ask has dropped $8k (7%) from the opening price — seller is motivated, your offer sets the floor, not the list.
Risks & watch-outs
- Watch-outs: built in 1936 — expect roof / HVAC / electrical / plumbing capex.
- Climate carrying-cost: moderate wildfire risk — expect insurance premiums to compound above CPI over the hold.
Questions for the listing agent
- It's been on market 35 days. Have you received any prior offers? Is the seller open to a 4% concession, seller financing, or rate buy-down credit?
- Built in 1936 — when were the roof, HVAC, electrical panel, plumbing, and water heater last replaced?
- Is there a deadline driving the sale (1031 exchange, divorce, estate, relocation)? That informs how much negotiation room exists.
- Schools are F-rated, which usually means shorter tenancies and higher turnover. Who's the typical renter profile here, and what's been the actual vacancy rate?
- What's the average days-on-market for RENTAL listings here right now (not sales)? A rising rental-DOM trend means longer vacancies and softer asking-rent achievability than the comps imply.
- What's the recent tenant-quality profile in this submarket — average credit score on applications, eviction rate, late-payment / NSF rate, and stable-employment percentage? A property-management company in the area should have these aggregated.
- How much new for-sale + rental construction is in the pipeline within 1–3 miles? Heavy new supply typically softens prices + rents 12–24 months out; constrained supply supports both.
Investment metrics
- 1% rule
- 0.96% ✗
- Cap rate
- 7.11%
- Cash-on-cash
- 2.91%
- DSCR
- 1.13
- GRM
- 8.7
CMA / ARV
- ARV (median comp)
- $143,198
- List price
- $112,000
- Delta
- -21.79%
- Verdict
- UNDERPRICED
- Comps
- 11 within 1.0 mi
Projected returns pro-forma
3.0% appreciation · 3.0% rent growth · sell at horizon
- IRR
- 10.2%
- Equity multiple
- 1.59×
- Total profit
- $18,351
- Equity at exit
- $50,360
- IRR
- 12.5%
- Equity multiple
- 2.87×
- Total profit
- $58,580
- Equity at exit
- $77,611
Cash invested: $31,360 (down + closing). Projections, not guarantees.
Landlord ↔ Tenant lean methodology
- Overall (STATE)
- 83 Strongly Landlord-Friendly
- State South Dakota
- 83 Strongly Landlord-Friendly · R+16
- County
- — inherits STATE
- City
- — inherits STATE
ZIP-level market 57262
- Active inventory
- 5
- Price-to-rent
- 8.7×
Monthly cashflow live
- Estimated rent
- $1,076 medium interval (Pro) →
- Mortgage (P&I)
- −$587
- Tax est. 1.5%
- −$140 /mo · $1,680/yr
- Insurance
- −$47
- HOA
- −$0
- Vacancy / Maint / Mgmt
- −$226
- Net cashflow
- $76
Break-even live
UW: 25.0% down · 7.5% · 30yr · 1.5% tax · 5.0% vac · 8.0% maint · 8.0% mgmt
Financing live
Cash to close
- Down payment
- $28,000
- Closing costs
- $3,360
- Reserves months
- —
- Total cash needed
- —
Loan-product check · same deal, 3 products live
Conventional
25% down · 7.5% · 30yr
- Down + closing
- —
- Monthly P&I
- —
- Monthly cashflow
- —
- DSCR
- —
- Eligible?
- —
Personal DTI + credit; lowest rate.
DSCR
20% down · 8.5% · 30yr
- Down + closing
- —
- Monthly P&I
- —
- Monthly cashflow
- —
- DSCR
- —
- Eligible?
- —
No personal income docs; deal must DSCR.
Hard money
10% down · 12.0% · 12mo
- Down + closing
- —
- Monthly P&I
- —
- Monthly cashflow
- —
- DSCR
- —
- Eligible?
- —
Short-term bridge; refi at stabilization.
Listing history 23 events
-
2026-06-18days on market $112,000 Active 35 DOM
-
2026-06-17days on market $112,000 Active 34 DOM
-
2026-06-16days on market $112,000 Active 33 DOM
-
2026-06-15days on market $112,000 Active 32 DOM
-
2026-06-13days on market $112,000 Active 30 DOM
-
2026-06-12days on market $112,000 Active 29 DOM
-
2026-06-09days on market $112,000 Active 26 DOM
-
2026-06-08days on market $112,000 Active 25 DOM
-
2026-06-08days on market $112,000 Active 24 DOM
-
2026-06-05days on market $112,000 Active 22 DOM
-
2026-06-04days on market $112,000 Active 20 DOM
-
2026-06-02days on market $112,000 Active 19 DOM
-
2026-06-01price $112,000 Active 18 DOM
-
2026-06-01days on market $120,000 Active 18 DOM
-
2026-05-31days on market $120,000 Active 17 DOM
-
2026-05-14$120,000 Active 532-char remark
-
2026-05-14historical
-
2026-04-24price $120,000
-
2026-03-23price $128,000
-
2026-02-24price $136,000
-
2026-01-21price $144,000
-
2025-12-17price $152,000
-
2025-11-13$160,000 Active
ⓘ Source: listings_history table (triggers on properties + properties_extension) + one-shot
backfill from property_details.listing_events for pre-trigger history.
Climate risk First Street
- Flood 1/10 Low FEMA zone X (unshaded) · 0% chance over 30 yrs
- Wildfire 5/10 Major
- Heat 2/10 Low 7 d/yr ≥99°F today · 13 d/yr by 30 yrs out
- Wind 2/10 Low
- Air quality 3/10 Moderate 3 unhealthy d/yr today · 3 by 30 yrs out
Nearby sold comps map
Loading sold comps map…
Walkable amenities ~0.75 mi
Loading nearby amenities…
Taxation est. · year 1
- Rental income
- $12,912
- − Mortgage interest
- −$6,274
- − Property taxes
- −$1,680
- − Insurance
- −$560
- − Repairs & maintenance
- −$1,033
- − Management
- −$1,033
- − Depreciation
- −$3,258
- Taxable loss
- −$926
- Est. tax savings @ 24.0%
- +$222
- After-tax cash flow
- $1,135/yr
For passive investors: Depreciation is non-cash, so a rental often shows a tax loss while cash-flowing — sheltering income. Rental losses are passive: they offset passive income freely, and up to $25,000/yr can offset ordinary (W-2) income if you actively participate and your MAGI is under $100k (phasing out to $0 by $150k); unused losses carry forward. On sale, claimed depreciation is recaptured at up to 25%, and gains may owe capital-gains tax (a 1031 exchange can defer both). Figures are a year-1 estimate at your 24.0% rate — not tax advice; consult a CPA.
Schools (NCES district)
- District
- Sisseton School District 54-2
- NCES district ID
- 4600053
- Math proficiency
- 34% ▲ 7.00%
- Reading proficiency
- 42% ▲ 7.00%
- Median HH income
- $39,282
- Composite
- 31.79/100
- National rank
- #5888
- State rank
- #54 of 59 in SD
Livability — Sisseton
- Score
- 67/100
- State rank
- #97
- US rank
- #10604
Category grades
Schools grade is shown separately in the Schools card above.
Census & demographics
- Census place
- Sisseton, SD
- Population (ZIP)
- 5,043
Population outlook (Roberts County) Hauer SSP2
- Today (2025)
- 10,364 people
- By 2030
- 10,440 · +0.7%
- By 2040
- 10,680 · +3.0%
- By 2050
- 11,162 · +7.7%
- By 2075
- 14,113 · +36.2%
- By 2100
- 18,926 · +82.6%
Race, ethnicity, and origin ACS 2023
- Neighborhood character
- Highly diverse neighborhood (Simpson 0.86)
- Race & ethnicity
- Native American 55% White 37% Two or more races 5% Hispanic / Latino 3%
- Common ancestry
- Portuguese 15% Danish 1% Lithuanian 1%
- Foreign-born
- 0%
Political lean MEDSL · Roberts
- 2024 margin
- Strong R (+23.0) · D 37.6% · R 60.6% · Other 1.8%
- 2008→2024 swing
- -42.6pp toward R · 2008: 19.6pp · 2024: -23.0pp
- All cycles
- 2024: R+23.0 2020: R+13.4 2016: R+15.5 2012: D+9.8 2008: D+19.6
Not yet ingested
- Civics
- —
Market trends
- HPI YoY
- —
- Current HPI
- —
- Rent YoY
- —
- Metro
- —
- State GDP YoY
- ▲ 0.70%
- F500 in state
- 2
Industry mix (Fortune 500 HQ in SD)
| Industry | F500 HQs | Revenue |
|---|---|---|
| Utilities | 1 | $1B |
|
||
Price history
-30.0% since first listed9 events — show timeline
- 2026-06-01 Price Changed $112,000 REALTOR® Association of the Sioux Empire
- 2026-05-14 Listed $120,000 REALTOR® Association of the Sioux Empire
- 2026-05-14 Listing Removed — REALTOR® Association of the Sioux Empire
- 2026-04-24 Price Changed $120,000 REALTOR® Association of the Sioux Empire
- 2026-03-23 Price Changed $128,000 REALTOR® Association of the Sioux Empire
- 2026-02-24 Price Changed $136,000 REALTOR® Association of the Sioux Empire
- 2026-01-21 Price Changed $144,000 REALTOR® Association of the Sioux Empire
- 2025-12-17 Price Changed $152,000 REALTOR® Association of the Sioux Empire
- 2025-11-13 Listed $160,000 REALTOR® Association of the Sioux Empire
Cash-flow waterfall
monthlySold comps — $/sqft
last 12 mo · ≤1 miLoading sold comps…