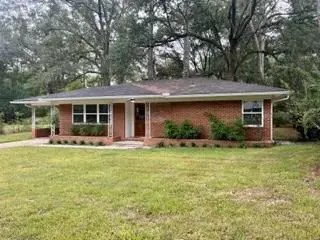
630 W 21st St · Laurel, MS
Flood risk 6/10 · Moderate
- FEMA flood zone
- X (unshaded)
- Chance of flooding over 30 yrs
- 0.69%
- Est. flood insurance / yr
- $507 – $1,088
Fire risk 3/10 · Minor
- Est. fire insurance / yr
- $1,241 – $2,305
Heat risk 7/10 · Major
- Hot days now (above 108°F)
- 7 days/yr
- Hot days in 30 yrs
- 19 days/yr
Wind risk 8/10 · Major
- Chance of severe wind over 30 yrs
- 98.0%
Air-quality risk 1/10 · Minimal
- Unhealthy air days now
- 0 days/yr
- Unhealthy air days in 30 yrs
- 0 days/yr
Risk factors via First Street. Map © Google.
Why this score? — see what drove the C grade
The composite is a weighted blend of 9 inputs, each scored 0–100. Each bar is that input's sub-score; the figure is the points it added to the 100-point composite (weight × sub-score).
- Cash flow +25.4/30.0
- DSCR +8.4/10.0
- ARV discount +7.5/15.0
- 1% rule +6.2/10.0
- Livability +3.3/5.0
- Rent growth +2.5/5.0
- Condition / age +2.5/5.0
- Schools +1.3/10.0
- Appreciation +0.0/10.0
$135,000
🖨 Deal sheet 📄 Offer letter ✓ Due diligence
Listing remarks
Charming 2-bedroom, 1-bath brick home located within the city limits of Laurel, MS, just minutes from Mason Park, downtown, and convenient to shops, grocery stores, restaurants, and more. This recently updated home offers approximately 1,007 square feet of comfortable living space with a low-maintenance slab foundation. Inside, you'll find a welcoming layout, freshly updated finishes, and plenty of natural light. The large yard provides ample space for outdoor enjoyment, gardening, or future expansion, while the single-car carport adds everyday convenience. Perfect for first-time buyers, downsizers, or investors—this move-in-ready home combines comfort, practicality, and location in o
Key facts
- Single car carport
- Convenient to shops
- Large yard
Tags
Property features AI
Exterior
- Parking: Attached carport; 1 carport space; Concrete parking
- Utilities: Public water
- Home design: Single-story ranch; Residential property
- Construction: Brick construction; Slab foundation
- Exterior features: Lot approximately 75 x 190
Interior
- Bathrooms: 1 full bathroom
- Heating & cooling: Has cooling; Ceiling fan(s)
- Interior features: Ceiling fan(s); Electric water heater; Total of 5 rooms
Neighborhood map
What this means for you Summary
Snapshot
- This is a 2-bed/1.0-bath single-family listed at $135k.
Deal economics
- At list price, monthly cash flow is $310 ($4k/yr) — positive.
- The deal already cash-flows at list — no discount required.
- Meets the 1% rule at list price ($2k rent vs $135k).
- Recommended offer: $131k (3.0% below list) — sets the bar for market timing.
Location & tenants
- Location reads 66/100 on livability (#92 in MS) — a middle-class / working-renter tenant base. Strengths: cost of living A+, housing A+, health & safety A+; Watch: crime F, commute F, employment F.
- Laurel School District (town): math 16% / reading 18% proficiency, ranked #101 of 130 in MS (top 78%) — low school quality limits family demand, transient renter base, plan for 1-2y turnover; 88% free/reduced lunch — lower-income household profile, screen leases tightly.
- Zoned schools: Laurel Middle School (math 14% / reading 15%, grade F, #133 of 179 statewide, top 76%, 555 students, 100% FRL); Laurel High School (math 11% / reading 12%, grade F, #166 of 197 statewide, top 85%, 708 students, 100% FRL).
- Market conditions: 131 active listings in the ZIP; 1 comparable units currently listed for rent nearby; 23 units permitted in Jones County in 2024 (5 in 5+ unit buildings).
Forward outlook
- Local home prices are declining (-3.0%/yr); year-one equity from $933 of loan paydown is wiped out by about $4k of value loss. Plan a longer hold.
- Jones County population projected to shrink 4% by 2050 — rents likely to lag national; underwrite the cash flow, not the appreciation.
Negotiation context
- It's been on market 35 days — a 3% lower offer ($131k) is reasonable based on typical stale-listing flexibility.
- 3 sale attempts since 3y ago with the ask held roughly flat each time — persistent listings suggest the price (not the market) is what's stuck; bring a comps-based counter.
Risks & watch-outs
- Watch-outs: built in 1957 — expect roof / HVAC / electrical / plumbing capex.
- Climate carrying-cost: major flood risk; severe wind risk, 98% chance of damaging wind over 30y; extreme-heat days projected 7→19/yr by 2055 (HVAC capex compounding) — expect insurance premiums to compound above CPI over the hold.
Questions for the listing agent
- It's been on market 35 days. Have you received any prior offers? Is the seller open to a 3% concession, seller financing, or rate buy-down credit?
- Built in 1957 — when were the roof, HVAC, electrical panel, plumbing, and water heater last replaced?
- Is there a deadline driving the sale (1031 exchange, divorce, estate, relocation)? That informs how much negotiation room exists.
- Schools are D-rated, which usually means shorter tenancies and higher turnover. Who's the typical renter profile here, and what's been the actual vacancy rate?
- Crime grade is F in this area — have there been break-ins, vandalism, or insurance claims at this property in the last 3 years? What carrier currently insures it and at what premium?
- What's the average days-on-market for RENTAL listings here right now (not sales)? A rising rental-DOM trend means longer vacancies and softer asking-rent achievability than the comps imply.
- What's the recent tenant-quality profile in this submarket — average credit score on applications, eviction rate, late-payment / NSF rate, and stable-employment percentage? A property-management company in the area should have these aggregated.
- How much new for-sale + rental construction is in the pipeline within 1–3 miles? Heavy new supply typically softens prices + rents 12–24 months out; constrained supply supports both.
Investment metrics
- 1% rule
- 1.12% ✓
- Cap rate
- 9.05%
- Cash-on-cash
- 9.83%
- DSCR
- 1.44
- GRM
- 7.4
CMA / ARV
- ARV (median comp)
- $46,523
- List price
- $135,000
- Delta
- 190.18%
- Verdict
- OVERPRICED
- Comps
- 6 within 1.0 mi
Show comp detail 1 sale within ~0.75 mi
| Address | Dist | Beds/Ba | Sqft | Sold | Price | $/sf | Match |
|---|---|---|---|---|---|---|---|
| 2206 N 3rd Ave | 0.33mi | 2/1.0 | 936 (-7%) | 9mo | $35,000 | $37 | 65 |
Match score weights: distance 35% · size 25% · config 20% · recency 20%. Top-matched comps best support the ARV.
Projected returns pro-forma
-3.0% appreciation · 3.0% rent growth · sell at horizon
- IRR
- -1.5%
- Equity multiple
- 0.94×
- Total profit
- $-2,152
- Equity at exit
- $20,129
- IRR
- 8.2%
- Equity multiple
- 1.62×
- Total profit
- $23,513
- Equity at exit
- $11,672
Cash invested: $37,800 (down + closing). Projections, not guarantees.
Landlord ↔ Tenant lean methodology
- Overall (STATE)
- 90 Strongly Landlord-Friendly
- State Mississippi
- 90 Strongly Landlord-Friendly · R+11
- County
- — inherits STATE
- City
- — inherits STATE
ZIP-level market 39440
- Active inventory
- 131
- Price-to-rent
- 7.4×
Monthly cashflow live
- Estimated rent
- $1,518 medium interval (Pro) →
- Mortgage (P&I)
- −$708
- Tax from tax record
- −$125 /mo · $1,498/yr
- Insurance
- −$56
- HOA
- −$0
- Vacancy / Maint / Mgmt
- −$319
- Net cashflow
- $310
Break-even live
UW: 25.0% down · 7.5% · 30yr · 1.5% tax · 5.0% vac · 8.0% maint · 8.0% mgmt
Financing live
Cash to close
- Down payment
- $33,750
- Closing costs
- $4,050
- Reserves months
- —
- Total cash needed
- —
Loan-product check · same deal, 3 products live
Conventional
25% down · 7.5% · 30yr
- Down + closing
- —
- Monthly P&I
- —
- Monthly cashflow
- —
- DSCR
- —
- Eligible?
- —
Personal DTI + credit; lowest rate.
DSCR
20% down · 8.5% · 30yr
- Down + closing
- —
- Monthly P&I
- —
- Monthly cashflow
- —
- DSCR
- —
- Eligible?
- —
No personal income docs; deal must DSCR.
Hard money
10% down · 12.0% · 12mo
- Down + closing
- —
- Monthly P&I
- —
- Monthly cashflow
- —
- DSCR
- —
- Eligible?
- —
Short-term bridge; refi at stabilization.
Rent comps 1 comps
| Address | Beds | Baths | Sqft | Rent | $/sqft | DOM | Units | Dist |
|---|---|---|---|---|---|---|---|---|
| 3017 Old Amy Rd Laurel, MS | 1.0–3.0 | 1.0–2.0 | 1025 | $1,518 | $1.48 | 14d | 3 | 1.38mi |
Listing history 16 events
-
2026-06-18days on market $135,000 Active 35 DOM
-
2026-06-17days on market $135,000 Active 34 DOM
-
2026-06-16days on market $135,000 Active 33 DOM
-
2026-06-15days on market $135,000 Active 32 DOM
-
2026-06-13days on market $135,000 Active 30 DOM
-
2026-06-12days on market $135,000 Active 29 DOM
-
2026-06-09days on market $135,000 Active 26 DOM
-
2026-06-08days on market $135,000 Active 25 DOM
-
2026-06-07days on market $135,000 Active 24 DOM
-
2026-06-05days on market $135,000 Active 22 DOM
-
2026-06-04days on market $135,000 Active 20 DOM
-
2026-06-02days on market $135,000 Active 19 DOM
-
2026-06-01days on market $135,000 Active 18 DOM
-
2026-05-31days on market $135,000 Active 17 DOM
-
2026-05-08$135,000 Active 800-char remark
-
2023-10-13$145,000 Active
ⓘ Source: listings_history table (triggers on properties + properties_extension) + one-shot
backfill from property_details.listing_events for pre-trigger history.
Tax reassessment forecast MS · Resets to sale price
- Current annual tax
- $1,498 · $125/mo
- Projected year-2 tax
- $1,498 · $125/mo
- Expected delta
- $0/yr ($0/mo · 0.0%)
ⓘ Screening estimate from a state-policy table — verify with the county assessor before closing.
Climate risk First Street
- Flood 6/10 Major FEMA zone X (unshaded) · 69% chance over 30 yrs
- Wildfire 3/10 Moderate
- Heat 7/10 Severe 7 d/yr ≥108°F today · 19 d/yr by 30 yrs out
- Wind 8/10 Severe 98% chance of damaging wind over 30 yrs
- Air quality 1/10 Low 0 unhealthy d/yr today · 0 by 30 yrs out
Nearby sold comps map
Loading sold comps map…
Walkable amenities ~0.75 mi
Loading nearby amenities…
Taxation est. · year 1
- Rental income
- $18,210
- − Mortgage interest
- −$7,562
- − Property taxes
- −$1,498
- − Insurance
- −$675
- − Repairs & maintenance
- −$1,457
- − Management
- −$1,457
- − Depreciation
- −$3,927
- Taxable income
- $1,634
- Est. tax owed @ 24.0%
- −$392
- After-tax cash flow
- $3,325/yr
For passive investors: Depreciation is non-cash, so a rental often shows a tax loss while cash-flowing — sheltering income. Rental losses are passive: they offset passive income freely, and up to $25,000/yr can offset ordinary (W-2) income if you actively participate and your MAGI is under $100k (phasing out to $0 by $150k); unused losses carry forward. On sale, claimed depreciation is recaptured at up to 25%, and gains may owe capital-gains tax (a 1031 exchange can defer both). Figures are a year-1 estimate at your 24.0% rate — not tax advice; consult a CPA.
Schools (NCES district)
- District
- Laurel School District
- NCES district ID
- 2802460
- Math proficiency
- 16% ▼ -11.00%
- Reading proficiency
- 18% ▼ -4.00%
- Median HH income
- $28,415
- Composite
- 13.36/100
- National rank
- #9535
- State rank
- #101 of 130 in MS
Livability — Laurel
- Score
- 66/100
- State rank
- #92
- US rank
- #11413
Category grades
Schools grade is shown separately in the Schools card above.
Census & demographics
- Census place
- Laurel, MS
- City population
- 20,111
- Population (ZIP)
- 20,111
Population outlook (Jones County) Hauer SSP2
- Today (2025)
- 68,800 people
- By 2030
- 68,773 · +-0.0%
- By 2040
- 68,087 · -1.0%
- By 2050
- 66,241 · -3.7%
- By 2075
- 58,600 · -14.8%
- By 2100
- 45,744 · -33.5%
Race, ethnicity, and origin ACS 2023
- Neighborhood character
- Majority Black (63%)
- Race & ethnicity
- Black 63% White 30% Hispanic / Latino 6% Two or more races 3% Native American 1%
- Hispanic origin (detail)
- Mexican 5%
- Common ancestry
- Lithuanian 1% Slovak 1% Serbian 1%
- Foreign-born
- 3% · Canada
- Languages at home
- 94% English-only · Spanish 5%
Political lean MEDSL · Jones
- 2024 margin
- Solid R (+46.8) · D 26.2% · R 73.0%
- 2008→2024 swing
- -8.2pp toward R · 2008: -38.6pp · 2024: -46.8pp
- All cycles
- 2024: R+46.8 2020: R+42.2 2016: R+43.6 2012: R+38.2 2008: R+38.6
Not yet ingested
- Civics
- —
Market trends
- HPI YoY
- ▼ -104.63%
- Current HPI
- 126.2541
- Rent YoY
- —
- Metro
- —
- State GDP YoY
- —
- F500 in state
- 0
Price history
-6.9% since first listed4 events — show timeline
- 2026-05-29 Relisted — LBOR
- 2026-05-23 Pending — LBOR
- 2026-05-08 Listed $135,000 LBOR
- 2023-10-13 Listed $145,000 LBOR
Property tax history
+12.8%/yrLatest (2025): $1,498 · +8.0% YoY. Source: county tax records.
Cash-flow waterfall
monthlySold comps — $/sqft
last 12 mo · ≤1 miLoading sold comps…