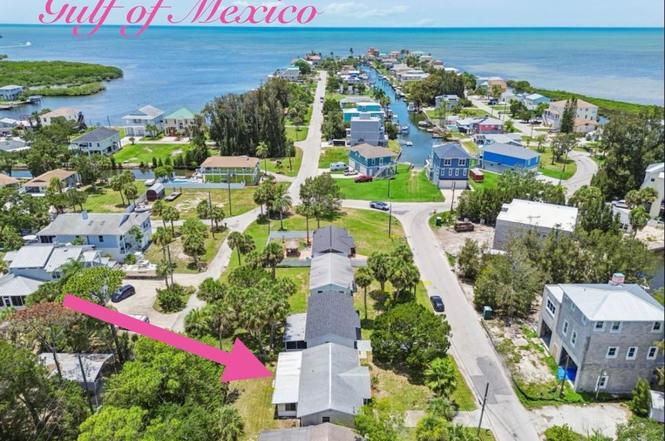
6826 Driftwood Dr · Hudson, FL
Flood risk 10/10 · Severe
- FEMA flood zone
- AE
- Chance of flooding over 30 yrs
- 0.99%
- Est. flood insurance / yr
- $1,737 – $8,500
Fire risk 5/10 · Moderate
- Est. fire insurance / yr
- $947 – $1,759
Heat risk 10/10 · Severe
- Hot days now (above 113°F)
- 7 days/yr
- Hot days in 30 yrs
- 21 days/yr
Wind risk 10/10 · Severe
- Chance of severe wind over 30 yrs
- 99.0%
Air-quality risk 2/10 · Minimal
- Unhealthy air days now
- 2 days/yr
- Unhealthy air days in 30 yrs
- 2 days/yr
Risk factors via First Street. Map © Google.
Why this score? — see what drove the B- grade
The composite is a weighted blend of 9 inputs, each scored 0–100. Each bar is that input's sub-score; the figure is the points it added to the 100-point composite (weight × sub-score).
- Cash flow +30.0/30.0
- DSCR +10.0/10.0
- 1% rule +7.6/10.0
- ARV discount +7.5/15.0
- Schools +4.3/10.0
- Livability +3.7/5.0
- Condition / age +2.5/5.0
- Rent growth +1.9/5.0
- Appreciation +0.0/10.0
$165,000
🖨 Deal sheet (PDF) 📄 Offer letter ✓ Due diligence
Listing remarks MLS
Back on the market- Buyer got cold feet. Investor special! Sold AS-IS, home has been flood cut. Seller saved the granite in kitchen and upper cabinets. Garage door is newer 2023 and still rolls up and down. Roof 2017, AC 2023, newer screen roof from 2021. This is a great block home that needs walls and finsihing touches. Would be a great vacation home, rental, or full time home for a handy homeowner. This is a Golf Cart community, close to public boat ramp, Hudson Beach and restaurants.
Key facts
- Spacious island
- Screened lanai
- Updated kitchen
Tags
Property features AI
Finance
- Other: Unfurnished; Living area approximately 832 square feet (estimated); Building area 1,344 square feet (public records)
- HOA & community: No HOA association on file; Pets allowed
Exterior
- Parking: Attached garage with garage door opener (1 car)
- Utilities: Public water; Public sewer; Cable available; Electricity connected; Water connected; Sewer connected
- Home design: Single family residence; One story; Faces north; Residential zoning (R4)
- Construction: Block and stucco construction; Shingle roof; Slab foundation; Built on a 0.11-acre lot
- Exterior features: Covered, enclosed rear porch; Private mailbox; Wood fencing; Paved road access; Trees and landscaped yard
Interior
- Kitchen: Microwave; Range; Refrigerator
- Bedrooms: 2 bedrooms
- Flooring: Vinyl
- Bathrooms: 1 full bathroom
- Heating & cooling: Electric heating; Central air conditioning
- Interior features: Ceiling fans; Solid surface counters; Thermostat
- Laundry & utility: Laundry in garage
Neighborhood map
What this means for you Summary
Snapshot
- This is a 2-bed/1.0-bath single-family listed at $165k.
Deal economics
- At list price, monthly cash flow is $194 ($2k/yr) — positive.
- The deal already cash-flows at list — no discount required.
- Meets the 1% rule at list price ($2k rent vs $165k).
- Cap rate 10.8% vs local median 3.3% in Hudson — top-decile yield for the area; either an underpriced asset or a hidden risk that comps aren't pricing in. Stress-test before assuming the spread holds.
Location & tenants
- Location reads 74/100 on livability (#289 in FL, #4,856 nationally) — a middle-class / working-renter tenant base. Strengths: cost of living A+, housing A+, health & safety A+; Watch: amenities D, employment D, commute F.
- Pasco (suburban): math 50% / reading 52% proficiency, ranked #32 of 73 in FL (top 44%) — acceptable for families but not a draw, mixed tenant base, ~2y average lease.
- Zoned schools: Hudson Academy (math 35% / reading 30%, grade F, #443 of 571 statewide, top 78%, 964 students, 80% FRL) — zoned schools average 80% FRL vs 48% district-wide (31 pts higher); higher-poverty schools than district average — tighter screening recommended.
- Zoned-school proficiency averages 32% at this address vs 51% district-wide (-18 pts) — the specific schools serving this property underperform the Pasco average; the district grade overstates school quality for this exact location.
- Market conditions: Rents soft (-2.3%/yr); 800 active listings in the ZIP; 3 comparable units currently listed for rent nearby; rentals at typical pace (median 26d on market — plan ~3-4 weeks tenant-placement turnaround); 6,765 units permitted in Pasco County in 2024 (1,250 in 5+ unit buildings).
- At $2,075/mo this rent would consume 49% of the median local household income ($51k/yr) (locally 946% of renters already pay >50% of income on rent) — very limited rent-growth headroom before tenants either downsize or default.
Forward outlook
- Local home prices are declining (-3.0%/yr); year-one equity from $1k of loan paydown is wiped out by about $5k of value loss. Plan a longer hold.
- Pasco County population projected at +29% by 2050 — long-run rental-demand tailwind backs the buy-and-hold thesis.
Negotiation context
- Only 7 days on market — expect competitive offers; lowballing is unlikely to land.
- 11 sale attempts since 21y ago with the ask held roughly flat each time — persistent listings suggest the price (not the market) is what's stuck; bring a comps-based counter.
- Current owner paid $98k; list at $165k implies a 68% gain — meaningful room to come down on a strong offer.
Risks & watch-outs
- Watch-outs: flood insurance adds $427/mo.
- Climate carrying-cost: in FEMA flood zone AE (mandatory federal flood insurance); severe wind risk, 99% chance of damaging wind over 30y; moderate wildfire risk; extreme-heat days projected 7→21/yr by 2055 (HVAC capex compounding) — expect insurance premiums to compound above CPI over the hold.
Questions for the listing agent
- What's the actual annual flood-insurance premium (NFIP or private), and is the property in a SFHA with mandatory coverage?
- Is there a deadline driving the sale (1031 exchange, divorce, estate, relocation)? That informs how much negotiation room exists.
- Schools are D-rated, which usually means shorter tenancies and higher turnover. Who's the typical renter profile here, and what's been the actual vacancy rate?
- What's the average days-on-market for RENTAL listings here right now (not sales)? A rising rental-DOM trend means longer vacancies and softer asking-rent achievability than the comps imply.
- What's the recent tenant-quality profile in this submarket — average credit score on applications, eviction rate, late-payment / NSF rate, and stable-employment percentage? A property-management company in the area should have these aggregated.
- How much new for-sale + rental construction is in the pipeline within 1–3 miles? Heavy new supply typically softens prices + rents 12–24 months out; constrained supply supports both.
Investment metrics
- 1% rule
- 1.26% ✓
- Cap rate
- 10.81%
- Cash-on-cash
- 16.12%
- DSCR
- 1.72
- GRM
- 6.6
CMA / ARV
- ARV (on-the-fly)
- $75,264
- Comps found
- 4
Show comp detail 4 sales within ~0.75 mi
| Address | Dist | Beds/Ba | Sqft | Sold | Price | $/sf | Match |
|---|---|---|---|---|---|---|---|
| 7309 Cobia Ln | 0.50mi | 2/1.0 | 672 (0%) | 15mo | $155,000 | $231 | 64 |
| 14708 Coral Dr | 0.59mi | 2/1.0 | 672 (0%) | 14mo | $70,000 | $104 | 60 |
| 14621 Coral Dr | 0.56mi | 3/1.5 (+1) | 672 (0%) | 14mo | $75,000 | $112 | 55 |
| 14635 Coral Dr | 0.56mi | 2/1.0 | 736 (+10%) | 5mo | $80,000 | $109 | 53 |
Match score weights: distance 35% · size 25% · config 20% · recency 20%. Top-matched comps best support the ARV.
Projected returns pro-forma
-3.0% appreciation · 0.0% rent growth · sell at horizon
- IRR
- -12.6%
- Equity multiple
- 0.56×
- Total profit
- $-20,249
- Equity at exit
- $24,602
- IRR
- -10.4%
- Equity multiple
- 0.47×
- Total profit
- $-24,340
- Equity at exit
- $14,266
Cash invested: $46,200 (down + closing). Projections, not guarantees.
Landlord ↔ Tenant lean methodology
- Overall (STATE)
- 87 Strongly Landlord-Friendly
- State Florida
- 87 Strongly Landlord-Friendly · R+3
- County
- — inherits STATE
- City
- — inherits STATE
ZIP-level market 34667
- Rents YoY
- -2.3%
- Active inventory
- 800
- Price-to-rent
- 6.6×
Monthly cashflow live
- Estimated rent
- $2,075 medium interval (Pro) →
- Mortgage (P&I)
- −$865
- Tax from tax record
- −$84 /mo · $1,014/yr
- Insurance
- −$69
- Flood insurance flood zone
- −$427 /mo · $5,118/yr
- HOA
- −$0
- Vacancy / Maint / Mgmt
- −$436
- Net cashflow
- $194
Break-even live
Sensitivity live
| Price | -10% $287 | -5% $241 | +0% $194 | +5% $147 | +10% $100 |
|---|---|---|---|---|---|
| Rent | -10% $30 | -5% $112 | +0% $194 | +5% $276 | +10% $358 |
| Rate | -1.0pp $277 | -0.5pp $236 | base $194 | +0.5pp $151 | +1.0pp $108 |
UW: 25.0% down · 7.5% · 30yr · 1.5% tax · 5.0% vac · 8.0% maint · 8.0% mgmt
Financing live
Cash to close
- Down payment
- $41,250
- Closing costs
- $4,950
- Reserves months
- —
- Total cash needed
- —
Loan-product check · same deal, 3 products live
Conventional
25% down · 7.5% · 30yr
- Down + closing
- —
- Monthly P&I
- —
- Monthly cashflow
- —
- DSCR
- —
- Eligible?
- —
Personal DTI + credit; lowest rate.
DSCR
20% down · 8.5% · 30yr
- Down + closing
- —
- Monthly P&I
- —
- Monthly cashflow
- —
- DSCR
- —
- Eligible?
- —
No personal income docs; deal must DSCR.
Hard money
10% down · 12.0% · 12mo
- Down + closing
- —
- Monthly P&I
- —
- Monthly cashflow
- —
- DSCR
- —
- Eligible?
- —
Short-term bridge; refi at stabilization.
Rent comps 3 comps
| Address | Beds | Baths | Sqft | Rent | $/sqft | DOM | Units | Dist |
|---|---|---|---|---|---|---|---|---|
| 6009 Sea Ranch Dr #704 Hudson, FL | 1.0 | 1.0 | 733 | $1,800 | $2.46 | 26d | 1 | 1.19mi |
| 7939 Cadillac Ave Unit 1 Hudson, FL | 2.0 | 1.0 | 700 | $1,900 | $2.71 | 26d | 1 | 1.22mi |
| 5915 Sea Ranch Dr #703 Hudson, FL | 1.0 | 1.0 | 733 | $2,700 | $3.68 | 26d | 1 | 1.27mi |
Listing history 6 events
-
2026-06-21days on market $165,000 Active 7 DOM
-
2026-06-18days on market $165,000 Active 4 DOM
-
2026-06-17days on market $165,000 Active 3 DOM
-
2026-06-16days on market $165,000 Active 2 DOM
-
2026-06-15remarks 687-char remark
-
2026-06-15$165,000 Active 1 DOM
ⓘ Source: listings_history table (triggers on properties + properties_extension) + one-shot
backfill from property_details.listing_events for pre-trigger history.
Tax reassessment forecast FL · Resets to sale price
- Current annual tax
- $1,014 · $84/mo
- Projected year-2 tax
- $1,370 · $114/mo
- Expected delta
- +$356/yr (+$30/mo · 35.1%)
ⓘ Screening estimate from a state-policy table — verify with the county assessor before closing.
Climate risk First Street
- Flood 10/10 Extreme FEMA zone AE · 99% chance over 30 yrs
- Wildfire 5/10 Major
- Heat 10/10 Extreme 7 d/yr ≥113°F today · 21 d/yr by 30 yrs out
- Wind 10/10 Extreme 99% chance of damaging wind over 30 yrs
- Air quality 2/10 Low 2 unhealthy d/yr today · 2 by 30 yrs out
Nearby sold comps map
Loading sold comps map…
Walkable amenities ~0.75 mi
Loading nearby amenities…
Taxation est. · year 1
- Rental income
- $24,895
- − Mortgage interest
- −$9,243
- − Property taxes
- −$1,014
- − Insurance
- −$5,944
- − Repairs & maintenance
- −$1,992
- − Management
- −$1,992
- − Depreciation
- −$4,800
- Taxable loss
- −$88
- Est. tax savings @ 24.0%
- +$21
- After-tax cash flow
- $2,348/yr
For passive investors: Depreciation is non-cash, so a rental often shows a tax loss while cash-flowing — sheltering income. Rental losses are passive: they offset passive income freely, and up to $25,000/yr can offset ordinary (W-2) income if you actively participate and your MAGI is under $100k (phasing out to $0 by $150k); unused losses carry forward. On sale, claimed depreciation is recaptured at up to 25%, and gains may owe capital-gains tax (a 1031 exchange can defer both). Figures are a year-1 estimate at your 24.0% rate — not tax advice; consult a CPA.
Schools (NCES district)
- District
- Pasco
- NCES district ID
- 1201530
- Math proficiency
- 50% ▼ -10.00%
- Reading proficiency
- 52% ▼ -5.00%
- Median HH income
- $45,039
- Composite
- 43.14/100
- National rank
- #3074
- State rank
- #32 of 73 in FL
Livability — Hudson
- Score
- 74/100
- State rank
- #289
- US rank
- #4856
Category grades
Schools grade is shown separately in the Schools card above.
Census & demographics
- Census place
- Hudson, FL
- County
- Pasco County · 524,098 people
- City population
- 45,307
- Metro
- Tampa-St. Petersburg-Clearwater, FL
- Population (ZIP)
- 30,689
- Household income
- $51,280
- Rent vs Own
- Severe rent burden
- 946.0
Population outlook (Pasco County) Hauer SSP2
- Today (2025)
- 570,045 people
- By 2030
- 605,844 · +6.3%
- By 2040
- 674,806 · +18.4%
- By 2050
- 736,022 · +29.1%
- By 2075
- 862,900 · +51.4%
- By 2100
- 906,364 · +59.0%
Race, ethnicity, and origin ACS 2023
- Neighborhood character
- Predominantly White (86%)
- Race & ethnicity
- White 86% Hispanic / Latino 7% Two or more races 6% Black 2% Asian 2%
- Hispanic origin (detail)
- Mexican 1% Puerto Rican 2%
- Common ancestry
- Romanian 4% Lithuanian 3% Slovak 2%
- Foreign-born
- 7% · Canada, Jamaica, Vietnam
- Languages at home
- 91% English-only · Spanish 5% Other Indo-European 2% French/Haitian/Cajun 0%
Political lean MEDSL · Pasco
- 2024 margin
- Strong R (+25.2) · D 36.9% · R 62.1% · Other 1.0%
- 2008→2024 swing
- -21.6pp toward R · 2008: -3.6pp · 2024: -25.2pp
- All cycles
- 2024: R+25.2 2020: R+20.1 2016: R+21.6 2012: R+6.7 2008: R+3.6
Not yet ingested
- Civics
- —
Market trends
- HPI YoY
- ▼ -183.96%
- Current HPI
- 307.5552
- Rent YoY
- ▼ -2.26%
- Metro
- Tampa-St. Petersburg-Clearwater, FL
- State GDP YoY
- ▲ 3.28%
- F500 in state
- 36
Industry mix (Fortune 500 HQ in FL)
| Industry | F500 HQs | Revenue |
|---|---|---|
| Industrial Technology | 2 | $29B |
|
||
| Insurance | 2 | $17B |
|
||
| Retail | 1 | $60B |
|
||
| Technology Distribution | 1 | $58B |
|
||
| Homebuilding | 1 | $35B |
|
||
| Technology Manufacturing | 1 | $35B |
|
||
Price history
+650.0% since first listed36 events — show timeline
- 2026-06-14 Listed $165,000 Stellar MLS as Distributed by MLS Grid
- 2026-06-14 Price Changed $165,000 Stellar MLS as Distributed by MLS Grid
- 2026-01-08 Sold (Public Records) $98,000 Public Records
- 2026-01-06 Sold (MLS) $98,000 Stellar MLS as Distributed by MLS Grid
- 2025-12-22 Pending — Stellar MLS as Distributed by MLS Grid
- 2025-11-05 Price Changed $115,000 Stellar MLS as Distributed by MLS Grid
- 2025-07-31 Relisted — Stellar MLS as Distributed by MLS Grid
- 2025-07-23 Pending — Stellar MLS as Distributed by MLS Grid
- 2025-07-12 Price Changed $130,000 Stellar MLS as Distributed by MLS Grid
- 2025-06-12 Listed $140,000 Stellar MLS as Distributed by MLS Grid
- 2025-05-25 Listing Removed — Stellar MLS as Distributed by MLS Grid
- 2025-03-31 Price Changed $160,000 Stellar MLS as Distributed by MLS Grid
- 2025-01-30 Price Changed $165,000 Stellar MLS as Distributed by MLS Grid
- 2024-12-19 Listed $180,000 Stellar MLS as Distributed by MLS Grid
- 2024-11-16 Listing Removed — Stellar MLS as Distributed by MLS Grid
- 2024-11-01 Price Changed $169,900 Stellar MLS as Distributed by MLS Grid
- 2024-11-01 Listed $179,900 Stellar MLS as Distributed by MLS Grid
- 2021-04-12 Sold (Public Records) $125,000 Public Records
- 2021-04-09 Sold (MLS) $125,000 Stellar MLS as Distributed by MLS Grid
- 2021-04-01 Pending — Stellar MLS as Distributed by MLS Grid
- 2021-02-27 Pending — Stellar MLS as Distributed by MLS Grid
- 2021-02-20 Price Changed $139,000 Stellar MLS as Distributed by MLS Grid
- 2021-02-20 Relisted — Stellar MLS as Distributed by MLS Grid
- 2021-01-30 Pending — Stellar MLS as Distributed by MLS Grid
- 2020-11-29 Listed $149,900 Stellar MLS as Distributed by MLS Grid
- 2017-12-15 Sold (Public Records) $90,000 Public Records
- 2017-12-08 Sold (MLS) $90,000 Stellar MLS as Distributed by MLS Grid
- 2017-10-19 Pending — Stellar MLS as Distributed by MLS Grid
- 2017-09-30 Listed $99,900 Stellar MLS as Distributed by MLS Grid
- 2017-08-21 Sold (Public Records) $47,500 Public Records
- 2013-09-11 Listed $79,900 Stellar MLS as Distributed by MLS Grid
- 2011-12-09 Listed $74,900 Stellar MLS as Distributed by MLS Grid
- 2005-08-19 Sold (Public Records) $103,000 Public Records
- 2005-08-18 Sold (MLS) $103,000 Stellar MLS as Distributed by MLS Grid
- 2005-08-15 Listed $103,000 Stellar MLS as Distributed by MLS Grid
- 1997-03-31 Sold (Public Records) $22,000 Public Records
Property tax history
+4.7%/yrLatest (2025): $1,014 · -62.4% YoY. Source: county tax records.
Cash-flow waterfall
monthlySold comps — $/sqft
last 12 mo · ≤1 miLoading sold comps…