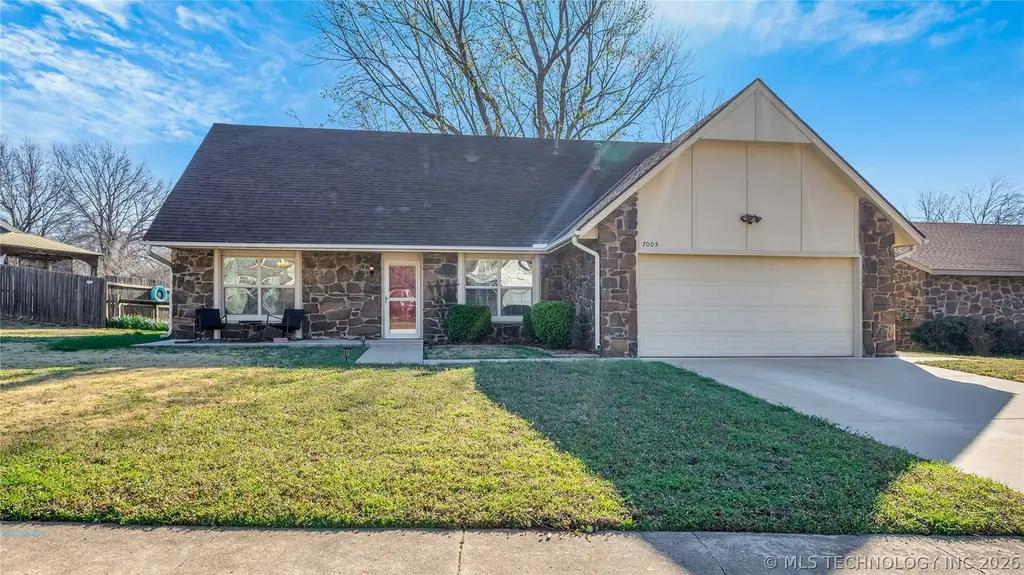
7005 S Birch Ave · Broken Arrow, OK
Flood risk 1/10 · Minimal
- FEMA flood zone
- X (unshaded)
- Chance of flooding over 30 yrs
- 0.0%
- Est. flood insurance / yr
- $473 – $860
Fire risk 4/10 · Minor
- Est. fire insurance / yr
- $2,463 – $4,575
Heat risk 7/10 · Major
- Hot days now (above 111°F)
- 7 days/yr
- Hot days in 30 yrs
- 18 days/yr
Wind risk 3/10 · Minor
- Chance of severe wind over 30 yrs
- 4.0%
Air-quality risk 2/10 · Minimal
- Unhealthy air days now
- 1 days/yr
- Unhealthy air days in 30 yrs
- 1 days/yr
Risk factors via First Street. Map © Google.
Why this score? — see what drove the C+ grade
The composite is a weighted blend of 9 inputs, each scored 0–100. Each bar is that input's sub-score; the figure is the points it added to the 100-point composite (weight × sub-score).
- Cash flow +23.8/30.0
- ARV discount +11.7/15.0
- DSCR +7.7/10.0
- 1% rule +5.5/10.0
- Livability +3.9/5.0
- Rent growth +3.5/5.0
- Condition / age +2.5/5.0
- Schools +2.4/10.0
- Appreciation +0.0/10.0
$258,700
🖨 Deal sheet (PDF) 📄 Offer letter ✓ Due diligence
Listing remarks MLS
4 Bedrm Updated, Mstr Down, Lots Of Updates Last Few Yrs. Paint In & Out, New Carpet, Wood Laminate In Family, Formal Liv & Dining. Ceramic, H/W Heater All New Lite Fixtures, Crown Molding & Fixtures. Huge Backyard! Room For Expansion. A Must See!
Key facts
- Newer fence
- Large storage closet
- Cozy fireplace
Tags
Neighborhood map
What this means for you Summary
Snapshot
- This is a 4-bed/2.0-bath single-family listed at $259k.
Deal economics
- At list price, monthly cash flow is $498 ($6k/yr) — positive.
- The deal already cash-flows at list — no discount required.
- Meets the 1% rule at list price ($3k rent vs $259k).
- Cap rate 8.6% vs local median 4.0% in Broken Arrow — top-decile yield for the area; either an underpriced asset or a hidden risk that comps aren't pricing in. Stress-test before assuming the spread holds.
Location & tenants
- Location reads 78/100 on livability (#7 in OK, #2,691 nationally) — a middle-class / working-renter tenant base. Strengths: commute A+, cost of living A+, housing A+; Watch: amenities F.
- Broken Arrow (suburban): math 23% / reading 28% proficiency, ranked #79 of 270 in OK (top 29%) — low school quality limits family demand, transient renter base, plan for 1-2y turnover.
- Zoned schools: Spring Creek Es (math 32% / reading 27%, grade F, #255 of 845 statewide, top 35%, 494 students, 0% FRL); Childers Ms (math 16% / reading 28%, grade F, #129 of 345 statewide, top 42%, 796 students, 0% FRL); Broken Arrow Hs (math 22% / reading 36%, grade F, #120 of 447 statewide, top 27%, 4,589 students, 0% FRL) — zoned schools average 0% FRL vs 33% district-wide (33 pts lower); this property's tenant base skews higher-income than the district average.
- Market conditions: Rents rising fast (+4.1%/yr); 385 active listings in the ZIP; 5 comparable units currently listed for rent nearby; rentals leasing fast (median 5d on market — plan ~1-2 weeks tenant-placement turnaround); solid renter incomes; 2,818 units permitted in Tulsa County in 2024 (518 in 5+ unit buildings).
- This rent runs 33% of the median local income ($99k/yr) — at the standard rent-burdened threshold; future hikes will face affordability resistance.
Forward outlook
- Local home prices are declining (-3.0%/yr); year-one equity from $2k of loan paydown is wiped out by about $8k of value loss. Plan a longer hold.
- Tulsa County population projected at +30% by 2050 — long-run rental-demand tailwind backs the buy-and-hold thesis.
Negotiation context
- Only 3 days on market — expect competitive offers; lowballing is unlikely to land.
- 7 sale attempts since 28y ago with the ask held roughly flat each time — persistent listings suggest the price (not the market) is what's stuck; bring a comps-based counter.
- Current owner paid $140k; list at $259k implies a 85% gain — meaningful room to come down on a strong offer.
Risks & watch-outs
- Climate carrying-cost: extreme-heat days projected 7→18/yr by 2055 (HVAC capex compounding) — expect insurance premiums to compound above CPI over the hold.
Questions for the listing agent
- Built in 1979 — when were the roof, HVAC, electrical panel, plumbing, and water heater last replaced?
- Is there a deadline driving the sale (1031 exchange, divorce, estate, relocation)? That informs how much negotiation room exists.
- Schools are D-rated, which usually means shorter tenancies and higher turnover. Who's the typical renter profile here, and what's been the actual vacancy rate?
- What's the average days-on-market for RENTAL listings here right now (not sales)? A rising rental-DOM trend means longer vacancies and softer asking-rent achievability than the comps imply.
- What's the recent tenant-quality profile in this submarket — average credit score on applications, eviction rate, late-payment / NSF rate, and stable-employment percentage? A property-management company in the area should have these aggregated.
- How much new for-sale + rental construction is in the pipeline within 1–3 miles? Heavy new supply typically softens prices + rents 12–24 months out; constrained supply supports both.
Investment metrics
- 1% rule
- 1.05% ✓
- Cap rate
- 8.60%
- Cash-on-cash
- 8.24%
- DSCR
- 1.37
- GRM
- 7.9
CMA / ARV
- ARV (on-the-fly)
- $285,300
- Comps found
- 12
Show comp detail 12 sales within ~0.75 mi
| Address | Dist | Beds/Ba | Sqft | Sold | Price | $/sf | Match |
|---|---|---|---|---|---|---|---|
| 7005 S Birch Ave | 0.00mi | 4/2.5 | 1,902 (0%) | 1mo | $269,200 | $142 | 97 |
| 6500 Birch Ave | 0.19mi | 3/2.0 (-1) | 1,981 (+4%) | 5mo | $216,000 | $109 | 76 |
| 7500 S Gum Ave | 0.45mi | 4/2.0 | 1,941 (+2%) | 2mo | $308,500 | $159 | 74 |
| 6312 S Date Ave | 0.30mi | 4/2.0 | 1,750 (-8%) | 4mo | $280,000 | $160 | 70 |
| 805 W Glenwood Ave | 0.54mi | 4/2.5 | 1,884 (-1%) | 4mo | $220,000 | $117 | 68 |
| 6605 S 1st St | 0.24mi | 4/2.5 | 2,051 (+8%) | 9mo | $310,000 | $151 | 66 |
| 909 W Albuquerque St | 0.46mi | 3/2.0 (-1) | 1,786 (-6%) | 1mo | $303,000 | $170 | 62 |
| 213 W Quanah St S | 0.41mi | 3/2.0 (-1) | 1,808 (-5%) | 6mo | $266,900 | $148 | 62 |
| 6605 S Ash Pl | 0.19mi | 3/2.5 (-1) | 2,143 (+13%) | 9mo | $205,000 | $96 | 56 |
| 117 W Timberlane Ct | 0.68mi | 3/2.0 (-1) | 1,749 (-8%) | 2mo | $252,500 | $144 | 48 |
| 7606 Glenwood Cir | 0.48mi | 3/2.0 (-1) | 1,634 (-14%) | 2mo | $245,000 | $150 | 47 |
| 7737 S Park Ave | 0.66mi | 3/2.0 (-1) | 1,647 (-13%) | 5mo | $260,000 | $158 | 37 |
Match score weights: distance 35% · size 25% · config 20% · recency 20%. Top-matched comps best support the ARV.
Projected returns pro-forma
-3.0% appreciation · 4.09% rent growth · sell at horizon
- IRR
- -2.6%
- Equity multiple
- 0.90×
- Total profit
- $-7,241
- Equity at exit
- $38,573
- IRR
- 8.2%
- Equity multiple
- 1.65×
- Total profit
- $47,027
- Equity at exit
- $22,368
Cash invested: $72,436 (down + closing). Projections, not guarantees.
Landlord ↔ Tenant lean methodology
- Overall (STATE)
- 83 Strongly Landlord-Friendly
- State Oklahoma
- 83 Strongly Landlord-Friendly · R+20
- County
- — inherits STATE
- City
- — inherits STATE
ZIP-level market 74011
- Rents YoY
- 4.1%
- Active inventory
- 385
- Price-to-rent
- 7.9×
Monthly cashflow live
- Estimated rent
- $2,726 high interval (Pro) →
- Mortgage (P&I)
- −$1,357
- Tax from tax record
- −$191 /mo · $2,297/yr
- Insurance
- −$108
- HOA
- −$0
- Vacancy / Maint / Mgmt
- −$572
- Net cashflow
- $498
Break-even live
Sensitivity live
| Price | -10% $644 | -5% $571 | +0% $498 | +5% $424 | +10% $351 |
|---|---|---|---|---|---|
| Rent | -10% $282 | -5% $390 | +0% $498 | +5% $605 | +10% $713 |
| Rate | -1.0pp $628 | -0.5pp $563 | base $498 | +0.5pp $431 | +1.0pp $362 |
UW: 25.0% down · 7.5% · 30yr · 1.5% tax · 5.0% vac · 8.0% maint · 8.0% mgmt
Financing live
Cash to close
- Down payment
- $64,675
- Closing costs
- $7,761
- Reserves months
- —
- Total cash needed
- —
Loan-product check · same deal, 3 products live
Conventional
25% down · 7.5% · 30yr
- Down + closing
- —
- Monthly P&I
- —
- Monthly cashflow
- —
- DSCR
- —
- Eligible?
- —
Personal DTI + credit; lowest rate.
DSCR
20% down · 8.5% · 30yr
- Down + closing
- —
- Monthly P&I
- —
- Monthly cashflow
- —
- DSCR
- —
- Eligible?
- —
No personal income docs; deal must DSCR.
Hard money
10% down · 12.0% · 12mo
- Down + closing
- —
- Monthly P&I
- —
- Monthly cashflow
- —
- DSCR
- —
- Eligible?
- —
Short-term bridge; refi at stabilization.
Rent comps 5 comps
| Address | Beds | Baths | Sqft | Rent | $/sqft | DOM | Units | Dist |
|---|---|---|---|---|---|---|---|---|
| 6308 S 1st Pl Broken Arrow, OK | 3.0 | 2.0 | 1600 | $3,400 | $2.12 | 17d | 1 | 0.31mi |
| 7313 S Walnut Ave Broken Arrow, OK | 3.0 | 2.0 | 1600 | $1,990 | $1.24 | 12d | 1 | 1.30mi |
| 2008 W Huntsville Pl Broken Arrow, OK | 3.0 | 2.0 | 1568 | $2,100 | $1.34 | 4d | 1 | 1.40mi |
| 1110 W Birmingham Pl Broken Arrow, OK | 3.0 | 2.0 | 1282 | $1,750 | $1.37 | 5d | 1 | 1.42mi |
| 6800 S 20th St Broken Arrow, OK | 3.0 | 2.0 | 1388 | $2,195 | $1.58 | 5d | 1 | 1.48mi |
Listing history 21 events
-
2026-03-23status Pending
-
2026-03-17$258,700 Active
-
2009-10-02soldstatus $140,000
-
2009-09-25soldstatus $140,000 265-char remark
Show marketing remark (265 chars)
4 Bedrm Updated, Mstr Down, Lots Of Updates Last Few Yrs. Paint In & Out, New Carpet, Wood Laminate In Family, Formal Liv & Dining. Ceramic, H/W Heater All New Lite Fixtures, Crown Molding & Fixtures. Huge Backyard! Room For Expansion. A Must See!
-
2009-08-18historical 265-char remark
Show marketing remark (265 chars)
4 Bedrm Updated, Mstr Down, Lots Of Updates Last Few Yrs. Paint In & Out, New Carpet, Wood Laminate In Family, Formal Liv & Dining. Ceramic, H/W Heater All New Lite Fixtures, Crown Molding & Fixtures. Huge Backyard! Room For Expansion. A Must See!
-
2009-06-15$149,900 265-char remark
Show marketing remark (265 chars)
4 Bedrm Updated, Mstr Down, Lots Of Updates Last Few Yrs. Paint In & Out, New Carpet, Wood Laminate In Family, Formal Liv & Dining. Ceramic, H/W Heater All New Lite Fixtures, Crown Molding & Fixtures. Huge Backyard! Room For Expansion. A Must See!
-
2002-02-06soldstatus $105,000
-
2002-01-25soldstatus $105,000 226-char remark
Show marketing remark (226 chars)
PC393 NEW CARPET 2000,NEW PAINT INT 2000,NEW WOOD BLINDS THROUGHOUT 2000,NEW GARAGE DOOR OPENER, NEW AC/HOT WATER HEEATER 2000,NEW KITCHEN COUNTERTOPS & APPLIANCES & FLOORING IN KITCHEN. SUBJECT TO LENDER APPROVAL.
-
2002-01-02historical 226-char remark
Show marketing remark (226 chars)
PC393 NEW CARPET 2000,NEW PAINT INT 2000,NEW WOOD BLINDS THROUGHOUT 2000,NEW GARAGE DOOR OPENER, NEW AC/HOT WATER HEEATER 2000,NEW KITCHEN COUNTERTOPS & APPLIANCES & FLOORING IN KITCHEN. SUBJECT TO LENDER APPROVAL.
-
2001-07-16$106,900 226-char remark
Show marketing remark (226 chars)
PC393 NEW CARPET 2000,NEW PAINT INT 2000,NEW WOOD BLINDS THROUGHOUT 2000,NEW GARAGE DOOR OPENER, NEW AC/HOT WATER HEEATER 2000,NEW KITCHEN COUNTERTOPS & APPLIANCES & FLOORING IN KITCHEN. SUBJECT TO LENDER APPROVAL.
-
2001-07-16historical
Show marketing remark (226 chars)
PC393 NEW CARPET 2000,NEW PAINT INT 2000,NEW WOOD BLINDS THROUGHOUT 2000,NEW GARAGE DOOR OPENER, NEW AC/HOT WATER HEEATER 2000,NEW KITCHEN COUNTERTOPS & APPLIANCES & FLOORING IN KITCHEN. SUBJECT TO LENDER APPROVAL.
-
2001-01-15$117,500
-
2000-11-10historical
-
2000-09-13$117,500
-
2000-07-11soldstatus $100,000
-
2000-06-30soldstatus $101,000
-
2000-06-19historical
-
2000-02-06$100,000
-
1999-03-17historical
-
1998-09-17$97,900
-
1990-10-09soldstatus $72,000
ⓘ Source: listings_history table (triggers on properties + properties_extension) + one-shot
backfill from property_details.listing_events for pre-trigger history.
Tax reassessment forecast OK · Resets to sale price
- Current annual tax
- $2,297 · $191/mo
- Projected year-2 tax
- $2,328 · $194/mo
- Expected delta
- +$31/yr (+$3/mo · 1.4%)
ⓘ Screening estimate from a state-policy table — verify with the county assessor before closing.
Climate risk First Street
- Flood 1/10 Low FEMA zone X (unshaded) · 0% chance over 30 yrs
- Wildfire 4/10 Moderate
- Heat 7/10 Severe 7 d/yr ≥111°F today · 18 d/yr by 30 yrs out
- Wind 3/10 Moderate 4% chance of damaging wind over 30 yrs
- Air quality 2/10 Low 1 unhealthy d/yr today · 1 by 30 yrs out
Nearby sold comps map
Loading sold comps map…
Walkable amenities ~0.75 mi
Loading nearby amenities…
Taxation est. · year 1
- Rental income
- $32,712
- − Mortgage interest
- −$14,491
- − Property taxes
- −$2,297
- − Insurance
- −$1,294
- − Repairs & maintenance
- −$2,617
- − Management
- −$2,617
- − Depreciation
- −$7,526
- Taxable income
- $1,871
- Est. tax owed @ 24.0%
- −$449
- After-tax cash flow
- $5,523/yr
For passive investors: Depreciation is non-cash, so a rental often shows a tax loss while cash-flowing — sheltering income. Rental losses are passive: they offset passive income freely, and up to $25,000/yr can offset ordinary (W-2) income if you actively participate and your MAGI is under $100k (phasing out to $0 by $150k); unused losses carry forward. On sale, claimed depreciation is recaptured at up to 25%, and gains may owe capital-gains tax (a 1031 exchange can defer both). Figures are a year-1 estimate at your 24.0% rate — not tax advice; consult a CPA.
Schools (NCES district)
- District
- Broken Arrow
- NCES district ID
- 4005490
- Math proficiency
- 23% ▼ -9.00%
- Reading proficiency
- 28% ▼ -9.00%
- Median HH income
- $64,646
- Composite
- 23.86/100
- National rank
- #7801
- State rank
- #79 of 270 in OK
Livability — Broken Arrow
- Score
- 78/100
- State rank
- #7
- US rank
- #2691
Category grades
Schools grade is shown separately in the Schools card above.
Census & demographics
- Census place
- Broken Arrow, OK
- County
- Tulsa County · 640,811 people
- City population
- 144,172
- Metro
- Tulsa, OK
- Population (ZIP)
- 33,900
- Household income
- $99,157
- Rent vs Own
- Severe rent burden
- 389.0
Population outlook (Tulsa County) Hauer SSP2
- Today (2025)
- 723,846 people
- By 2030
- 766,033 · +5.8%
- By 2040
- 851,386 · +17.6%
- By 2050
- 938,389 · +29.6%
- By 2075
- 1,166,011 · +61.1%
- By 2100
- 1,350,277 · +86.5%
Race, ethnicity, and origin ACS 2023
- Neighborhood character
- Predominantly White (68%)
- Race & ethnicity
- White 68% Two or more races 15% Hispanic / Latino 10% Native American 4% Black 4% Asian 3%
- Hispanic origin (detail)
- Mexican 7%
- Common ancestry
- Lithuanian 3% Serbian 2% Slovak 2%
- Foreign-born
- 5% · Canada
- Languages at home
- 93% English-only · Spanish 5% Other Asian/Pacific 1%
Political lean MEDSL · Tulsa
- 2024 margin
- R (+15.2) · D 41.3% · R 56.5% · Other 2.2%
- 2008→2024 swing
- +9.2pp toward D · 2008: -24.5pp · 2024: -15.2pp
- All cycles
- 2024: R+15.2 2020: R+15.6 2016: R+22.9 2012: R+27.4 2008: R+24.5
Not yet ingested
- Civics
- —
Market trends
- HPI YoY
- ▼ -180.15%
- Current HPI
- 210.8302
- Rent YoY
- ▲ 4.09%
- Metro
- Tulsa, OK
- State GDP YoY
- ▲ 1.55%
- F500 in state
- 6
Industry mix (Fortune 500 HQ in OK)
| Industry | F500 HQs | Revenue |
|---|---|---|
| Energy | 3 | $48B |
|
||
Price history
+259.3% since first listed21 events — show timeline
- 2026-03-23 Pending — MLS Technology, Inc.
- 2026-03-17 Listed $258,700 MLS Technology, Inc.
- 2009-10-02 Sold (Public Records) $140,000 Public Records
- 2009-09-25 Sold (MLS) $140,000 MLS Technology, Inc.
- 2009-08-18 Listing Removed — MLS Technology, Inc.
- 2009-06-15 Listed $149,900 MLS Technology, Inc.
- 2002-02-06 Sold (Public Records) $105,000 Public Records
- 2002-01-25 Sold (MLS) $105,000 MLS Technology, Inc.
- 2002-01-02 Listing Removed — MLS Technology, Inc.
- 2001-07-16 Listing Removed — MLS Technology, Inc.
- 2001-07-16 Listed $106,900 MLS Technology, Inc.
- 2001-01-15 Listed $117,500 MLS Technology, Inc.
- 2000-11-10 Listing Removed — MLS Technology, Inc.
- 2000-09-13 Listed $117,500 MLS Technology, Inc.
- 2000-07-11 Sold (Public Records) $100,000 Public Records
- 2000-06-30 Sold (MLS) $101,000 MLS Technology, Inc.
- 2000-06-19 Listing Removed — MLS Technology, Inc.
- 2000-02-06 Listed $100,000 MLS Technology, Inc.
- 1999-03-17 Listing Removed — MLS Technology, Inc.
- 1998-09-17 Listed $97,900 MLS Technology, Inc.
- 1990-10-09 Sold (Public Records) $72,000 Public Records
Property tax history
+1.8%/yrLatest (2025): $2,297 · +3.1% YoY. Source: county tax records.
Cash-flow waterfall
monthlySold comps — $/sqft
last 12 mo · ≤1 miLoading sold comps…