 🏢 Co-op
11055 SE Federal Hwy · Hobe Sound, FL
Flood risk 1/10 · Minimal
- FEMA flood zone
- X (unshaded)
- Chance of flooding over 30 yrs
- 0.0%
- Est. flood insurance / yr
- $507 – $1,088
Fire risk 4/10 · Minor
- Est. fire insurance / yr
- $947 – $1,759
Heat risk 10/10 · Severe
- Hot days now (above 105°F)
- 7 days/yr
- Hot days in 30 yrs
- 25 days/yr
Wind risk 10/10 · Severe
- Chance of severe wind over 30 yrs
- 99.0%
Air-quality risk 2/10 · Minimal
- Unhealthy air days now
- 1 days/yr
- Unhealthy air days in 30 yrs
- 2 days/yr
Risk factors via First Street. Map © Google.
Why this score? — see what drove the B+ grade
The composite is a weighted blend of 9 inputs, each scored 0–100. Each bar is that input's sub-score; the figure is the points it added to the 100-point composite (weight × sub-score).
- Cash flow +30.0/30.0
- ARV discount +15.0/15.0
- 1% rule +10.0/10.0
- DSCR +10.0/10.0
- Schools +4.5/10.0
- Livability +3.5/5.0
- Rent growth +3.0/5.0
- Condition / age +1.0/5.0
- Appreciation +0.0/10.0
$79,000
🖨 Deal sheet (PDF) 📄 Offer letter ✓ Due diligence
Listing remarks MLS
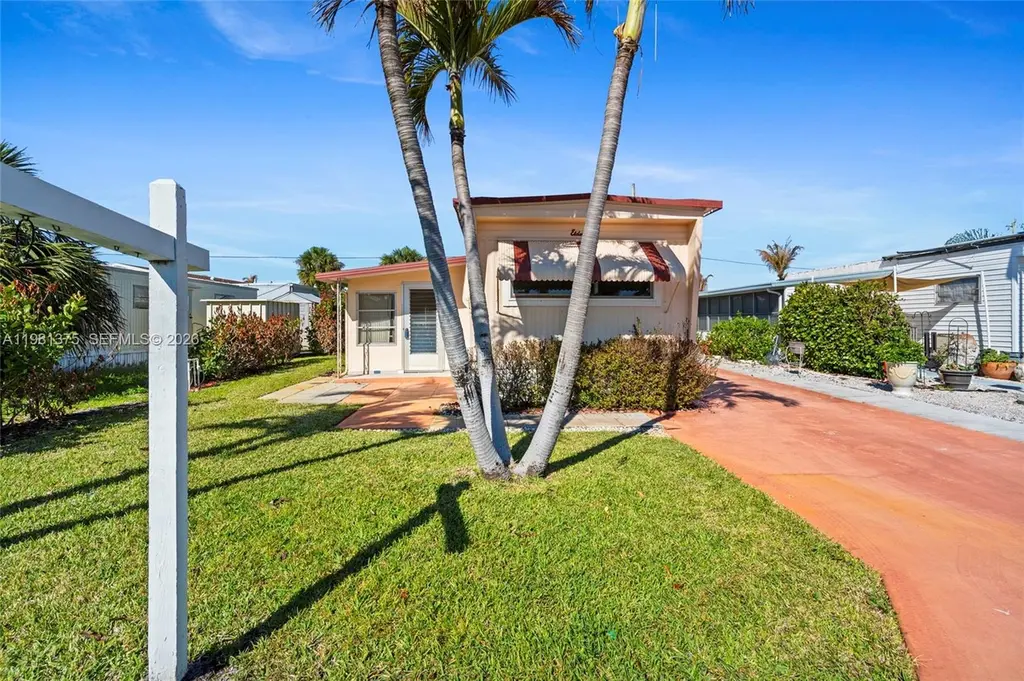
Welcome to easy Florida living in this charming 55 + coop community in beautiful Hobe Sound. Ideally located, the community is just minutes from shopping, dining, and everyday conveniences while still offering a peaceful atmosphere that makes Hobe Sound so special. Coastal destinations like Blowing Rocks, and Johnathan Dickinson State Park with hiking, kayaking and scenic trails. With beautiful beaches nearby, charming local shops, and the relaxed coastal lifestyle of the treasure coast, this community offers the perfect blend of recreation, convenience, and small town charm.
Key facts
- Upgraded floors
- Communal pool
- Newer roof
Tags
Neighborhood map
What this means for you Summary
Snapshot
- This is a 2-bed/1.0-bath manufactured listed at $79k. Condition is rated poor.
Deal economics
- At list price, monthly cash flow is $1k ($14k/yr) — positive.
- The deal already cash-flows at list — no discount required.
- Meets the 1% rule at list price ($2k rent vs $79k).
- Cap rate 24.6% vs local median 3.3% in Hobe Sound — top-decile yield for the area; either an underpriced asset or a hidden risk that comps aren't pricing in. Stress-test before assuming the spread holds.
Location & tenants
- Location reads 69/100 on livability (#497 in FL) — a middle-class / working-renter tenant base. Strengths: housing A+, crime A, cost of living A; Watch: employment C-, amenities F, commute F.
- Martin (suburban): math 52% / reading 53% proficiency, ranked #24 of 73 in FL (top 33%) — acceptable for families but not a draw, mixed tenant base, ~2y average lease.
- Market conditions: Rents rising (+1.8%/yr); 284 active listings in the ZIP; 2 comparable units currently listed for rent nearby; 737 units permitted in Martin County in 2024 (167 in 5+ unit buildings).
- This rent runs 38% of the median local income ($70k/yr) — at the standard rent-burdened threshold; future hikes will face affordability resistance.
Forward outlook
- Local home prices are declining (-3.0%/yr); year-one equity from $546 of loan paydown is wiped out by about $2k of value loss. Plan a longer hold.
- Martin County population projected at +19% by 2050 — long-run rental-demand tailwind backs the buy-and-hold thesis.
- At projected returns (-3.0% appreciation + 1.8% rent growth), your $22k cash investment doubles in ~2 years — after that, you're playing with house money.
Negotiation context
- Only 3 days on market — expect competitive offers; lowballing is unlikely to land.
- 18 sale attempts since 28y ago with the ask held roughly flat each time — persistent listings suggest the price (not the market) is what's stuck; bring a comps-based counter.
Risks & watch-outs
- Climate carrying-cost: severe wind risk, 99% chance of damaging wind over 30y; extreme-heat days projected 7→25/yr by 2055 (HVAC capex compounding) — expect insurance premiums to compound above CPI over the hold.
Questions for the listing agent
- Have any recent inspections been done? Can we get a copy of the seller's disclosures and any deferred-maintenance estimates?
- Built in 1971 — when were the roof, HVAC, electrical panel, plumbing, and water heater last replaced?
- Is there a deadline driving the sale (1031 exchange, divorce, estate, relocation)? That informs how much negotiation room exists.
- What's the average days-on-market for RENTAL listings here right now (not sales)? A rising rental-DOM trend means longer vacancies and softer asking-rent achievability than the comps imply.
- What's the recent tenant-quality profile in this submarket — average credit score on applications, eviction rate, late-payment / NSF rate, and stable-employment percentage? A property-management company in the area should have these aggregated.
- How much new for-sale + rental construction is in the pipeline within 1–3 miles? Heavy new supply typically softens prices + rents 12–24 months out; constrained supply supports both.
Investment metrics
- 1% rule
- 2.80% ✓
- Cap rate
- 24.56%
- Cash-on-cash
- 65.23%
- DSCR
- 3.90
- GRM
- 3.0
CMA / ARV
- ARV (median comp)
- $101,966
- List price
- $79,000
- Delta
- -11.83%
- Verdict
- UNDERPRICED
- Comps
- 6 within 1.0 mi
Show comp detail 1 sale within ~0.75 mi
| Address | Dist | Beds/Ba | Sqft | Sold | Price | $/sf | Match |
|---|---|---|---|---|---|---|---|
| 10885 SE Federal Hwy #55 | 0.25mi | 2/1.0 | 672 (-8%) | 15mo | $72,000 | $107 | 63 |
Match score weights: distance 35% · size 25% · config 20% · recency 20%. Top-matched comps best support the ARV.
Projected returns pro-forma
-3.0% appreciation · 1.8% rent growth · sell at horizon
- IRR
- 63.0%
- Equity multiple
- 3.77×
- Total profit
- $61,174
- Equity at exit
- $11,779
- IRR
- 67.1%
- Equity multiple
- 7.39×
- Total profit
- $141,440
- Equity at exit
- $6,830
Cash invested: $22,120 (down + closing). Projections, not guarantees.
Landlord ↔ Tenant lean methodology
- Overall (STATE)
- 87 Strongly Landlord-Friendly
- State Florida
- 87 Strongly Landlord-Friendly · R+3
- County
- — inherits STATE
- City
- — inherits STATE
ZIP-level market 33455
- Rents YoY
- 1.8%
- Active inventory
- 284
- Price-to-rent
- 3.0×
Monthly cashflow live
- Estimated rent
- $2,213 medium interval (Pro) →
- Mortgage (P&I)
- −$414
- Tax est. 1.5%
- −$99 /mo · $1,185/yr
- Insurance
- −$33
- HOA
- −$0
- Vacancy / Maint / Mgmt
- −$465
- Net cashflow
- $1,202
Break-even live
Sensitivity live
| Price | -10% $1,257 | -5% $1,230 | +0% $1,202 | +5% $1,175 | +10% $1,148 |
|---|---|---|---|---|---|
| Rent | -10% $1,028 | -5% $1,115 | +0% $1,202 | +5% $1,290 | +10% $1,377 |
| Rate | -1.0pp $1,242 | -0.5pp $1,223 | base $1,202 | +0.5pp $1,182 | +1.0pp $1,161 |
UW: 25.0% down · 7.5% · 30yr · 1.5% tax · 5.0% vac · 8.0% maint · 8.0% mgmt
Financing live
Cash to close
- Down payment
- $19,750
- Closing costs
- $2,370
- Reserves months
- —
- Total cash needed
- —
Loan-product check · same deal, 3 products live
Conventional
25% down · 7.5% · 30yr
- Down + closing
- —
- Monthly P&I
- —
- Monthly cashflow
- —
- DSCR
- —
- Eligible?
- —
Personal DTI + credit; lowest rate.
DSCR
20% down · 8.5% · 30yr
- Down + closing
- —
- Monthly P&I
- —
- Monthly cashflow
- —
- DSCR
- —
- Eligible?
- —
No personal income docs; deal must DSCR.
Hard money
10% down · 12.0% · 12mo
- Down + closing
- —
- Monthly P&I
- —
- Monthly cashflow
- —
- DSCR
- —
- Eligible?
- —
Short-term bridge; refi at stabilization.
Rent comps 2 comps
| Address | Beds | Baths | Sqft | Rent | $/sqft | DOM | Units | Dist |
|---|---|---|---|---|---|---|---|---|
| 10230 SE Federal Hwy Lot 13 Hobe Sound, FL | 1.0 | 1.0 | 700 | $1,250 | $1.79 | 24d | 1 | 0.81mi |
| 11810 SE Dixie Hwy Unit 1 Hobe Sound, FL | 1.0 | 1.0 | 403 | $2,000 | $4.96 | 24d | 1 | 0.94mi |
Listing history 46 events
-
2026-06-21days on market $79,000 Active 3 DOM
-
2026-06-19pricedays on market $79,000 Active 1 DOM
-
2026-03-16$89,900 Active 583-char remark
Show marketing remark (583 chars)
Welcome to easy Florida living in this charming 55 + coop community in beautiful Hobe Sound. Ideally located, the community is just minutes from shopping, dining, and everyday conveniences while still offering a peaceful atmosphere that makes Hobe Sound so special. Coastal destinations like Blowing Rocks, and Johnathan Dickinson State Park with hiking, kayaking and scenic trails. With beautiful beaches nearby, charming local shops, and the relaxed coastal lifestyle of the treasure coast, this community offers the perfect blend of recreation, convenience, and small town charm.
-
2019-11-12status Pending 295-char remark
Show marketing remark (295 chars)
Wood-bridge Cooperative 55+ community in Hobe Sound. Furnished pots pan TV everything (just being your teethbrush). Monthly fee of $195 includes cable, WIFI, water/sewer, trash, clubhouse, pool, shuffleboard. Minutes to the Hobe Sound Beach, shopping, restaurants. Sorry no dogs, no Motorcycles,
-
2018-10-18soldstatus $65,000 Closed 295-char remark
Show marketing remark (295 chars)
Wood-bridge Cooperative 55+ community in Hobe Sound. Furnished pots pan TV everything (just being your teethbrush). Monthly fee of $195 includes cable, WIFI, water/sewer, trash, clubhouse, pool, shuffleboard. Minutes to the Hobe Sound Beach, shopping, restaurants. Sorry no dogs, no Motorcycles,
-
2018-09-07historical Pending W/Cont 295-char remark
Show marketing remark (295 chars)
Wood-bridge Cooperative 55+ community in Hobe Sound. Furnished pots pan TV everything (just being your teethbrush). Monthly fee of $195 includes cable, WIFI, water/sewer, trash, clubhouse, pool, shuffleboard. Minutes to the Hobe Sound Beach, shopping, restaurants. Sorry no dogs, no Motorcycles,
-
2018-08-28$74,900 Active 295-char remark
Show marketing remark (295 chars)
Wood-bridge Cooperative 55+ community in Hobe Sound. Furnished pots pan TV everything (just being your teethbrush). Monthly fee of $195 includes cable, WIFI, water/sewer, trash, clubhouse, pool, shuffleboard. Minutes to the Hobe Sound Beach, shopping, restaurants. Sorry no dogs, no Motorcycles,
-
2016-06-26historical
-
2016-06-26historical
-
2016-06-26historical
-
2016-01-11price $28,000
-
2016-01-11price $15,000
-
2015-04-30soldstatus $26,900 Closed
-
2015-04-11price $29,900
-
2015-04-11price $27,900
-
2015-03-29historical
-
2015-03-19$36,000 Active
-
2015-02-20historical
-
2015-01-16$18,000
-
2014-11-12historical
-
2014-09-28$22,500
-
2014-08-01soldstatus $28,000
-
2014-08-01price $30,900
-
2014-02-19$30,900
-
2013-11-11$47,900
-
2012-11-30price $20,000
-
2012-11-30soldstatus $15,000
-
2012-05-17$20,000
-
2011-02-11historical
-
2010-08-10$65,000
-
2009-06-19soldstatus $33,000
-
2009-06-19price $44,500
-
2009-01-09soldstatus $60,000
-
2009-01-09price $69,500
-
2008-12-04$33,000
-
2008-07-14$60,000
-
2007-08-16soldstatus $22,000
-
2007-07-23$49,900
-
2007-07-17historical
-
2007-06-27historical
-
2007-06-18$24,900
-
2007-04-23$115,000
-
2006-11-27$160,000
-
2005-11-07$29,500
-
1999-03-31historical
-
1998-03-23$9,500
ⓘ Source: listings_history table (triggers on properties + properties_extension) + one-shot
backfill from property_details.listing_events for pre-trigger history.
Climate risk First Street
- Flood 1/10 Low FEMA zone X (unshaded) · 0% chance over 30 yrs
- Wildfire 4/10 Moderate
- Heat 10/10 Extreme 7 d/yr ≥105°F today · 25 d/yr by 30 yrs out
- Wind 10/10 Extreme 99% chance of damaging wind over 30 yrs
- Air quality 2/10 Low 1 unhealthy d/yr today · 2 by 30 yrs out
Nearby sold comps map
Loading sold comps map…
Walkable amenities ~0.75 mi
Loading nearby amenities…
Taxation est. · year 1
- Rental income
- $26,558
- − Mortgage interest
- −$4,425
- − Property taxes
- −$1,185
- − Insurance
- −$395
- − Repairs & maintenance
- −$2,125
- − Management
- −$2,125
- − Depreciation
- −$2,298
- Taxable income
- $14,005
- Est. tax owed @ 24.0%
- −$3,361
- After-tax cash flow
- $11,068/yr
For passive investors: Depreciation is non-cash, so a rental often shows a tax loss while cash-flowing — sheltering income. Rental losses are passive: they offset passive income freely, and up to $25,000/yr can offset ordinary (W-2) income if you actively participate and your MAGI is under $100k (phasing out to $0 by $150k); unused losses carry forward. On sale, claimed depreciation is recaptured at up to 25%, and gains may owe capital-gains tax (a 1031 exchange can defer both). Figures are a year-1 estimate at your 24.0% rate — not tax advice; consult a CPA.
Condition & rehab AI · 2 photos
This manufactured home requires extensive repairs and maintenance, including roof replacement and exterior painting, to improve its condition and value.
Repairs flagged
- Major roof — Signs of wear and potential leaks
- Major exterior siding — Worn and peeling
- Major landscaping — Overgrown and unkempt
Value-add opportunities
- Both landscaping — Improves curb appeal and property value
- Both paint exterior — Enhances curb appeal and property value
- Both repair roof — Prevents water damage and extends home's lifespan
Renovation cost estimate screening
| Repair item | Severity | Est. cost |
|---|---|---|
| roof · Signs of wear and potential leaks | Major | $15,000–50,000 |
| exterior siding · Worn and peeling | Major | $15,000–50,000 |
| landscaping · Overgrown and unkempt | Major | $15,000–50,000 |
| Total estimated repair cost · 3 items | $45,000–150,000 |
Value-add ROI direction
- Both landscaping — Improves curb appeal and property value ↑
- Both paint exterior — Enhances curb appeal and property value ↑
- Both repair roof — Prevents water damage and extends home's lifespan ↑
ⓘ Cost ranges are severity-bucket heuristics (US national rule-of-thumb). Get contractor quotes + a written scope before underwriting a rehab budget.
Schools (NCES district)
- District
- Martin
- NCES district ID
- 1201290
- Math proficiency
- 52% ▼ -14.00%
- Reading proficiency
- 53% ▼ -4.00%
- Median HH income
- $52,482
- Composite
- 45.1/100
- National rank
- #2690
- State rank
- #24 of 73 in FL
Livability — Hobe Sound
- Score
- 69/100
- State rank
- #497
- US rank
- #8763
Category grades
Schools grade is shown separately in the Schools card above.
Census & demographics
- Census place
- Hobe Sound, FL
- County
- Martin County · 165,223 people
- City population
- 20,018
- Metro
- Port St. Lucie, FL
- Population (ZIP)
- 20,018
- Household income
- $70,389
- Rent vs Own
- Severe rent burden
- 317.0
Population outlook (Martin County) Hauer SSP2
- Today (2025)
- 172,383 people
- By 2030
- 180,192 · +4.5%
- By 2040
- 194,114 · +12.6%
- By 2050
- 204,992 · +18.9%
- By 2075
- 229,641 · +33.2%
- By 2100
- 232,146 · +34.7%
Race, ethnicity, and origin ACS 2023
- Neighborhood character
- Predominantly White (84%)
- Race & ethnicity
- White 84% Hispanic / Latino 8% Two or more races 6% Black 5% Asian 1%
- Hispanic origin (detail)
- Mexican 3% Dominican 1%
- Common ancestry
- Romanian 5% Italian 2% Slovak 2%
- Foreign-born
- 8% · Canada
- Languages at home
- 91% English-only · Spanish 6% Other Indo-European 1%
Political lean MEDSL · Martin
- 2024 margin
- Solid R (+31.1) · D 34.1% · R 65.2%
- 2008→2024 swing
- -17.5pp toward R · 2008: -13.6pp · 2024: -31.1pp
- All cycles
- 2024: R+31.1 2020: R+24.6 2016: R+26.9 2012: R+22.9 2008: R+13.6
Not yet ingested
- Civics
- —
Market trends
- HPI YoY
- ▼ -287.05%
- Current HPI
- 356.7273
- Rent YoY
- ▲ 1.80%
- Metro
- Port St. Lucie, FL
- State GDP YoY
- ▲ 3.28%
- F500 in state
- 36
Industry mix (Fortune 500 HQ in FL)
| Industry | F500 HQs | Revenue |
|---|---|---|
| Industrial Technology | 2 | $29B |
|
||
| Insurance | 2 | $17B |
|
||
| Retail | 1 | $60B |
|
||
| Technology Distribution | 1 | $58B |
|
||
| Homebuilding | 1 | $35B |
|
||
| Technology Manufacturing | 1 | $35B |
|
||
Price history
+731.6% since first listed47 events — show timeline
- 2026-06-19 Listed $79,000 FSBO.com
- 2026-05-28 Contingent — MARMLS
- 2026-05-19 Sold (MLS) $73,000 MARMLS
- 2026-03-16 Listed $89,900 MARMLS
- 2019-11-12 Pending — MCRTC
- 2018-10-18 Sold (MLS) $65,000 MCRTC
- 2018-09-07 Contingent — MCRTC
- 2018-08-28 Listed $74,900 MCRTC
- 2016-06-26 Listing Removed — MCRTC
- 2016-06-26 Listing Removed — MCRTC
- 2016-06-26 Listing Removed — MCRTC
- 2016-01-11 Price Changed $15,000 MCRTC
- 2016-01-11 Price Changed $28,000 MCRTC
- 2015-04-30 Sold (MLS) $26,900 Beaches MLS
- 2015-04-11 Price Changed $27,900 Beaches MLS
- 2015-04-11 Price Changed $29,900 Beaches MLS
- 2015-03-29 Listing Removed — MCRTC
- 2015-03-19 Listed $36,000 Beaches MLS
- 2015-02-20 Listing Removed — MCRTC
- 2015-01-16 Listed $18,000 MCRTC
- 2014-11-12 Listing Removed — MCRTC
- 2014-09-28 Listed $22,500 MCRTC
- 2014-08-01 Price Changed $30,900 MCRTC
- 2014-08-01 Sold (MLS) $28,000 MCRTC
- 2014-02-19 Listed $30,900 MCRTC
- 2013-11-11 Listed $47,900 MCRTC
- 2012-11-30 Sold (MLS) $15,000 MCRTC
- 2012-11-30 Price Changed $20,000 MCRTC
- 2012-05-17 Listed $20,000 MCRTC
- 2011-02-11 Listing Removed — MCRTC
- 2010-08-10 Listed $65,000 MCRTC
- 2009-06-19 Price Changed $44,500 MCRTC
- 2009-06-19 Sold (MLS) $33,000 MCRTC
- 2009-01-09 Sold (MLS) $60,000 MCRTC
- 2009-01-09 Price Changed $69,500 MCRTC
- 2008-12-04 Listed $33,000 MCRTC
- 2008-07-14 Listed $60,000 MCRTC
- 2007-08-16 Sold (MLS) $22,000 Beaches MLS
- 2007-07-23 Listed $49,900 MCRTC
- 2007-07-17 Listing Removed — Beaches MLS
- 2007-06-27 Listing Removed — MCRTC
- 2007-06-18 Listed $24,900 Beaches MLS
- 2007-04-23 Listed $115,000 MCRTC
- 2006-11-27 Listed $160,000 MCRTC
- 2005-11-07 Listed $29,500 MCRTC
- 1999-03-31 Listing Removed — MCRTC
- 1998-03-23 Listed $9,500 MCRTC
Cash-flow waterfall
monthlySold comps — $/sqft
last 12 mo · ≤1 miLoading sold comps…