 🏗️ New Construction
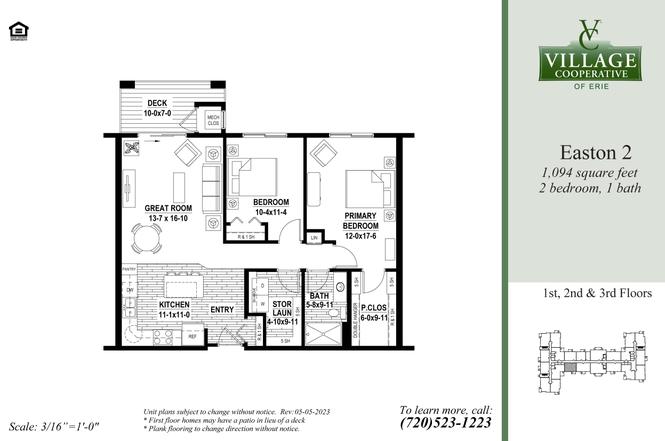
Easton-2 Plan · Erie, CO
Flood risk 1/10 · Minimal
- FEMA flood zone
- X (unshaded)
- Chance of flooding over 30 yrs
- 0.0%
- Est. flood insurance / yr
- $507 – $1,088
Fire risk 5/10 · Moderate
- Est. fire insurance / yr
- $939 – $1,743
Heat risk 3/10 · Minor
- Hot days now (above 92°F)
- 7 days/yr
- Hot days in 30 yrs
- 18 days/yr
Wind risk 2/10 · Minimal
- Chance of severe wind over 30 yrs
- —
Air-quality risk 4/10 · Minor
- Unhealthy air days now
- 6 days/yr
- Unhealthy air days in 30 yrs
- 7 days/yr
Risk factors via First Street. Map © Google.
Why this score? — see what drove the F grade
The composite is a weighted blend of 9 inputs, each scored 0–100. Each bar is that input's sub-score; the figure is the points it added to the 100-point composite (weight × sub-score).
- Cash flow +8.3/30.0
- ARV discount +7.5/15.0
- Schools +3.8/10.0
- Livability +3.7/5.0
- 1% rule +2.6/10.0
- Condition / age +2.5/5.0
- DSCR +2.2/10.0
- Rent growth +1.9/5.0
- Appreciation +0.0/10.0
$222,000
🖨 Deal sheet 📄 Offer letter ✓ Due diligence
Listing remarks
The Village Cooperative of Erie is UNDER CONSTRUCTION to give active seniors (62+) a fabulous home ownership option in this beautiful area! The city of Erie offers a progressive civic vision with a genuine small-town feel which makes it the perfect location for our newest Village Cooperative in Colorado. You will be able to live the lifestyle you've earned as you enjoy all the benefits of ownership without any of the maintenance hassles in this wonderful community that offers all the recreation and amenities to enjoy whether you are working or retired. You simply won't find a better value anywhere in the area with all the amenities. It offers a carefree lifestyle that lets you enjoy more of
Key facts
- Reading areas
- Hobby shop
- Unique amenities
Tags
Property features AI
Finance
- Financial info: List price $222,000
Exterior
- Home design: Easton-2 plan; New construction (Plan)
- Construction: Built in 2026
- Exterior features: Located in Village Vis community, Erie CO
Interior
- Bedrooms: 2 bedrooms
- Bathrooms: 1 full bathroom
- Interior features: Open living area
Neighborhood map
What this means for you Summary
Snapshot
- This is a 2-bed/1.0-bath townhouse listed at $222k.
Deal economics
- At list price, monthly cash flow is $-296 ($-4k/yr) — negative.
- The deal already cash-flows at list — no discount required.
- Meets the 1% rule at list price ($2k rent vs $222k).
- Recommended offer: $195k (12.0% below list) — sets the bar for market timing.
- Cap rate 5.2% vs local median 2.9% in Erie — top-decile yield for the area; either an underpriced asset or a hidden risk that comps aren't pricing in. Stress-test before assuming the spread holds.
Location & tenants
- Location reads 73/100 on livability (#46 in CO) — a middle-class / working-renter tenant base. Strengths: crime A+, employment A+, housing A+; Watch: amenities F, commute F, cost of living F.
- St. Vrain Valley School District No. Re1J (suburban): math 32% / reading 51% proficiency, ranked #23 of 86 in CO (top 27%) — families likely to look elsewhere, expect single-tenant / working-renter base with shorter leases.
- Market conditions: Rents soft (-2.5%/yr); 348 active listings in the ZIP; 9 comparable units currently listed for rent nearby; rentals leasing fast (median 3d on market — plan ~1-2 weeks tenant-placement turnaround); high-income renter base; 3,170 units permitted in Weld County in 2024 (278 in 5+ unit buildings).
- This rent is only 17% of the median local income ($169k/yr) — well below the 30% rent-burden line; pricing power to push rent on renewal without tenant pushback.
Forward outlook
- Local home prices are declining (-3.0%/yr); year-one equity from $2k of loan paydown is wiped out by about $10k of value loss. Plan a longer hold.
- Weld County population projected at +46% by 2050 — long-run rental-demand tailwind backs the buy-and-hold thesis.
Negotiation context
- It's been on market 141 days — a 12% lower offer ($195k) is reasonable based on typical stale-listing flexibility.
Risks & watch-outs
- Climate carrying-cost: moderate wildfire risk — expect insurance premiums to compound above CPI over the hold.
Questions for the listing agent
- What do current leases actually rent for vs. the listed asking? Can we see a recent rent roll and the last 12 months of T-12 income?
- It's been on market 141 days. Have you received any prior offers? Is the seller open to a 12% concession, seller financing, or rate buy-down credit?
- Why hasn't it sold? Are there any deal-killer items the seller is aware of (foundation, flood, title, zoning, code violations)?
- Is there a deadline driving the sale (1031 exchange, divorce, estate, relocation)? That informs how much negotiation room exists.
- Schools are B-rated — typically a magnet for longer-tenancy family renters. What's the average tenant stay here, and is there a school-zone premium baked into asking?
- The area grade is low — what's the realistic commute time and amenity access for the typical tenant pool here? Any planned neighborhood developments (good or bad) we should know about?
- What's the average days-on-market for RENTAL listings here right now (not sales)? A rising rental-DOM trend means longer vacancies and softer asking-rent achievability than the comps imply.
- What's the recent tenant-quality profile in this submarket — average credit score on applications, eviction rate, late-payment / NSF rate, and stable-employment percentage? A property-management company in the area should have these aggregated.
- How much new for-sale + rental construction is in the pipeline within 1–3 miles? Heavy new supply typically softens prices + rents 12–24 months out; constrained supply supports both.
Investment metrics
- 1% rule
- 0.76% ✗
- Cap rate
- 5.19%
- Cash-on-cash
- -3.94%
- DSCR
- 0.82
- GRM
- 11.0
CMA / ARV
- ARV (on-the-fly)
- $321,636
- Comps found
- 12
Show comp detail 12 sales within ~0.75 mi
| Address | Dist | Beds/Ba | Sqft | Sold | Price | $/sf | Match |
|---|---|---|---|---|---|---|---|
| 2985 Blue Sky Cir Unit 7-304 | 0.62mi | 2/2.0 | 1,156 (+6%) | 1mo | $317,000 | $274 | 57 |
| 3095 Blue Sky Cir Unit 13-203 | 0.56mi | 2/2.0 | 1,156 (+6%) | 6mo | $325,000 | $281 | 55 |
| 3155 Blue Sky Cir #104 | 0.54mi | 2/2.0 | 1,156 (+6%) | 8mo | $360,000 | $311 | 54 |
| 1425 Blue Sky Cir Unit 15-105 | 0.64mi | 2/2.0 | 1,156 (+6%) | 4mo | $328,000 | $284 | 54 |
| 3155 Blue Sky Cir Unit 16-103 | 0.54mi | 2/2.0 | 1,156 (+6%) | 11mo | $320,000 | $277 | 52 |
| 3100 Blue Sky Cir #205 | 0.59mi | 2/2.0 | 1,156 (+6%) | 9mo | $295,000 | $255 | 51 |
| 3095 Blue Sky Cir #305 | 0.56mi | 2/2.0 | 1,156 (+6%) | 11mo | $340,000 | $294 | 51 |
| 2900 Blue Sky Cir Unit 5-103 | 0.67mi | 2/1.0 | 1,002 (-8%) | 7mo | $307,000 | $306 | 49 |
| 3045 Blue Sky Cir #105 | 0.70mi | 2/— | 1,156 (+6%) | 11mo | $343,423 | $297 | 49 |
| 2875 Blue Sky Cir Unit 4-303 | 0.65mi | 2/2.0 | 1,156 (+6%) | 13mo | $338,000 | $292 | 46 |
| 2985 Blue Sky Cir Unit 7-203 | 0.62mi | 2/2.0 | 1,156 (+6%) | 15mo | $340,000 | $294 | 45 |
| 2800 Blue Sky Cir Unit 2-206 | 0.69mi | 2/1.0 | 1,002 (-8%) | 15mo | $311,000 | $310 | 41 |
Match score weights: distance 35% · size 25% · config 20% · recency 20%. Top-matched comps best support the ARV.
Projected returns pro-forma
-3.0% appreciation · 0.0% rent growth · sell at horizon
- IRR
- -26.3%
- Equity multiple
- 0.13×
- Total profit
- $-78,073
- Equity at exit
- $47,957
- IRR
- -37.7%
- Equity multiple
- -0.33×
- Total profit
- $-119,723
- Equity at exit
- $27,809
Cash invested: $90,058 (down + closing). Projections, not guarantees.
Landlord ↔ Tenant lean methodology
- Overall (STATE)
- 38 Tenant-Leaning
- State Colorado
- 38 Tenant-Leaning · D+4
- County
- — inherits STATE
- City
- — inherits STATE
ZIP-level market 80516
- Rents YoY
- -2.5%
- Active inventory
- 348
- Price-to-rent
- 7.6×
Monthly cashflow live
- Estimated rent
- $2,439 high interval (Pro) →
- Mortgage (P&I)
- −$1,687
- Tax est. 1.5%
- −$402 /mo · $4,825/yr
- Insurance
- −$134
- HOA
- −$0
- Vacancy / Maint / Mgmt
- −$512
- Net cashflow
- $-296
Break-even live
UW: 25.0% down · 7.5% · 30yr · 1.5% tax · 5.0% vac · 8.0% maint · 8.0% mgmt
Financing live
Cash to close
- Down payment
- $80,409
- Closing costs
- $9,649
- Reserves months
- —
- Total cash needed
- —
Loan-product check · same deal, 3 products live
Conventional
25% down · 7.5% · 30yr
- Down + closing
- —
- Monthly P&I
- —
- Monthly cashflow
- —
- DSCR
- —
- Eligible?
- —
Personal DTI + credit; lowest rate.
DSCR
20% down · 8.5% · 30yr
- Down + closing
- —
- Monthly P&I
- —
- Monthly cashflow
- —
- DSCR
- —
- Eligible?
- —
No personal income docs; deal must DSCR.
Hard money
10% down · 12.0% · 12mo
- Down + closing
- —
- Monthly P&I
- —
- Monthly cashflow
- —
- DSCR
- —
- Eligible?
- —
Short-term bridge; refi at stabilization.
Rent comps 9 comps
| Address | Beds | Baths | Sqft | Rent | $/sqft | DOM | Units | Dist |
|---|---|---|---|---|---|---|---|---|
| 2802 Ridge View Cir Erie, CO | 2.0–3.0 | 2.0–3.0 | 1595 | $2,394 | $1.50 | 4d | 2 | 0.14mi |
| 16785 Sheridan Pkwy Broomfield, CO | 3.0 | 1.0–2.0 | 996 | $2,445 | $2.45 | 1d | 35 | 0.43mi |
| 3035 Blue Sky Cir Unit 10-105 Erie, CO | 2.0 | 2.0 | 1156 | $1,995 | $1.73 | 20d | 1 | 0.61mi |
| 1752 W 167th Ave Broomfield, CO | 1.0–3.0 | 1.0–2.0 | 1109 | $2,582 | $2.33 | 2d | 27 | 0.70mi |
| 3045 Blue Sky Cir Unit 18-202 Erie, CO | 2.0 | 2.0 | 1259 | $2,000 | $1.59 | 13d | 1 | 0.72mi |
| 16600 Peak St Broomfield, CO | 2.0–3.0 | 2.5–3.5 | 1357 | $2,904 | $2.14 | 1d | 19 | 0.76mi |
| 1151 Spring Pl Broomfield, CO | 3.0 | 1.0–2.0 | 922 | $2,387 | $2.59 | 2d | 101 | 0.89mi |
| 16893 Palisade Loop Broomfield, CO | 1.0–3.0 | 1.0–3.5 | 1173 | $2,335 | $1.99 | 1d | 27 | 1.22mi |
| 16815 Huron St Broomfield, CO | 1.0–2.0 | 1.0–2.0 | 912 | $2,088 | $2.29 | 13d | 23 | 1.47mi |
Listing history 13 events
-
2026-06-18days on market $222,000 Active 141 DOM
-
2026-06-17days on market $222,000 Active 140 DOM
-
2026-06-16days on market $222,000 Active 139 DOM
-
2026-06-15days on market $222,000 Active 138 DOM
-
2026-06-14days on market $222,000 Active 136 DOM
-
2026-06-13days on market $222,000 Active 135 DOM
-
2026-06-09days on market $222,000 Active 132 DOM
-
2026-06-09days on market $222,000 Active 131 DOM
-
2026-06-07days on market $222,000 Active 130 DOM
-
2026-06-02days on market $222,000 Active 125 DOM
-
2026-06-01days on market $222,000 Active 124 DOM
-
2026-05-31days on market $222,000 Active 123 DOM
-
2026-05-30days on market $222,000 Active 122 DOM
ⓘ Source: listings_history table (triggers on properties + properties_extension) + one-shot
backfill from property_details.listing_events for pre-trigger history.
Climate risk First Street
- Flood 1/10 Low FEMA zone X (unshaded) · 0% chance over 30 yrs
- Wildfire 5/10 Major
- Heat 3/10 Moderate 7 d/yr ≥92°F today · 18 d/yr by 30 yrs out
- Wind 2/10 Low
- Air quality 4/10 Moderate 6 unhealthy d/yr today · 7 by 30 yrs out
Nearby sold comps map
Loading sold comps map…
Walkable amenities ~0.75 mi
Loading nearby amenities…
Taxation est. · year 1
- Rental income
- $29,269
- − Mortgage interest
- −$18,017
- − Property taxes
- −$4,825
- − Insurance
- −$1,608
- − Repairs & maintenance
- −$2,342
- − Management
- −$2,342
- − Depreciation
- −$9,357
- Taxable loss
- −$9,220
- Est. tax savings @ 24.0%
- +$2,213
- After-tax cash flow
- $-1,337/yr
For passive investors: Depreciation is non-cash, so a rental often shows a tax loss while cash-flowing — sheltering income. Rental losses are passive: they offset passive income freely, and up to $25,000/yr can offset ordinary (W-2) income if you actively participate and your MAGI is under $100k (phasing out to $0 by $150k); unused losses carry forward. On sale, claimed depreciation is recaptured at up to 25%, and gains may owe capital-gains tax (a 1031 exchange can defer both). Figures are a year-1 estimate at your 24.0% rate — not tax advice; consult a CPA.
Schools (NCES district)
- District
- St. Vrain Valley School District No. Re1J
- NCES district ID
- 0805370
- Math proficiency
- 32% ▼ -8.00%
- Reading proficiency
- 51% ▬ 0.00%
- Median HH income
- $71,571
- Composite
- 37.73/100
- National rank
- #4353
- State rank
- #23 of 86 in CO
Livability — Erie
- Score
- 73/100
- State rank
- #46
- US rank
- #5110
Category grades
Schools grade is shown separately in the Schools card above.
Census & demographics
- Census place
- Erie, CO
- County
- Weld County · 332,652 people
- City population
- 39,048
- Metro
- Greeley, CO
- Population (ZIP)
- 39,048
- Household income
- $168,725
- Rent vs Own
- Severe rent burden
- 355.0
Population outlook (Weld County) Hauer SSP2
- Today (2025)
- 351,957 people
- By 2030
- 385,304 · +9.5%
- By 2040
- 451,818 · +28.4%
- By 2050
- 514,478 · +46.2%
- By 2075
- 648,733 · +84.3%
- By 2100
- 720,400 · +104.7%
Race, ethnicity, and origin ACS 2023
- Neighborhood character
- Predominantly White (77%)
- Race & ethnicity
- White 77% Hispanic / Latino 11% Two or more races 10% Asian 6%
- Hispanic origin (detail)
- Mexican 7%
- Common ancestry
- Italian 4% Slovak 3% Romanian 3%
- Foreign-born
- 8% · Canada, China, Vietnam
- Languages at home
- 90% English-only · Spanish 3% Other Indo-European 2% Other Asian/Pacific 1%
Political lean MEDSL · Weld
- 2024 margin
- Strong R (+21.0) · D 38.2% · R 59.2% · Other 2.6%
- 2008→2024 swing
- -12.2pp toward R · 2008: -8.7pp · 2024: -21.0pp
- All cycles
- 2024: R+21.0 2020: R+18.0 2016: R+22.4 2012: R+13.2 2008: R+8.7
Not yet ingested
- Civics
- —
Market trends
- HPI YoY
- ▼ -170.34%
- Current HPI
- 242.1832
- Rent YoY
- ▼ -2.48%
- Metro
- Greeley, CO
- State GDP YoY
- ▲ 1.95%
- F500 in state
- 14
Industry mix (Fortune 500 HQ in CO)
| Industry | F500 HQs | Revenue |
|---|---|---|
| Technology Distribution | 1 | $31B |
|
||
| Food / Agriculture | 1 | $18B |
|
||
| Packaging | 1 | $14B |
|
||
| Healthcare | 1 | $13B |
|
||
| Energy | 1 | $10B |
|
||
| Technology | 1 | $4B |
|
||
Cash-flow waterfall
monthlySold comps — $/sqft
last 12 mo · ≤1 miLoading sold comps…