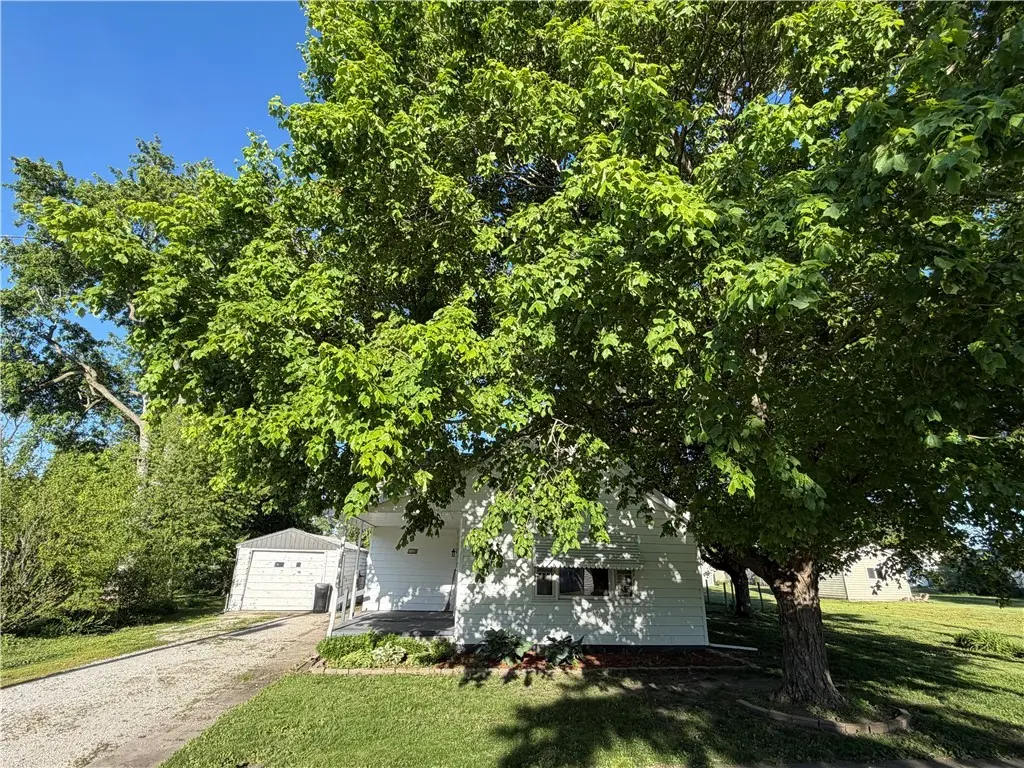
105 Wabash Ave · Catlin, IL
Flood risk No data
- FEMA flood zone
- —
- Chance of flooding over 30 yrs
- —
- Est. flood insurance / yr
- —
Fire risk No data
- Est. fire insurance / yr
- —
Heat risk No data
- Hot days now (above threshold)
- —
- Hot days in 30 yrs
- —
Wind risk No data
- Chance of severe wind over 30 yrs
- —
Air-quality risk No data
- Unhealthy air days now
- —
- Unhealthy air days in 30 yrs
- —
Risk factors via First Street. Map © Google.
Why this score? — see what drove the C+ grade
The composite is a weighted blend of 9 inputs, each scored 0–100. Each bar is that input's sub-score; the figure is the points it added to the 100-point composite (weight × sub-score).
- Cash flow +15.4/30.0
- ARV discount +15.0/15.0
- Appreciation +10.0/10.0
- Schools +5.0/10.0
- DSCR +4.7/10.0
- 1% rule +4.2/10.0
- Livability +3.4/5.0
- Rent growth +2.5/5.0
- Condition / age +2.5/5.0
$105,000
🖨 Deal sheet 📄 Offer letter ✓ Due diligence
Listing remarks MLS
Take a look at this 2 bedroom, 1 bath home in Catlin! This home sits on a double lot, within walking distance to the park. The interior offers a spacious living and dinning area and, an open kitchen layout. The yard is perfect for gardening and/or entertaining. Available for showings today. Give me a call!
Key facts
- 9,583 sq ft lot
- Garage
- Built 1920
Property features AI
Exterior
- Parking: Detached garage (1 car)
- Utilities: Public water; Public sewer
- Home design: Single-family residence; One story
- Construction: Built with other construction materials
- Exterior features: Shingle roof; Gravel road access; Lot approximately 0.22 acres; Residential zoning
Interior
- Kitchen: Range; Dishwasher; Refrigerator
- Bathrooms: 1 full bathroom
- Heating & cooling: Natural gas heating with forced air; Central air conditioning
- Interior features: Dryer; Dishwasher; Gas water heater; Range; Refrigerator; Washer; Crawl space basement
- Laundry & utility: Laundry on main level; Dryer; Washer
Neighborhood map
What this means for you Summary
Snapshot
- This is a 2-bed/1.0-bath single-family listed at $105k.
Deal economics
- At list price, monthly cash flow is $40 ($478/yr) — positive.
- The deal already cash-flows at list — no discount required.
- To meet the 1% rule (rent ≥ 1% of price), the offer needs to be $97k (8.0% below list).
- Recommended offer: $97k (8.0% below list) — sets the bar for 1% rule.
Location & tenants
- Location reads 67/100 on livability (#522 in IL) — a middle-class / working-renter tenant base. Strengths: crime A+, cost of living A+, housing A+; Watch: schools D+, amenities F, commute F.
- Market conditions: 14 active listings in the ZIP; 3 comparable units currently listed for rent nearby; rentals leasing fast (median 3d on market — plan ~1-2 weeks tenant-placement turnaround); 8 units permitted in Vermilion County in 2024 (0 in 5+ unit buildings).
Forward outlook
- In year one you build about $11k of equity ($726 loan paydown + $10k appreciation (10.0% local appreciation)).
- Vermilion County population projected at -24% by 2050 — secular population decline; favor cash flow + early exit over multi-decade hold.
- At projected returns (10.0% appreciation + 3.0% rent growth), your $29k cash investment doubles in ~3 years — after that, you're playing with house money.
- By year 4, paydown + projected appreciation supports a ~$40k cash-out refi (75% LTV) — recoverable capital for the next deal without selling this one.
Negotiation context
- It's been on market 21 days — a 2% lower offer ($103k) is reasonable based on typical stale-listing flexibility.
- 3 sale attempts since 5y ago with the ask held roughly flat each time — persistent listings suggest the price (not the market) is what's stuck; bring a comps-based counter.
- Current owner paid $58k; list at $105k implies a 79% gain — meaningful room to come down on a strong offer.
Risks & watch-outs
- Watch-outs: built in 1920 — expect roof / HVAC / electrical / plumbing capex.
Questions for the listing agent
- Built in 1920 — when were the roof, HVAC, electrical panel, plumbing, and water heater last replaced?
- Is there a deadline driving the sale (1031 exchange, divorce, estate, relocation)? That informs how much negotiation room exists.
- Schools are D-rated, which usually means shorter tenancies and higher turnover. Who's the typical renter profile here, and what's been the actual vacancy rate?
- What's the average days-on-market for RENTAL listings here right now (not sales)? A rising rental-DOM trend means longer vacancies and softer asking-rent achievability than the comps imply.
- What's the recent tenant-quality profile in this submarket — average credit score on applications, eviction rate, late-payment / NSF rate, and stable-employment percentage? A property-management company in the area should have these aggregated.
- How much new for-sale + rental construction is in the pipeline within 1–3 miles? Heavy new supply typically softens prices + rents 12–24 months out; constrained supply supports both.
Investment metrics
- 1% rule
- 0.92% ✗
- Cap rate
- 6.75%
- Cash-on-cash
- 1.62%
- DSCR
- 1.07
- GRM
- 9.1
CMA / ARV
- ARV (on-the-fly)
- $137,500
- Comps found
- 8
Show comp detail 8 sales within ~0.75 mi
| Address | Dist | Beds/Ba | Sqft | Sold | Price | $/sf | Match |
|---|---|---|---|---|---|---|---|
| 404 Merrill St | 0.31mi | 3/1.0 (+1) | 1,057 (-4%) | 5mo | $132,000 | $125 | 70 |
| 700 S Sandusky St | 0.29mi | 3/1.5 (+1) | 1,040 (-6%) | 20mo | $115,000 | $111 | 54 |
| 102 State St | 0.27mi | 3/1.0 (+1) | 950 (-14%) | 7mo | $121,800 | $128 | 54 |
| 103 W Center St | 0.61mi | 2/1.0 | 1,062 (-4%) | 22mo | $94,700 | $89 | 48 |
| 424 Merrill St | 0.39mi | 3/2.0 (+1) | 1,215 (+10%) | 13mo | $135,000 | $111 | 45 |
| 102 Huntington Park Dr | 0.44mi | 3/2.0 (+1) | 1,253 (+14%) | 4mo | $144,900 | $116 | 44 |
| 504 Walnut St | 0.54mi | 3/1.0 (+1) | 1,010 (-8%) | 20mo | $138,500 | $137 | 40 |
| 107 Burris St | 0.70mi | 3/1.0 (+1) | 1,000 (-9%) | 21mo | $155,000 | $155 | 30 |
Match score weights: distance 35% · size 25% · config 20% · recency 20%. Top-matched comps best support the ARV.
Projected returns pro-forma
10.0% appreciation · 3.0% rent growth · sell at horizon
- IRR
- 25.5%
- Equity multiple
- 3.03×
- Total profit
- $59,733
- Equity at exit
- $94,592
- IRR
- 22.4%
- Equity multiple
- 6.92×
- Total profit
- $173,938
- Equity at exit
- $203,992
Cash invested: $29,400 (down + closing). Projections, not guarantees.
Landlord ↔ Tenant lean methodology
- Overall (STATE)
- 43 Moderately Tenant-Leaning
- State Illinois
- 43 Moderately Tenant-Leaning · D+7
- County
- — inherits STATE
- City
- — inherits STATE
ZIP-level market 61817
- Home prices YoY
- 10.2%
- Active inventory
- 14
- Price-to-rent
- 9.1×
Monthly cashflow live
- Estimated rent
- $966 medium interval (Pro) →
- Mortgage (P&I)
- −$551
- Tax from tax record
- −$129 /mo · $1,549/yr
- Insurance
- −$44
- HOA
- −$0
- Vacancy / Maint / Mgmt
- −$203
- Net cashflow
- $40
Break-even live
UW: 25.0% down · 7.5% · 30yr · 1.5% tax · 5.0% vac · 8.0% maint · 8.0% mgmt
Financing live
Cash to close
- Down payment
- $26,250
- Closing costs
- $3,150
- Reserves months
- —
- Total cash needed
- —
Loan-product check · same deal, 3 products live
Conventional
25% down · 7.5% · 30yr
- Down + closing
- —
- Monthly P&I
- —
- Monthly cashflow
- —
- DSCR
- —
- Eligible?
- —
Personal DTI + credit; lowest rate.
DSCR
20% down · 8.5% · 30yr
- Down + closing
- —
- Monthly P&I
- —
- Monthly cashflow
- —
- DSCR
- —
- Eligible?
- —
No personal income docs; deal must DSCR.
Hard money
10% down · 12.0% · 12mo
- Down + closing
- —
- Monthly P&I
- —
- Monthly cashflow
- —
- DSCR
- —
- Eligible?
- —
Short-term bridge; refi at stabilization.
Rent comps 3 comps
| Address | Beds | Baths | Sqft | Rent | $/sqft | DOM | Units | Dist |
|---|---|---|---|---|---|---|---|---|
| 203 Wabash Ave Catlin, IL | 3.0 | 1.0 | 1150 | $950 | $0.83 | 43d | 1 | 0.09mi |
| 207 Martin Ct Catlin, IL | 2.0 | 1.5 | 850 | $999 | $1.18 | 2d | 1 | 0.21mi |
| 211 Martin Ct Apt A Catlin, IL | 2.0 | 1.5 | 990 | $975 | $0.98 | 2d | 1 | 0.23mi |
Listing history 6 events
-
2026-06-07statusdays on market $105,000 Pending 21 DOM
-
2026-06-03days on market $105,000 Active Under Contract 18 DOM
-
2026-06-02days on market $105,000 Active Under Contract 17 DOM
-
2026-06-01days on market $105,000 Active Under Contract 16 DOM
-
2026-05-31days on market $105,000 Active Under Contract 15 DOM
-
2026-05-30days on market $105,000 Active Under Contract 14 DOM
ⓘ Source: listings_history table (triggers on properties + properties_extension) + one-shot
backfill from property_details.listing_events for pre-trigger history.
Tax reassessment forecast IL · Partial reset (capped growth)
- Current annual tax
- $1,549 · $129/mo
- Projected year-2 tax
- $1,966 · $164/mo
- Expected delta
- +$417/yr (+$35/mo · 26.9%)
ⓘ Screening estimate from a state-policy table — verify with the county assessor before closing.
Nearby sold comps map
Loading sold comps map…
Walkable amenities ~0.75 mi
Loading nearby amenities…
Taxation est. · year 1
- Rental income
- $11,594
- − Mortgage interest
- −$5,882
- − Property taxes
- −$1,549
- − Insurance
- −$525
- − Repairs & maintenance
- −$928
- − Management
- −$928
- − Depreciation
- −$3,055
- Taxable loss
- −$1,271
- Est. tax savings @ 24.0%
- +$305
- After-tax cash flow
- $783/yr
For passive investors: Depreciation is non-cash, so a rental often shows a tax loss while cash-flowing — sheltering income. Rental losses are passive: they offset passive income freely, and up to $25,000/yr can offset ordinary (W-2) income if you actively participate and your MAGI is under $100k (phasing out to $0 by $150k); unused losses carry forward. On sale, claimed depreciation is recaptured at up to 25%, and gains may owe capital-gains tax (a 1031 exchange can defer both). Figures are a year-1 estimate at your 24.0% rate — not tax advice; consult a CPA.
Schools (NCES district)
No district data.
Livability — Catlin
- Score
- 67/100
- State rank
- #522
- US rank
- #10766
Category grades
Schools grade is shown separately in the Schools card above.
Census & demographics
- Census place
- Catlin, IL
- Population (ZIP)
- 2,447
Population outlook (Vermilion County) Hauer SSP2
- Today (2025)
- 72,775 people
- By 2030
- 69,235 · -4.9%
- By 2040
- 62,360 · -14.3%
- By 2050
- 55,539 · -23.7%
- By 2075
- 40,606 · -44.2%
- By 2100
- 26,985 · -62.9%
Race, ethnicity, and origin ACS 2023
- Neighborhood character
- Predominantly White (92%)
- Race & ethnicity
- White 92% Hispanic / Latino 6% Two or more races 1% Black 1%
- Hispanic origin (detail)
- Mexican 4% Cuban 2%
- Common ancestry
- Slovak 5% Iranian 2% Lithuanian 1%
- Foreign-born
- 4% · Canada
- Languages at home
- 96% English-only · Spanish 4%
Political lean MEDSL · Vermilion
- 2024 margin
- Solid R (+35.7) · D 31.4% · R 67.0% · Other 1.6%
- 2008→2024 swing
- -36.2pp toward R · 2008: 0.6pp · 2024: -35.7pp
- All cycles
- 2024: R+35.7 2020: R+32.9 2016: R+29.2 2012: R+15.7 2008: D+0.6
Not yet ingested
- Civics
- —
Market trends
- HPI YoY
- ▲ 24.05%
- Current HPI
- 260.408
- Rent YoY
- —
- Metro
- —
- State GDP YoY
- ▲ 1.59%
- F500 in state
- 60
Industry mix (Fortune 500 HQ in IL)
| Industry | F500 HQs | Revenue |
|---|---|---|
| Insurance | 4 | $201B |
|
||
| Consumer Goods | 4 | $87B |
|
||
| Industrial Machinery | 3 | $64B |
|
||
| Healthcare | 2 | $55B |
|
||
| Retail / Pharmacy | 1 | $148B |
|
||
| Agriculture / Food | 1 | $86B |
|
||
Price history
+1300.0% since first listed8 events — show timeline
- 2026-05-17 Contingent — CIBR
- 2026-05-16 Listed $105,000 CIBR
- 2022-02-24 Sold (Public Records) $58,500 Public Records
- 2022-02-22 Sold (MLS) $58,500 MRED as Distributed by MLS Grid
- 2022-02-22 Sold (MLS) $58,500 CIBR
- 2021-12-30 Listed $69,900 MRED as Distributed by MLS Grid
- 2021-12-30 Listed $69,900 CIBR
- 1971-04-16 Sold (Public Records) $7,500 Public Records
Property tax history
+25.6%/yrLatest (2024): $1,549 · +28.4% YoY. Source: county tax records.
Cash-flow waterfall
monthlySold comps — $/sqft
last 12 mo · ≤1 miLoading sold comps…