3943 Surf Rd · Sherwood Shores, TX
Flood risk 1/10 · Minimal
- FEMA flood zone
- X
- Chance of flooding over 30 yrs
- 0.0%
- Est. flood insurance / yr
- $507 – $1,088
Fire risk 4/10 · Minor
- Est. fire insurance / yr
- $2,463 – $4,575
Heat risk 6/10 · Moderate
- Hot days now (above 110°F)
- 7 days/yr
- Hot days in 30 yrs
- 21 days/yr
Wind risk 4/10 · Minor
- Chance of severe wind over 30 yrs
- 18.0%
Air-quality risk 3/10 · Minor
- Unhealthy air days now
- 3 days/yr
- Unhealthy air days in 30 yrs
- 3 days/yr
Risk factors via First Street. Map © Google.
Why this score? — see what drove the C grade
The composite is a weighted blend of 9 inputs, each scored 0–100. Each bar is that input's sub-score; the figure is the points it added to the 100-point composite (weight × sub-score).
- Cash flow +15.3/30.0
- ARV discount +15.0/15.0
- Appreciation +10.0/10.0
- DSCR +4.7/10.0
- 1% rule +3.5/10.0
- Rent growth +2.5/5.0
- Schools +2.5/10.0
- Livability +2.5/5.0
- Condition / age +2.5/5.0
$269,000
🖨 Deal sheet (PDF) 📄 Offer letter ✓ Due diligence
Listing remarks MLS
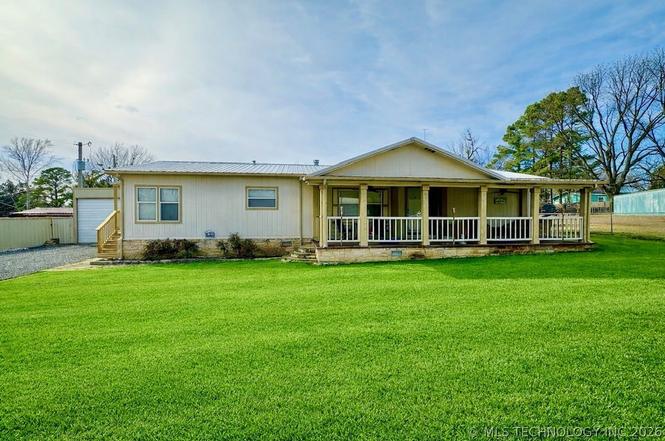
Location…. location! This beautiful well-maintained home is just a short golf cart ride to Buncombe Creek Marina, boat ramp, and Anchor 'N Restaurant. Home boasts a large covered front patio great for entertaining, spacious open floor plan, and shop building. Perfect set up for living at the lake!
Key facts
- Open floor plan
- Covered front patio
- Formal dining area
Tags
Property features AI
Finance
- HOA & community: Marina access; Sidewalks in the community; Less than 1 mile to water
Exterior
- Parking: Detached garage; 2 garage spaces; RV access/parking; Boat parking
- Security: Storm shelter; Smoke detectors
- Utilities: Electricity available; Water available (rural); Septic tank
- Home design: Manufactured double-wide home; Single-story; Faces east; Permanent foundation
- Construction: HardiPlank siding; Stone veneer accents; Metal roof; Built (year per public records)
- Exterior features: Covered patio/deck; Patio; Deck; Outdoor lighting; Workshop; Partial chain link fencing; Storm shelter; Smoke detectors; Beach access to Texoma Lake; Boat ramp/lift access to Texoma Lake
Interior
- Kitchen: Convection oven; Cooktop; Electric oven; Range; Dishwasher; Refrigerator
- Flooring: Carpet; Laminate
- Bathrooms: 2 full bathrooms
- Heating & cooling: Central heating (electric); Central air conditioning
- Interior features: Vaulted ceilings; Ceiling fans; Laminate countertops; Aluminum-framed windows; Electric oven/range connections
- Laundry & utility: Washer hookup; Electric dryer hookup; Washer; Dryer; Electric water heater
Neighborhood map
What this means for you Summary
Snapshot
- This is a 3-bed/2.0-bath manufactured listed at $269k.
Deal economics
- At list price, monthly cash flow is $100 ($1k/yr) — positive.
- The deal already cash-flows at list — no discount required.
- To meet the 1% rule (rent ≥ 1% of price), the offer needs to be $229k (14.9% below list).
- Recommended offer: $229k (14.9% below list) — sets the bar for 1% rule.
- Cap rate 6.7% vs local median 2.9% in Sherwood Shores — top-decile yield for the area; either an underpriced asset or a hidden risk that comps aren't pricing in. Stress-test before assuming the spread holds.
Location & tenants
- Location reads 49/100 on livability (#1,519 in TX) — a working-class tenant base; expect higher turnover. Strengths: cost of living A+, housing A+; Watch: crime F, amenities F, commute F.
- Kingston (rural): math 27% / reading 32% proficiency, ranked #70 of 270 in OK (top 26%) — low school quality limits family demand, transient renter base, plan for 1-2y turnover; 76% free/reduced lunch — lower-income household profile, screen leases tightly.
- Zoned schools: Kingston Es (math 33% / reading 32%, grade F, #210 of 845 statewide, top 25%, 620 students, 0% FRL); Kingston Ms (math 23% / reading 34%, grade F, #57 of 345 statewide, top 18%, 286 students, 0% FRL); Kingston Hs (math 22% / reading 27%, grade F, #150 of 447 statewide, top 48%, 362 students, 0% FRL) — zoned schools average 0% FRL vs 76% district-wide (76 pts lower); this property's tenant base skews higher-income than the district average.
- Market conditions: 42 units permitted in Marshall County in 2024 (0 in 5+ unit buildings).
Forward outlook
- In year one you build about $29k of equity ($2k loan paydown + $27k appreciation (10.0% local appreciation)).
- Marshall County population projected at +22% by 2050 — long-run rental-demand tailwind backs the buy-and-hold thesis.
- At projected returns (10.0% appreciation + 3.0% rent growth), your $75k cash investment doubles in ~3 years — after that, you're playing with house money.
- By year 2, paydown + projected appreciation supports a ~$46k cash-out refi (75% LTV) — recoverable capital for the next deal without selling this one.
Negotiation context
- It's been on market 131 days — a 12% lower offer ($237k) is reasonable based on typical stale-listing flexibility.
- 2 sale attempts since 5y ago; this cycle's ask has dropped $20k (7%) from the opening price — seller is motivated, your offer sets the floor, not the list.
Risks & watch-outs
- Climate carrying-cost: extreme-heat days projected 7→21/yr by 2055 (HVAC capex compounding) — expect insurance premiums to compound above CPI over the hold.
Questions for the listing agent
- It's been on market 131 days. Have you received any prior offers? Is the seller open to a 15% concession, seller financing, or rate buy-down credit?
- Why hasn't it sold? Are there any deal-killer items the seller is aware of (foundation, flood, title, zoning, code violations)?
- Is there a deadline driving the sale (1031 exchange, divorce, estate, relocation)? That informs how much negotiation room exists.
- Schools are F-rated, which usually means shorter tenancies and higher turnover. Who's the typical renter profile here, and what's been the actual vacancy rate?
- Crime grade is F in this area — have there been break-ins, vandalism, or insurance claims at this property in the last 3 years? What carrier currently insures it and at what premium?
- What's the average days-on-market for RENTAL listings here right now (not sales)? A rising rental-DOM trend means longer vacancies and softer asking-rent achievability than the comps imply.
- What's the recent tenant-quality profile in this submarket — average credit score on applications, eviction rate, late-payment / NSF rate, and stable-employment percentage? A property-management company in the area should have these aggregated.
- How much new for-sale + rental construction is in the pipeline within 1–3 miles? Heavy new supply typically softens prices + rents 12–24 months out; constrained supply supports both.
Investment metrics
- 1% rule
- 0.85% ✗
- Cap rate
- 6.74%
- Cash-on-cash
- 1.59%
- DSCR
- 1.07
- GRM
- 9.8
CMA / ARV
- ARV (on-the-fly)
- $346,080
- Comps found
- 1
Show comp detail 1 sale within ~0.75 mi
| Address | Dist | Beds/Ba | Sqft | Sold | Price | $/sf | Match |
|---|---|---|---|---|---|---|---|
| 4648 Angler Cir | 0.74mi | 3/2.5 | 1,792 (+7%) | 7mo | $370,000 | $206 | 47 |
Match score weights: distance 35% · size 25% · config 20% · recency 20%. Top-matched comps best support the ARV.
Projected returns pro-forma
10.0% appreciation · 3.0% rent growth · sell at horizon
- IRR
- 25.4%
- Equity multiple
- 3.03×
- Total profit
- $152,818
- Equity at exit
- $242,337
- IRR
- 22.4%
- Equity multiple
- 6.91×
- Total profit
- $444,899
- Equity at exit
- $522,608
Cash invested: $75,320 (down + closing). Projections, not guarantees.
Landlord ↔ Tenant lean methodology
- Overall (STATE)
- 87 Strongly Landlord-Friendly
- State Texas
- 87 Strongly Landlord-Friendly · R+5
- County
- — inherits STATE
- City
- — inherits STATE
ZIP-level market 73439
- Home prices YoY
- 12.3%
- Price-to-rent
- 9.8×
Monthly cashflow live
- Estimated rent
- $2,291 medium interval (Pro) →
- Mortgage (P&I)
- −$1,411
- Tax from tax record
- −$187 /mo · $2,241/yr
- Insurance
- −$112
- HOA
- −$0
- Vacancy / Maint / Mgmt
- −$481
- Net cashflow
- $100
Break-even live
Sensitivity live
| Price | -10% $252 | -5% $176 | +0% $100 | +5% $24 | +10% $-52 |
|---|---|---|---|---|---|
| Rent | -10% $-81 | -5% $10 | +0% $100 | +5% $190 | +10% $281 |
| Rate | -1.0pp $235 | -0.5pp $168 | base $100 | +0.5pp $30 | +1.0pp $-41 |
UW: 25.0% down · 7.5% · 30yr · 1.5% tax · 5.0% vac · 8.0% maint · 8.0% mgmt
Financing live
Cash to close
- Down payment
- $67,250
- Closing costs
- $8,070
- Reserves months
- —
- Total cash needed
- —
Loan-product check · same deal, 3 products live
Conventional
25% down · 7.5% · 30yr
- Down + closing
- —
- Monthly P&I
- —
- Monthly cashflow
- —
- DSCR
- —
- Eligible?
- —
Personal DTI + credit; lowest rate.
DSCR
20% down · 8.5% · 30yr
- Down + closing
- —
- Monthly P&I
- —
- Monthly cashflow
- —
- DSCR
- —
- Eligible?
- —
No personal income docs; deal must DSCR.
Hard money
10% down · 12.0% · 12mo
- Down + closing
- —
- Monthly P&I
- —
- Monthly cashflow
- —
- DSCR
- —
- Eligible?
- —
Short-term bridge; refi at stabilization.
Listing history 25 events
-
2026-06-22days on market $269,000 Active 131 DOM
-
2026-06-19days on market $269,000 Active 129 DOM
-
2026-06-18days on market $269,000 Active 128 DOM
-
2026-06-17days on market $269,000 Active 127 DOM
-
2026-06-16days on market $269,000 Active 126 DOM
-
2026-06-15days on market $269,000 Active 125 DOM
-
2026-06-14days on market $269,000 Active 123 DOM
-
2026-06-13days on market $269,000 Active 122 DOM
-
2026-06-10days on market $269,000 Active 120 DOM
-
2026-06-09days on market $269,000 Active 119 DOM
-
2026-06-08days on market $269,000 Active 118 DOM
-
2026-06-07days on market $269,000 Active 117 DOM
-
2026-06-05days on market $269,000 Active 114 DOM
-
2026-06-02days on market $269,000 Active 112 DOM
-
2026-06-01days on market $269,000 Active 111 DOM
-
2026-05-31days on market $269,000 Active 110 DOM
-
2026-05-30days on market $269,000 Active 109 DOM
-
2026-03-17price $269,000
-
2026-02-10$289,000 Active
-
2024-05-07soldstatus $249,500
-
2022-02-07soldstatus $186,500
-
2022-02-02soldstatus $186,250 Closed 305-char remark
Show marketing remark (305 chars)
Location…. location! This beautiful well-maintained home is just a short golf cart ride to Buncombe Creek Marina, boat ramp, and Anchor 'N Restaurant. Home boasts a large covered front patio great for entertaining, spacious open floor plan, and shop building. Perfect set up for living at the lake!
-
2021-12-23status Pending 305-char remark
Show marketing remark (305 chars)
Location…. location! This beautiful well-maintained home is just a short golf cart ride to Buncombe Creek Marina, boat ramp, and Anchor 'N Restaurant. Home boasts a large covered front patio great for entertaining, spacious open floor plan, and shop building. Perfect set up for living at the lake!
-
2021-12-10$192,000 Active 305-char remark
Show marketing remark (305 chars)
Location…. location! This beautiful well-maintained home is just a short golf cart ride to Buncombe Creek Marina, boat ramp, and Anchor 'N Restaurant. Home boasts a large covered front patio great for entertaining, spacious open floor plan, and shop building. Perfect set up for living at the lake!
-
2008-06-12soldstatus $45,000
ⓘ Source: listings_history table (triggers on properties + properties_extension) + one-shot
backfill from property_details.listing_events for pre-trigger history.
Tax reassessment forecast TX · Resets to sale price
- Current annual tax
- $2,241 · $187/mo
- Projected year-2 tax
- $4,923 · $410/mo
- Expected delta
- +$2,682/yr (+$223/mo · 119.7%)
ⓘ Screening estimate from a state-policy table — verify with the county assessor before closing.
Climate risk First Street
- Flood 1/10 Low FEMA zone X · 0% chance over 30 yrs
- Wildfire 4/10 Moderate
- Heat 6/10 Major 7 d/yr ≥110°F today · 21 d/yr by 30 yrs out
- Wind 4/10 Moderate 18% chance of damaging wind over 30 yrs
- Air quality 3/10 Moderate 3 unhealthy d/yr today · 3 by 30 yrs out
Nearby sold comps map
Loading sold comps map…
Walkable amenities ~0.75 mi
Loading nearby amenities…
Taxation est. · year 1
- Rental income
- $27,486
- − Mortgage interest
- −$15,068
- − Property taxes
- −$2,241
- − Insurance
- −$1,345
- − Repairs & maintenance
- −$2,199
- − Management
- −$2,199
- − Depreciation
- −$7,825
- Taxable loss
- −$3,391
- Est. tax savings @ 24.0%
- +$814
- After-tax cash flow
- $2,014/yr
For passive investors: Depreciation is non-cash, so a rental often shows a tax loss while cash-flowing — sheltering income. Rental losses are passive: they offset passive income freely, and up to $25,000/yr can offset ordinary (W-2) income if you actively participate and your MAGI is under $100k (phasing out to $0 by $150k); unused losses carry forward. On sale, claimed depreciation is recaptured at up to 25%, and gains may owe capital-gains tax (a 1031 exchange can defer both). Figures are a year-1 estimate at your 24.0% rate — not tax advice; consult a CPA.
Schools (NCES district)
- District
- Kingston
- NCES district ID
- 4016590
- Math proficiency
- 27% ▼ -7.00%
- Reading proficiency
- 32% ▼ -7.00%
- Median HH income
- $40,655
- Composite
- 24.88/100
- National rank
- #7585
- State rank
- #70 of 270 in OK
Livability — Sherwood Shores
- Score
- 49/100
- State rank
- #1519
- US rank
- #25941
Category grades
Schools grade is shown separately in the Schools card above.
Census & demographics
- Population (ZIP)
- 7,011
Population outlook (Marshall County) Hauer SSP2
- Today (2025)
- 17,405 people
- By 2030
- 18,038 · +3.6%
- By 2040
- 19,513 · +12.1%
- By 2050
- 21,283 · +22.3%
- By 2075
- 27,884 · +60.2%
- By 2100
- 35,435 · +103.6%
Race, ethnicity, and origin ACS 2023
- Neighborhood character
- Predominantly White (75%)
- Race & ethnicity
- White 75% Two or more races 16% Native American 5% Hispanic / Latino 4%
- Common ancestry
- Lithuanian 3% Italian 2% Serbian 1%
- Foreign-born
- 1% · Canada
- Languages at home
- 97% English-only · Spanish 3%
Political lean MEDSL · Marshall
- 2024 margin
- Solid R (+63.4) · D 17.7% · R 81.2% · Other 1.1%
- 2008→2024 swing
- -24.6pp toward R · 2008: -38.8pp · 2024: -63.4pp
- All cycles
- 2024: R+63.4 2020: R+62.5 2016: R+56.6 2012: R+45.7 2008: R+38.8
Not yet ingested
- Civics
- —
Market trends
- HPI YoY
- ▲ 26.96%
- Current HPI
- 246.2253
- Rent YoY
- —
- Metro
- —
- State GDP YoY
- ▲ 3.95%
- F500 in state
- 110
Industry mix (Fortune 500 HQ in TX)
| Industry | F500 HQs | Revenue |
|---|---|---|
| Energy | 16 | $1,198B |
|
||
| Technology | 5 | $198B |
|
||
| Engineering / Construction | 4 | $72B |
|
||
| Energy Services | 3 | $60B |
|
||
| Utilities | 3 | $41B |
|
||
| Healthcare | 2 | $330B |
|
||
Price history
+497.8% since first listed8 events — show timeline
- 2026-03-17 Price Changed $269,000 MLS Technology, Inc.
- 2026-02-10 Listed $289,000 MLS Technology, Inc.
- 2024-05-07 Sold (Public Records) $249,500 Public Records
- 2022-02-07 Sold (Public Records) $186,500 Public Records
- 2022-02-02 Sold (MLS) $186,250 MLS Technology, Inc.
- 2021-12-23 Pending — MLS Technology, Inc.
- 2021-12-10 Listed $192,000 MLS Technology, Inc.
- 2008-06-12 Sold (Public Records) $45,000 Public Records
Property tax history
+8.1%/yrLatest (2025): $2,241 · +70.7% YoY. Source: county tax records.
Cash-flow waterfall
monthlySold comps — $/sqft
last 12 mo · ≤1 miLoading sold comps…