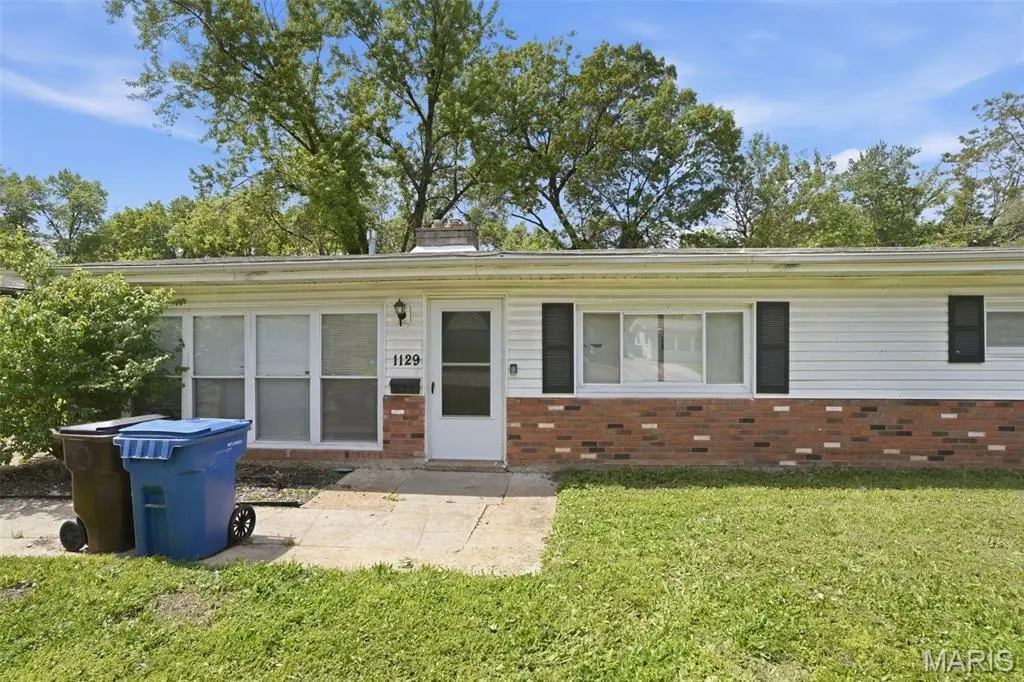
1129 Haley Ave · Cool Valley, MO
Flood risk 3/10 · Minor
- FEMA flood zone
- X (unshaded)
- Chance of flooding over 30 yrs
- 0.2%
- Est. flood insurance / yr
- $507 – $1,088
Fire risk 1/10 · Minimal
- Est. fire insurance / yr
- $1,054 – $1,958
Heat risk 5/10 · Moderate
- Hot days now (above 107°F)
- 7 days/yr
- Hot days in 30 yrs
- 21 days/yr
Wind risk 2/10 · Minimal
- Chance of severe wind over 30 yrs
- 1.0%
Air-quality risk 4/10 · Minor
- Unhealthy air days now
- 4 days/yr
- Unhealthy air days in 30 yrs
- 5 days/yr
Risk factors via First Street. Map © Google.
Why this score? — see what drove the C+ grade
The composite is a weighted blend of 9 inputs, each scored 0–100. Each bar is that input's sub-score; the figure is the points it added to the 100-point composite (weight × sub-score).
- Cash flow +29.3/30.0
- DSCR +10.0/10.0
- 1% rule +7.8/10.0
- ARV discount +4.0/15.0
- Rent growth +3.8/5.0
- Livability +3.6/5.0
- Condition / age +2.5/5.0
- Schools +1.2/10.0
- Appreciation +0.0/10.0
$119,900
🖨 Deal sheet 📄 Offer letter ✓ Due diligence
Listing remarks MLS
This is a "SHORT SALE" PROPERTY SOLD, AS, IS, ALL INSPECTIONS ARE FOR BUYER INFORMATION ONLY, NOT FOR NEGOTIATING PRICE. This spacious home was build for someone that has no interest in walking down into a basement. All 1570 sq. ft. is on the main level. As you enter into the house the living room is present with a wood burning fire place that occupied the corner wall that leads to the hallway that divides the bedrooms. The kitchen and dinning room is right off the family room with another wood burning fire place, which takes you thru 2 double doors to the fenced in back yard with 2 storage sheds. The laundry room and another bedroom is right off the kitchen and the master bedroom has a half bath. For all of you that couldn't make the "OPEN HOUSE" held Sunday,August 24, MISSED IT. The owners painted, cleaned carpets and fixed up the whole house. The before and after looks totally amazing. Come See for yourselves. SpecialListingConditions: Short Sale
Key facts
- Convenient access
- Natural light
- Outdoor space
Tags
Property features AI
Finance
- Other: No pool; Home warranty not included
- Financial info: Lease not considered; No second mortgage reported
Exterior
- Parking: Driveway
- Utilities: Public water; Public sewer; Electric service (other)
- Home design: Single family residence; One story; House; Above-grade finished living area approximately 1,614 (public records)
- Construction: Brick veneer and vinyl siding; Composition roof; Slab foundation
- Exterior features: Level lot; No patio or porch listed; No fencing
Interior
- Kitchen: Refrigerator included
- Bedrooms: 4 bedrooms (all on the main level)
- Flooring: Carpet; Vinyl
- Bathrooms: 2 full bathrooms (on the main level)
- Heating & cooling: Other heating; Central air (electric)
- Interior features: Kitchen/dining room combo; Living room fireplace
- Laundry & utility: Laundry on the main level
Neighborhood map
What this means for you Summary
Snapshot
- This is a 4-bed/1.5-bath single-family listed at $120k.
Deal economics
- At list price, monthly cash flow is $422 ($5k/yr) — positive.
- The deal already cash-flows at list — no discount required.
- Meets the 1% rule at list price ($2k rent vs $120k).
- Recommended offer: $116k (3.0% below list) — sets the bar for market timing.
Location & tenants
- Location reads 71/100 on livability (#116 in MO) — a middle-class / working-renter tenant base. Strengths: commute A+, cost of living A+, housing A+; Watch: amenities F, health & safety F.
- Ferguson-Florissant R-II (suburban): math 7% / reading 20% proficiency, ranked #311 of 324 in MO (top 96%) — low school quality limits family demand, transient renter base, plan for 1-2y turnover; 70% free/reduced lunch — lower-income household profile, screen leases tightly.
- Zoned schools: Mccluer High (math 0% / reading 17%, grade F, #511 of 521 statewide, top 98%, 1,181 students, 100% FRL) — zoned schools average 100% FRL vs 70% district-wide (30 pts higher); higher-poverty schools than district average — tighter screening recommended.
- Market conditions: Rents rising fast (+5.2%/yr); 23 active listings in the ZIP; 12 comparable units currently listed for rent nearby; rentals at typical pace (median 24d on market — plan ~3-4 weeks tenant-placement turnaround); 42% of comp listings sitting > 30 days — soft ceiling on asking rent; lower-income renter base — watch delinquency; 920 units permitted in St. Louis County in 2024 (250 in 5+ unit buildings).
- This rent runs 43% of the median local income ($43k/yr) — at the standard rent-burdened threshold; future hikes will face affordability resistance.
Forward outlook
- Local home prices are declining (-3.0%/yr); year-one equity from $829 of loan paydown is wiped out by about $4k of value loss. Plan a longer hold.
- At projected returns (-3.0% appreciation + 5.2% rent growth), your $34k cash investment doubles in ~7 years — after that, you're playing with house money.
Negotiation context
- It's been on market 35 days — a 3% lower offer ($116k) is reasonable based on typical stale-listing flexibility.
- 2 sale attempts since 11y ago with the ask held roughly flat each time — persistent listings suggest the price (not the market) is what's stuck; bring a comps-based counter.
- Current owner paid $93k; 29% above their basis — modest negotiation headroom, anchor on the comps not their cost.
Risks & watch-outs
- Watch-outs: built in 1955 — expect roof / HVAC / electrical / plumbing capex.
- Climate carrying-cost: extreme-heat days projected 7→21/yr by 2055 (HVAC capex compounding) — expect insurance premiums to compound above CPI over the hold.
Questions for the listing agent
- It's been on market 35 days. Have you received any prior offers? Is the seller open to a 3% concession, seller financing, or rate buy-down credit?
- Built in 1955 — when were the roof, HVAC, electrical panel, plumbing, and water heater last replaced?
- Is there a deadline driving the sale (1031 exchange, divorce, estate, relocation)? That informs how much negotiation room exists.
- Schools are D-rated, which usually means shorter tenancies and higher turnover. Who's the typical renter profile here, and what's been the actual vacancy rate?
- What's the average days-on-market for RENTAL listings here right now (not sales)? A rising rental-DOM trend means longer vacancies and softer asking-rent achievability than the comps imply.
- What's the recent tenant-quality profile in this submarket — average credit score on applications, eviction rate, late-payment / NSF rate, and stable-employment percentage? A property-management company in the area should have these aggregated.
- How much new for-sale + rental construction is in the pipeline within 1–3 miles? Heavy new supply typically softens prices + rents 12–24 months out; constrained supply supports both.
Investment metrics
- 1% rule
- 1.28% ✓
- Cap rate
- 10.51%
- Cash-on-cash
- 15.07%
- DSCR
- 1.67
- GRM
- 6.5
CMA / ARV
- ARV (median comp)
- $111,264
- List price
- $119,900
- Delta
- 7.76%
- Verdict
- FAIR
- Comps
- 20 within 1.0 mi
Show comp detail 12 sales within ~0.75 mi
| Address | Dist | Beds/Ba | Sqft | Sold | Price | $/sf | Match |
|---|---|---|---|---|---|---|---|
| 6009 Bermuda Dr | 0.31mi | 4/2.0 | 1,575 (+0%) | 1mo | $110,000 | $70 | 82 |
| 1207 Weleba Ave | 0.08mi | 4/1.5 | 1,424 (-9%) | 18mo | $129,900 | $91 | 66 |
| 107 Woodstock Rd | 0.09mi | 3/2.5 (-1) | 1,446 (-8%) | 13mo | $57,500 | $40 | 62 |
| 5909 Annex Ct | 0.28mi | 4/1.0 | 1,785 (+14%) | 0mo | $169,900 | $95 | 62 |
| 1312 Willingham Dr | 0.35mi | 3/2.0 (-1) | 1,404 (-11%) | 0mo | $135,000 | $96 | 59 |
| 6202 Dupree Ave | 0.60mi | 3/2.0 (-1) | 1,568 (-0%) | 15mo | $115,000 | $73 | 53 |
| 811 Elliott Ave | 0.57mi | 4/2.0 | 1,660 (+6%) | 14mo | $139,900 | $84 | 50 |
| 424 S Clark Ave | 0.66mi | 3/1.0 (-1) | 1,596 (+2%) | 12mo | $149,900 | $94 | 49 |
| 425 S Clark Ave | 0.66mi | 3/1.5 (-1) | 1,734 (+10%) | 2mo | $190,000 | $110 | 45 |
| 7827 Skyview dr Dr | 0.49mi | 4/3.0 | 1,374 (-12%) | 11mo | $199,500 | $145 | 41 |
| 335 St Louis Ave | 0.73mi | 3/1.5 (-1) | 1,456 (-7%) | 12mo | $155,000 | $106 | 39 |
| 709 Wiegel Dr | 0.65mi | 4/3.0 | 1,792 (+14%) | 11mo | $79,900 | $45 | 31 |
Match score weights: distance 35% · size 25% · config 20% · recency 20%. Top-matched comps best support the ARV.
Projected returns pro-forma
-3.0% appreciation · 5.21% rent growth · sell at horizon
- IRR
- 8.1%
- Equity multiple
- 1.33×
- Total profit
- $10,924
- Equity at exit
- $17,877
- IRR
- 19.1%
- Equity multiple
- 2.76×
- Total profit
- $59,102
- Equity at exit
- $10,367
Cash invested: $33,572 (down + closing). Projections, not guarantees.
Landlord ↔ Tenant lean methodology
- Overall (STATE)
- 81 Strongly Landlord-Friendly
- State Missouri
- 81 Strongly Landlord-Friendly · R+10
- County
- — inherits STATE
- City
- — inherits STATE
ZIP-level market 63121
- Rents YoY
- 5.2%
- Active inventory
- 23
- Price-to-rent
- 6.5×
Monthly cashflow live
- Estimated rent
- $1,537 high interval (Pro) →
- Mortgage (P&I)
- −$629
- Tax from tax record
- −$114 /mo · $1,369/yr
- Insurance
- −$50
- HOA
- −$0
- Vacancy / Maint / Mgmt
- −$323
- Net cashflow
- $422
Break-even live
UW: 25.0% down · 7.5% · 30yr · 1.5% tax · 5.0% vac · 8.0% maint · 8.0% mgmt
Financing live
Cash to close
- Down payment
- $29,975
- Closing costs
- $3,597
- Reserves months
- —
- Total cash needed
- —
Loan-product check · same deal, 3 products live
Conventional
25% down · 7.5% · 30yr
- Down + closing
- —
- Monthly P&I
- —
- Monthly cashflow
- —
- DSCR
- —
- Eligible?
- —
Personal DTI + credit; lowest rate.
DSCR
20% down · 8.5% · 30yr
- Down + closing
- —
- Monthly P&I
- —
- Monthly cashflow
- —
- DSCR
- —
- Eligible?
- —
No personal income docs; deal must DSCR.
Hard money
10% down · 12.0% · 12mo
- Down + closing
- —
- Monthly P&I
- —
- Monthly cashflow
- —
- DSCR
- —
- Eligible?
- —
Short-term bridge; refi at stabilization.
Rent comps 12 comps
| Address | Beds | Baths | Sqft | Rent | $/sqft | DOM | Units | Dist |
|---|---|---|---|---|---|---|---|---|
| 846 Elsworth Pl Saint Louis, MO | 4.0 | 1.0 | 1352 | $1,600 | $1.18 | 4d | 1 | 0.30mi |
| 6170 Emerald Ave Saint Louis, MO | 3.0 | 1.0 | 1286 | $1,425 | $1.11 | 2d | 1 | 0.54mi |
| 6170 Emerald Ave Saint Louis, MO | 3.0 | 1.0 | 1286 | $1,500 | $1.17 | 14d | 1 | 0.54mi |
| 7808 Winward Dr Saint Louis, MO | 3.0 | 1.0 | 1434 | $1,425 | $0.99 | 22d | 1 | 0.57mi |
| 338 Saint Louis Ave Saint Louis, MO | 3.0 | 1.0 | 1200 | $1,200 | $1.00 | 43d | 1 | 0.75mi |
| 265 S Harvey Ave Saint Louis, MO | 3.0 | 1.5 | 1240 | $1,350 | $1.09 | 43d | 1 | 0.93mi |
| 299 Dashwood Dr Saint Louis, MO | 3.0 | 2.0 | 1920 | $1,575 | $0.82 | 23d | 1 | 0.98mi |
| 406 Tiffin Ave Ferguson, MO | 4.0 | 1.0 | 1888 | $1,525 | $0.81 | 43d | 1 | 1.00mi |
| 945 Edgehill Dr Saint Louis, MO | 3.0 | 1.0 | 1110 | $1,575 | $1.42 | 43d | 1 | 1.13mi |
| 1006 Highmont Dr Saint Louis, MO | 3.0 | 1.0 | 1920 | $1,550 | $0.81 | 43d | 1 | 1.16mi |
| 324 Emmett Ave Saint Louis, MO | 3.0 | 2.0 | 1357 | $1,650 | $1.22 | 23d | 1 | 1.21mi |
| 13 N Hartnett Ave Saint Louis, MO | 3.0 | 1.0 | 1140 | $1,400 | $1.23 | 10d | 1 | 1.28mi |
Listing history 24 events
-
2026-06-18days on market $119,900 Active 35 DOM
-
2026-06-17days on market $119,900 Active 34 DOM
-
2026-06-16days on market $119,900 Active 33 DOM
-
2026-06-15pricedays on market $119,900 Active 32 DOM
-
2026-06-13days on market $124,900 Active 30 DOM
-
2026-06-13days on market $124,900 Active 29 DOM
-
2026-06-09days on market $124,900 Active 26 DOM
-
2026-06-08days on market $124,900 Active 25 DOM
-
2026-06-07days on market $124,900 Active 24 DOM
-
2026-06-05days on market $124,900 Active 21 DOM
-
2026-06-03days on market $124,900 Active 20 DOM
-
2026-06-02days on market $124,900 Active 19 DOM
-
2026-06-01days on market $124,900 Active 18 DOM
-
2026-05-31days on market $124,900 Active 17 DOM
-
2026-05-14$124,900 Active 1279-char remark
-
2021-11-02soldstatus $93,000
-
2021-05-05soldstatus $45,000
-
2015-05-20soldstatus $30,000
-
2015-05-18soldstatus Closed 985-char remark
Show marketing remark (985 chars)
This is a "SHORT SALE" PROPERTY SOLD, AS, IS, ALL INSPECTIONS ARE FOR BUYER INFORMATION ONLY, NOT FOR NEGOTIATING PRICE. This spacious home was build for someone that has no interest in walking down into a basement. All 1570 sq. ft. is on the main level. As you enter into the house the living room is present with a wood burning fire place that occupied the corner wall that leads to the hallway that divides the bedrooms. The kitchen and dinning room is right off the family room with another wood burning fire place, which takes you thru 2 double doors to the fenced in back yard with 2 storage sheds. The laundry room and another bedroom is right off the kitchen and the master bedroom has a half bath. For all of you that couldn't make the "OPEN HOUSE" held Sunday,August 24, MISSED IT. The owners painted, cleaned carpets and fixed up the whole house. The before and after looks totally amazing. Come See for yourselves. SpecialListingConditions: Short Sale
-
2015-04-14historical 985-char remark
Show marketing remark (985 chars)
This is a "SHORT SALE" PROPERTY SOLD, AS, IS, ALL INSPECTIONS ARE FOR BUYER INFORMATION ONLY, NOT FOR NEGOTIATING PRICE. This spacious home was build for someone that has no interest in walking down into a basement. All 1570 sq. ft. is on the main level. As you enter into the house the living room is present with a wood burning fire place that occupied the corner wall that leads to the hallway that divides the bedrooms. The kitchen and dinning room is right off the family room with another wood burning fire place, which takes you thru 2 double doors to the fenced in back yard with 2 storage sheds. The laundry room and another bedroom is right off the kitchen and the master bedroom has a half bath. For all of you that couldn't make the "OPEN HOUSE" held Sunday,August 24, MISSED IT. The owners painted, cleaned carpets and fixed up the whole house. The before and after looks totally amazing. Come See for yourselves. SpecialListingConditions: Short Sale
-
2015-03-11$30,000 Active 985-char remark
Show marketing remark (985 chars)
This is a "SHORT SALE" PROPERTY SOLD, AS, IS, ALL INSPECTIONS ARE FOR BUYER INFORMATION ONLY, NOT FOR NEGOTIATING PRICE. This spacious home was build for someone that has no interest in walking down into a basement. All 1570 sq. ft. is on the main level. As you enter into the house the living room is present with a wood burning fire place that occupied the corner wall that leads to the hallway that divides the bedrooms. The kitchen and dinning room is right off the family room with another wood burning fire place, which takes you thru 2 double doors to the fenced in back yard with 2 storage sheds. The laundry room and another bedroom is right off the kitchen and the master bedroom has a half bath. For all of you that couldn't make the "OPEN HOUSE" held Sunday,August 24, MISSED IT. The owners painted, cleaned carpets and fixed up the whole house. The before and after looks totally amazing. Come See for yourselves. SpecialListingConditions: Short Sale
-
2006-03-02soldstatus $99,900
-
2005-10-21soldstatus $42,000
-
1994-07-15soldstatus
ⓘ Source: listings_history table (triggers on properties + properties_extension) + one-shot
backfill from property_details.listing_events for pre-trigger history.
Tax reassessment forecast MO · Resets to sale price
- Current annual tax
- $1,369 · $114/mo
- Projected year-2 tax
- $1,369 · $114/mo
- Expected delta
- $0/yr ($0/mo · 0.0%)
ⓘ Screening estimate from a state-policy table — verify with the county assessor before closing.
Climate risk First Street
- Flood 3/10 Moderate FEMA zone X (unshaded) · 20% chance over 30 yrs
- Wildfire 1/10 Low
- Heat 5/10 Major 7 d/yr ≥107°F today · 21 d/yr by 30 yrs out
- Wind 2/10 Low 100% chance of damaging wind over 30 yrs
- Air quality 4/10 Moderate 4 unhealthy d/yr today · 5 by 30 yrs out
Nearby sold comps map
Loading sold comps map…
Walkable amenities ~0.75 mi
Loading nearby amenities…
Taxation est. · year 1
- Rental income
- $18,448
- − Mortgage interest
- −$6,716
- − Property taxes
- −$1,369
- − Insurance
- −$600
- − Repairs & maintenance
- −$1,476
- − Management
- −$1,476
- − Depreciation
- −$3,488
- Taxable income
- $3,324
- Est. tax owed @ 24.0%
- −$798
- After-tax cash flow
- $4,263/yr
For passive investors: Depreciation is non-cash, so a rental often shows a tax loss while cash-flowing — sheltering income. Rental losses are passive: they offset passive income freely, and up to $25,000/yr can offset ordinary (W-2) income if you actively participate and your MAGI is under $100k (phasing out to $0 by $150k); unused losses carry forward. On sale, claimed depreciation is recaptured at up to 25%, and gains may owe capital-gains tax (a 1031 exchange can defer both). Figures are a year-1 estimate at your 24.0% rate — not tax advice; consult a CPA.
Schools (NCES district)
- District
- Ferguson-Florissant R-II
- NCES district ID
- 2912010
- Math proficiency
- 7% ▼ -9.00%
- Reading proficiency
- 20% ▼ -6.00%
- Median HH income
- $44,610
- Composite
- 11.96/100
- National rank
- #9666
- State rank
- #311 of 324 in MO
Livability — Cool Valley
- Score
- 71/100
- State rank
- #116
- US rank
- #7242
Category grades
Schools grade is shown separately in the Schools card above.
Census & demographics
- Census place
- Cool Valley, MO
- County
- Saint Louis County · 888,823 people
- Metro
- St. Louis, MO-IL
- Population (ZIP)
- 25,008
- Household income
- $42,701
- Rent vs Own
- Severe rent burden
- 1611.0
Population outlook (St. Louis County) Hauer SSP2
- Today (2025)
- 1,025,227 people
- By 2030
- 1,028,023 · +0.3%
- By 2040
- 1,020,940 · -0.4%
- By 2050
- 1,007,280 · -1.8%
- By 2075
- 987,277 · -3.7%
- By 2100
- 921,984 · -10.1%
Race, ethnicity, and origin ACS 2023
- Neighborhood character
- Predominantly Black (80%)
- Race & ethnicity
- Black 80% White 14% Two or more races 4% Hispanic / Latino 2% Asian 2%
- Common ancestry
- Lithuanian 1%
- Foreign-born
- 2% · Canada
- Languages at home
- 96% English-only · Spanish 2% Other Indo-European 1%
Political lean MEDSL · St. Louis
- 2024 margin
- Strong D (+23.4) · D 60.8% · R 37.4% · Other 1.7%
- 2008→2024 swing
- +3.5pp toward D · 2008: 19.9pp · 2024: 23.4pp
- All cycles
- 2024: D+23.4 2020: D+24.0 2016: D+16.2 2012: D+13.7 2008: D+19.9
Not yet ingested
- Civics
- —
Market trends
- HPI YoY
- ▼ -177.84%
- Current HPI
- 100.4494
- Rent YoY
- ▲ 5.21%
- Metro
- St. Louis, MO-IL
- State GDP YoY
- ▲ 1.84%
- F500 in state
- 20
Industry mix (Fortune 500 HQ in MO)
| Industry | F500 HQs | Revenue |
|---|---|---|
| Healthcare | 1 | $163B |
|
||
| Insurance | 1 | $21B |
|
||
| Industrial Technology | 1 | $17B |
|
||
| Retail | 1 | $16B |
|
||
| Industrial Distribution | 1 | $10B |
|
||
| Utilities | 1 | $9B |
|
||
Price history
+185.5% since first listed11 events — show timeline
- 2026-06-15 Price Changed $119,900 MARIS as Distributed by MLS Grid
- 2026-05-14 Listed $124,900 MARIS as Distributed by MLS Grid
- 2021-11-02 Sold (Public Records) $93,000 Public Records
- 2021-05-05 Sold (Public Records) $45,000 Public Records
- 2015-05-20 Sold (Public Records) $30,000 Public Records
- 2015-05-18 Sold (MLS) — MARIS as Distributed by MLS Grid
- 2015-04-14 Delisted — MARIS as Distributed by MLS Grid
- 2015-03-11 Listed $30,000 MARIS as Distributed by MLS Grid
- 2006-03-02 Sold (Public Records) $99,900 Public Records
- 2005-10-21 Sold (Public Records) $42,000 Public Records
- 1994-07-15 Sold (Public Records) — Public Records
Property tax history
+3.2%/yrLatest (2022): $1,369 · +0.3% YoY. Source: county tax records.
Cash-flow waterfall
monthlySold comps — $/sqft
last 12 mo · ≤1 miLoading sold comps…