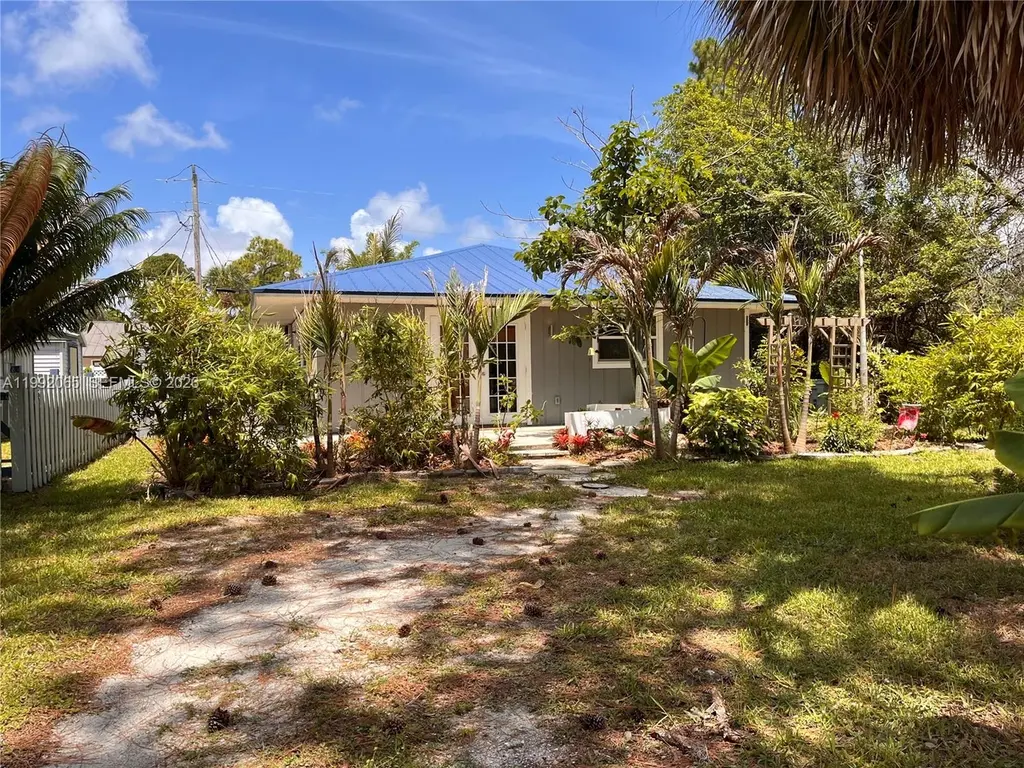
1125 SW 15th Ave SW · Florida Ridge, FL
Flood risk 1/10 · Minimal
- FEMA flood zone
- X (unshaded)
- Chance of flooding over 30 yrs
- 0.0%
- Est. flood insurance / yr
- $507 – $1,088
Fire risk 2/10 · Minimal
- Est. fire insurance / yr
- $947 – $1,759
Heat risk 10/10 · Severe
- Hot days now (above 106°F)
- 7 days/yr
- Hot days in 30 yrs
- 24 days/yr
Wind risk 10/10 · Severe
- Chance of severe wind over 30 yrs
- 99.0%
Air-quality risk 1/10 · Minimal
- Unhealthy air days now
- 0 days/yr
- Unhealthy air days in 30 yrs
- 0 days/yr
Risk factors via First Street. Map © Google.
Why this score? — see what drove the F grade
The composite is a weighted blend of 9 inputs, each scored 0–100. Each bar is that input's sub-score; the figure is the points it added to the 100-point composite (weight × sub-score).
- Cash flow +13.9/30.0
- DSCR +4.2/10.0
- Schools +4.2/10.0
- Livability +3.6/5.0
- Rent growth +3.5/5.0
- 1% rule +2.8/10.0
- Condition / age +2.5/5.0
- ARV discount +0.0/15.0
- Appreciation +0.0/10.0
$279,998
🖨 Deal sheet (PDF) 📄 Offer letter ✓ Due diligence
Listing remarks MLS
Naturally sunlit and artfully updated with beautiful design elements and finishes throughout This home is ready for you to move in. Enjoy the open floor plan, solid surface island kitchen and spacious living area, perfect for entertaining. Split bedrooms, 2 full baths, beautiful plank flooring, home office space, Impact windows 2019 AC, Private backyard, storage shed, workshop and gardens
Key facts
- Barn doors
- Quartz countertops
- Renovated
Tags
Property features AI
Finance
- Financial info: Pets allowed with no restrictions
Exterior
- Utilities: Public water; Public sewer; Cable available
- Home design: Single-story home; Faces east; RS-6 zoning
- Construction: Frame and stucco construction; Aluminum roof; Effective year built
- Exterior features: Deck; Fence; Fruit trees; Shed(s)
Interior
- Kitchen: Electric range; Microwave; Dishwasher; Refrigerator
- Bedrooms: Main-level bedroom
- Flooring: Tile
- Bathrooms: 2 full bathrooms
- Heating & cooling: Central heating; Central air; Wall/window unit(s)
- Interior features: French doors; First floor entry; Main-level primary bedroom
- Laundry & utility: Washer; Dryer; Laundry / utility room
Neighborhood map
What this means for you Summary
Snapshot
- This is a 3-bed/2.0-bath single-family listed at $280k.
Deal economics
- At list price, monthly cash flow is $30 ($358/yr) — positive.
- The deal already cash-flows at list — no discount required.
- To meet the 1% rule (rent ≥ 1% of price), the offer needs to be $218k (22.1% below list).
- Recommended offer: $218k (22.1% below list) — sets the bar for 1% rule.
- Cap rate 6.4% vs local median 4.5% in Florida Ridge — top-decile yield for the area; either an underpriced asset or a hidden risk that comps aren't pricing in. Stress-test before assuming the spread holds.
Location & tenants
- Location reads 72/100 on livability (#353 in FL) — a middle-class / working-renter tenant base. Strengths: commute A+, cost of living A+, housing A+; Watch: employment D, amenities F, health & safety D-.
- Indian River (other): math 48% / reading 52% proficiency, ranked #35 of 73 in FL (top 48%) — acceptable for families but not a draw, mixed tenant base, ~2y average lease.
- Zoned schools: Indian River Academy (math 53% / reading 50%, grade C-, #1,035 of 2,144 statewide, top 49%, 430 students, 81% FRL); Oslo Middle School (math 39% / reading 45%, grade D-, #340 of 571 statewide, top 61%, 864 students, 72% FRL); Vero Beach High School (math 28% / reading 43%, grade F, #367 of 667 statewide, top 57%, 2,847 students, 50% FRL).
- Market conditions: Rents rising fast (+4.2%/yr); 348 active listings in the ZIP; 13 comparable units currently listed for rent nearby; rentals at typical pace (median 23d on market — plan ~3-4 weeks tenant-placement turnaround); 564 units permitted in Indian River County in 2024 (281 in 5+ unit buildings).
- This rent runs 39% of the median local income ($67k/yr) — at the standard rent-burdened threshold; future hikes will face affordability resistance.
Forward outlook
- Local home prices are declining (-3.0%/yr); year-one equity from $2k of loan paydown is wiped out by about $8k of value loss. Plan a longer hold.
- Indian River County population projected at +18% by 2050 — long-run rental-demand tailwind backs the buy-and-hold thesis.
Negotiation context
- It's been on market 80 days — a 6% lower offer ($263k) is reasonable based on typical stale-listing flexibility.
- 4 sale attempts since 9y ago with the ask held roughly flat each time — persistent listings suggest the price (not the market) is what's stuck; bring a comps-based counter.
- Current owner paid $240k; 17% above their basis — modest negotiation headroom, anchor on the comps not their cost.
Risks & watch-outs
- Climate carrying-cost: severe wind risk, 99% chance of damaging wind over 30y; extreme-heat days projected 7→24/yr by 2055 (HVAC capex compounding) — expect insurance premiums to compound above CPI over the hold.
Questions for the listing agent
- It's been on market 80 days. Have you received any prior offers? Is the seller open to a 22% concession, seller financing, or rate buy-down credit?
- Why hasn't it sold? Are there any deal-killer items the seller is aware of (foundation, flood, title, zoning, code violations)?
- Is there a deadline driving the sale (1031 exchange, divorce, estate, relocation)? That informs how much negotiation room exists.
- Schools are D-rated, which usually means shorter tenancies and higher turnover. Who's the typical renter profile here, and what's been the actual vacancy rate?
- The area grade is low — what's the realistic commute time and amenity access for the typical tenant pool here? Any planned neighborhood developments (good or bad) we should know about?
- What's the average days-on-market for RENTAL listings here right now (not sales)? A rising rental-DOM trend means longer vacancies and softer asking-rent achievability than the comps imply.
- What's the recent tenant-quality profile in this submarket — average credit score on applications, eviction rate, late-payment / NSF rate, and stable-employment percentage? A property-management company in the area should have these aggregated.
- How much new for-sale + rental construction is in the pipeline within 1–3 miles? Heavy new supply typically softens prices + rents 12–24 months out; constrained supply supports both.
Investment metrics
- 1% rule
- 0.78% ✗
- Cap rate
- 6.42%
- Cash-on-cash
- 0.46%
- DSCR
- 1.02
- GRM
- 10.7
CMA / ARV
- ARV (on-the-fly)
- $232,960
- Comps found
- 12
Show comp detail 12 sales within ~0.75 mi
| Address | Dist | Beds/Ba | Sqft | Sold | Price | $/sf | Match |
|---|---|---|---|---|---|---|---|
| 1175 13th Ave SW | 0.11mi | 3/2.0 | 1,118 (-0%) | 2mo | $270,000 | $242 | 93 |
| 1150 19th Ave SW | 0.23mi | 3/2.0 | 1,128 (+1%) | 4mo | $264,900 | $235 | 84 |
| 1255 18th Ave SW | 0.25mi | 3/1.0 | 1,152 (+3%) | 1mo | $229,000 | $199 | 79 |
| 1221 18th Ave SW | 0.24mi | 3/2.0 | 1,176 (+5%) | 4mo | $195,000 | $166 | 77 |
| 1365 19th Ave SW | 0.38mi | 3/2.0 | 1,170 (+4%) | 4mo | $299,000 | $256 | 72 |
| 1550 17th Ct SW | 0.54mi | 3/2.0 | 1,152 (+3%) | 5mo | $240,000 | $208 | 66 |
| 1140 11th Ter SW | 0.29mi | 3/2.0 | 984 (-12%) | 3mo | $215,000 | $218 | 64 |
| 1606 20th Ave SW | 0.66mi | 3/2.0 | 1,176 (+5%) | 2mo | $214,900 | $183 | 60 |
| 2075 14th St SW | 0.50mi | 2/2.0 (-1) | 1,200 (+7%) | 3mo | $223,000 | $186 | 57 |
| 1435 17th Ct SW | 0.41mi | 3/2.0 | 1,280 (+14%) | 6mo | $239,900 | $187 | 52 |
| 1395 25th Ave Ave SW | 0.68mi | 2/2.0 (-1) | 1,051 (-6%) | 2mo | $239,000 | $227 | 52 |
| 1336 26th Ave SW | 0.72mi | 2/1.0 (-1) | 1,158 (+3%) | 5mo | $235,000 | $203 | 48 |
Match score weights: distance 35% · size 25% · config 20% · recency 20%. Top-matched comps best support the ARV.
Projected returns pro-forma
-3.0% appreciation · 4.18% rent growth · sell at horizon
- IRR
- -14.5%
- Equity multiple
- 0.48×
- Total profit
- $-40,969
- Equity at exit
- $41,749
- IRR
- -4.2%
- Equity multiple
- 0.71×
- Total profit
- $-22,692
- Equity at exit
- $24,209
Cash invested: $78,399 (down + closing). Projections, not guarantees.
Landlord ↔ Tenant lean methodology
- Overall (STATE)
- 87 Strongly Landlord-Friendly
- State Florida
- 87 Strongly Landlord-Friendly · R+3
- County
- — inherits STATE
- City
- — inherits STATE
ZIP-level market 32962
- Rents YoY
- 4.2%
- Active inventory
- 348
- Price-to-rent
- 10.7×
Monthly cashflow live
- Estimated rent
- $2,180 high interval (Pro) →
- Mortgage (P&I)
- −$1,468
- Tax from tax record
- −$108 /mo · $1,293/yr
- Insurance
- −$117
- HOA
- −$0
- Vacancy / Maint / Mgmt
- −$458
- Net cashflow
- $30
Break-even live
Sensitivity live
| Price | -10% $188 | -5% $109 | +0% $30 | +5% $-49 | +10% $-129 |
|---|---|---|---|---|---|
| Rent | -10% $-142 | -5% $-56 | +0% $30 | +5% $116 | +10% $202 |
| Rate | -1.0pp $171 | -0.5pp $101 | base $30 | +0.5pp $-43 | +1.0pp $-117 |
UW: 25.0% down · 7.5% · 30yr · 1.5% tax · 5.0% vac · 8.0% maint · 8.0% mgmt
Financing live
Cash to close
- Down payment
- $70,000
- Closing costs
- $8,400
- Reserves months
- —
- Total cash needed
- —
Loan-product check · same deal, 3 products live
Conventional
25% down · 7.5% · 30yr
- Down + closing
- —
- Monthly P&I
- —
- Monthly cashflow
- —
- DSCR
- —
- Eligible?
- —
Personal DTI + credit; lowest rate.
DSCR
20% down · 8.5% · 30yr
- Down + closing
- —
- Monthly P&I
- —
- Monthly cashflow
- —
- DSCR
- —
- Eligible?
- —
No personal income docs; deal must DSCR.
Hard money
10% down · 12.0% · 12mo
- Down + closing
- —
- Monthly P&I
- —
- Monthly cashflow
- —
- DSCR
- —
- Eligible?
- —
Short-term bridge; refi at stabilization.
Rent comps 13 comps
| Address | Beds | Baths | Sqft | Rent | $/sqft | DOM | Units | Dist |
|---|---|---|---|---|---|---|---|---|
| 826 Middleton Dr SW Vero Beach, FL | 3.0 | 2.0 | 1464 | $2,150 | $1.47 | 22d | 1 | 0.68mi |
| 2565 Langrove Ln SW Vero Beach, FL | 3.0 | 2.0 | 1464 | $2,000 | $1.37 | 22d | 1 | 0.76mi |
| 2619 Langrove Ln SW Unit 2619 Vero Beach, FL | 3.0 | 2.0 | 1464 | $2,450 | $1.67 | 22d | 1 | 0.81mi |
| 2543 Stockbridge Sq SW Vero Beach, FL | 3.0 | 2.0 | 1464 | $2,200 | $1.50 | 14d | 1 | 0.86mi |
| 721 Timber Ridge Trl SW Unit D Vero Beach, FL | 2.0 | 2.0 | 1368 | $2,300 | $1.68 | 22d | 1 | 0.87mi |
| 650 N Center Ct SW Unit 102 Vero Beach, FL | 3.0 | 2.0 | 1440 | $2,100 | $1.46 | 22d | 1 | 1.01mi |
| 710 Timber Ridge Trl SW Vero Beach, FL | 3.0 | 2.0 | 1498 | $2,500 | $1.67 | 22d | 1 | 1.05mi |
| 734 5th Pl SW Vero Beach, FL | 3.0 | 1.0 | 1402 | $1,800 | $1.28 | 22d | 1 | 1.07mi |
| 355 6th Rd SW Vero Beach, FL | 3.0 | 1.0 | 880 | $1,800 | $2.05 | 22d | 1 | 1.29mi |
| 248 27th Ave SW Vero Beach, FL | 3.0 | 2.0 | 836 | $1,700 | $2.03 | 22d | 1 | 1.38mi |
| 2624 2nd St SW Vero Beach, FL | 2.0 | 1.0 | 748 | $1,750 | $2.34 | 14d | 1 | 1.45mi |
| 1123 37th Ave SW Unit 1541760P Vero Beach, FL | 3.0 | 2.0 | 1248 | $3,075 | $2.46 | 14d | 1 | 1.46mi |
| 161 6th Ct SW Vero Beach, FL | 2.0 | 1.0 | 1298 | $1,590 | $1.22 | 14d | 1 | 1.48mi |
Listing history 27 events
-
2026-06-19days on market $279,998 Active 80 DOM
-
2026-06-18days on market $279,998 Active 79 DOM
-
2026-06-17days on market $279,998 Active 78 DOM
-
2026-06-16days on market $279,998 Active 77 DOM
-
2026-06-15days on market $279,998 Active 76 DOM
-
2026-06-14days on market $279,998 Active 74 DOM
-
2026-06-13pricedays on market $279,998 Active 73 DOM
-
2026-06-10days on market $279,999 Active 71 DOM
-
2026-06-09days on market $279,999 Active 70 DOM
-
2026-06-08days on market $279,999 Active 69 DOM
-
2026-06-07days on market $279,999 Active 68 DOM
-
2026-06-05days on market $279,999 Active 65 DOM
-
2026-06-02days on market $279,999 Active 63 DOM
-
2026-05-31days on market $279,999 Active 62 DOM
-
2026-05-30days on market $279,999 Active 61 DOM
-
2026-03-30$279,999 Active
-
2022-03-21soldstatus $240,000
-
2022-03-16soldstatus $240,000 Closed 391-char remark
Show marketing remark (391 chars)
Naturally sunlit and artfully updated with beautiful design elements and finishes throughout This home is ready for you to move in. Enjoy the open floor plan, solid surface island kitchen and spacious living area, perfect for entertaining. Split bedrooms, 2 full baths, beautiful plank flooring, home office space, Impact windows 2019 AC, Private backyard, storage shed, workshop and gardens
-
2022-02-07historical Active Under Contract 391-char remark
Show marketing remark (391 chars)
Naturally sunlit and artfully updated with beautiful design elements and finishes throughout This home is ready for you to move in. Enjoy the open floor plan, solid surface island kitchen and spacious living area, perfect for entertaining. Split bedrooms, 2 full baths, beautiful plank flooring, home office space, Impact windows 2019 AC, Private backyard, storage shed, workshop and gardens
-
2022-01-29$234,900 Active 391-char remark
Show marketing remark (391 chars)
Naturally sunlit and artfully updated with beautiful design elements and finishes throughout This home is ready for you to move in. Enjoy the open floor plan, solid surface island kitchen and spacious living area, perfect for entertaining. Split bedrooms, 2 full baths, beautiful plank flooring, home office space, Impact windows 2019 AC, Private backyard, storage shed, workshop and gardens
-
2017-12-15soldstatus $67,500 Sold 279-char remark
Show marketing remark (279 chars)
What a deal on this 2/2 1120 SF home in Oslo Park! Home boasts nice trees in front yard, .11 acre lot, French doors and den/office. Great location, close to schools, shopping, dining, parks and entertainment. Will not last at this price! This is a Fannie Mae HomePath property.
-
2017-11-14status Pending 279-char remark
Show marketing remark (279 chars)
What a deal on this 2/2 1120 SF home in Oslo Park! Home boasts nice trees in front yard, .11 acre lot, French doors and den/office. Great location, close to schools, shopping, dining, parks and entertainment. Will not last at this price! This is a Fannie Mae HomePath property.
-
2017-11-08price $74,900 279-char remark
Show marketing remark (279 chars)
What a deal on this 2/2 1120 SF home in Oslo Park! Home boasts nice trees in front yard, .11 acre lot, French doors and den/office. Great location, close to schools, shopping, dining, parks and entertainment. Will not last at this price! This is a Fannie Mae HomePath property.
-
2017-10-05$79,900 Active 279-char remark
Show marketing remark (279 chars)
What a deal on this 2/2 1120 SF home in Oslo Park! Home boasts nice trees in front yard, .11 acre lot, French doors and den/office. Great location, close to schools, shopping, dining, parks and entertainment. Will not last at this price! This is a Fannie Mae HomePath property.
-
2017-03-03$65,000
-
2006-04-28soldstatus $138,500
-
1983-03-01soldstatus $41,700
ⓘ Source: listings_history table (triggers on properties + properties_extension) + one-shot
backfill from property_details.listing_events for pre-trigger history.
Tax reassessment forecast FL · Resets to sale price
- Current annual tax
- $1,293 · $108/mo
- Projected year-2 tax
- $2,324 · $194/mo
- Expected delta
- +$1,031/yr (+$86/mo · 79.8%)
ⓘ Screening estimate from a state-policy table — verify with the county assessor before closing.
Climate risk First Street
- Flood 1/10 Low FEMA zone X (unshaded) · 0% chance over 30 yrs
- Wildfire 2/10 Low
- Heat 10/10 Extreme 7 d/yr ≥106°F today · 24 d/yr by 30 yrs out
- Wind 10/10 Extreme 99% chance of damaging wind over 30 yrs
- Air quality 1/10 Low 0 unhealthy d/yr today · 0 by 30 yrs out
Nearby sold comps map
Loading sold comps map…
Walkable amenities ~0.75 mi
Loading nearby amenities…
Taxation est. · year 1
- Rental income
- $26,165
- − Mortgage interest
- −$15,684
- − Property taxes
- −$1,293
- − Insurance
- −$1,400
- − Repairs & maintenance
- −$2,093
- − Management
- −$2,093
- − Depreciation
- −$8,145
- Taxable loss
- −$4,543
- Est. tax savings @ 24.0%
- +$1,090
- After-tax cash flow
- $1,448/yr
For passive investors: Depreciation is non-cash, so a rental often shows a tax loss while cash-flowing — sheltering income. Rental losses are passive: they offset passive income freely, and up to $25,000/yr can offset ordinary (W-2) income if you actively participate and your MAGI is under $100k (phasing out to $0 by $150k); unused losses carry forward. On sale, claimed depreciation is recaptured at up to 25%, and gains may owe capital-gains tax (a 1031 exchange can defer both). Figures are a year-1 estimate at your 24.0% rate — not tax advice; consult a CPA.
Schools (NCES district)
- District
- Indian River
- NCES district ID
- 1200930
- Math proficiency
- 48% ▼ -9.00%
- Reading proficiency
- 52% ▼ -3.00%
- Median HH income
- $46,597
- Composite
- 42.45/100
- National rank
- #3218
- State rank
- #35 of 73 in FL
Livability — Florida Ridge
- Score
- 72/100
- State rank
- #353
- US rank
- #6129
Category grades
Schools grade is shown separately in the Schools card above.
Census & demographics
- Census place
- Florida Ridge, FL
- County
- Indian River County · 143,738 people
- City population
- 25,629
- Metro
- Sebastian-Vero Beach, FL
- Population (ZIP)
- 25,522
- Household income
- $66,664
- Rent vs Own
- Severe rent burden
- 425.0
Population outlook (Indian River County) Hauer SSP2
- Today (2025)
- 165,104 people
- By 2030
- 172,869 · +4.7%
- By 2040
- 185,640 · +12.4%
- By 2050
- 194,465 · +17.8%
- By 2075
- 211,115 · +27.9%
- By 2100
- 211,781 · +28.3%
Race, ethnicity, and origin ACS 2023
- Neighborhood character
- Predominantly White (70%)
- Race & ethnicity
- White 70% Black 13% Hispanic / Latino 12% Two or more races 5% Native American 1%
- Hispanic origin (detail)
- Mexican 1% Puerto Rican 2% Cuban 1%
- Common ancestry
- Romanian 4% Lithuanian 4% Italian 3%
- Foreign-born
- 12% · Canada, Jamaica, Dominican Republic
- Languages at home
- 85% English-only · Spanish 9% Other Indo-European 2% French/Haitian/Cajun 1%
Political lean MEDSL · Indian River
- 2024 margin
- Strong R (+27.4) · D 36.0% · R 63.4%
- 2008→2024 swing
- -12.5pp toward R · 2008: -14.8pp · 2024: -27.4pp
- All cycles
- 2024: R+27.4 2020: R+21.6 2016: R+24.5 2012: R+22.3 2008: R+14.8
Not yet ingested
- Civics
- —
Market trends
- HPI YoY
- ▼ -182.13%
- Current HPI
- 333.3274
- Rent YoY
- ▲ 4.18%
- Metro
- Sebastian-Vero Beach, FL
- State GDP YoY
- ▲ 3.28%
- F500 in state
- 36
Industry mix (Fortune 500 HQ in FL)
| Industry | F500 HQs | Revenue |
|---|---|---|
| Industrial Technology | 2 | $29B |
|
||
| Insurance | 2 | $17B |
|
||
| Retail | 1 | $60B |
|
||
| Technology Distribution | 1 | $58B |
|
||
| Homebuilding | 1 | $35B |
|
||
| Technology Manufacturing | 1 | $35B |
|
||
Price history
+571.5% since first listed12 events — show timeline
- 2026-03-30 Listed $279,999 MARMLS
- 2022-03-21 Sold (Public Records) $240,000 Public Records
- 2022-03-16 Sold (MLS) $240,000 RAIRCMLS
- 2022-02-07 Contingent — RAIRCMLS
- 2022-01-29 Listed $234,900 RAIRCMLS
- 2017-12-15 Sold (MLS) $67,500 RAIRCMLS
- 2017-11-14 Pending — RAIRCMLS
- 2017-11-08 Price Changed $74,900 RAIRCMLS
- 2017-10-05 Listed $79,900 RAIRCMLS
- 2017-03-03 Listed $65,000 RAIRCMLS
- 2006-04-28 Sold (Public Records) $138,500 Public Records
- 1983-03-01 Sold (Public Records) $41,700 Public Records
Property tax history
+6.6%/yrLatest (2025): $1,293 · +24.8% YoY. Source: county tax records.
Cash-flow waterfall
monthlySold comps — $/sqft
last 12 mo · ≤1 miLoading sold comps…