90 SE Valley Trl SE · Cartersville, GA
Flood risk 1/10 · Minimal
- FEMA flood zone
- X (unshaded)
- Chance of flooding over 30 yrs
- 0.0%
- Est. flood insurance / yr
- $507 – $1,088
Fire risk 4/10 · Minor
- Est. fire insurance / yr
- $963 – $1,789
Heat risk 6/10 · Moderate
- Hot days now (above 104°F)
- 7 days/yr
- Hot days in 30 yrs
- 18 days/yr
Wind risk 4/10 · Minor
- Chance of severe wind over 30 yrs
- 17.0%
Air-quality risk 4/10 · Minor
- Unhealthy air days now
- 6 days/yr
- Unhealthy air days in 30 yrs
- 7 days/yr
Risk factors via First Street. Map © Google.
Why this score? — see what drove the C+ grade
The composite is a weighted blend of 9 inputs, each scored 0–100. Each bar is that input's sub-score; the figure is the points it added to the 100-point composite (weight × sub-score).
- Cash flow +25.5/30.0
- DSCR +8.5/10.0
- ARV discount +7.5/15.0
- 1% rule +6.7/10.0
- Livability +3.7/5.0
- Rent growth +3.4/5.0
- Schools +2.9/10.0
- Condition / age +2.5/5.0
- Appreciation +0.0/10.0
$149,700
🖨 Deal sheet 📄 Offer letter ✓ Due diligence
Listing remarks
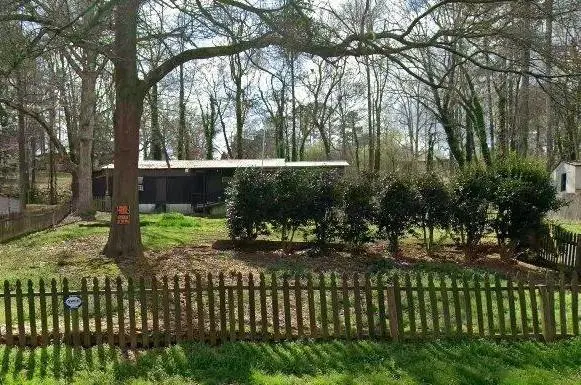
Large covered front porch overlooking your private storybook, fully fenced lot with mature trees and garden. Rustic-style house with many 1970’s original features, ready for your personal touches to make the diamond in the rough a real personal oasis or a great rental property with no restrictions or HOAs. Home also offers a large rear sun and BBQ deck with metal railings and spectacular private views. As a bonus, a huge storage building that can be transformed into the perfect hobby shop, offering plenty of extra space. Great location close to everything, with privacy and the best nature has to offer. Call today for more information or to schedule a tour.
Key facts
- Covered front porch
- Garden
- Fully fenced lot
Tags
Property features AI
Exterior
- Parking: Driveway; Open parking for up to 5 vehicles
- Utilities: Public water; Septic tank; 110V electric; Cable available; Electricity available; Water available
- Home design: One level; Fixer condition; Body type: Other
- Construction: Combination foundation; Construction materials: Other; Roof: Other; Built as a mobile/home body type
- Exterior features: Garden; Private yard; Storage; Covered patio/porch; Deck; Front porch; Outbuilding; Back yard fencing; Front yard fencing; Fenced
Interior
- Kitchen: Breakfast room
- Bedrooms: 3 bedrooms on the main level; Master on main
- Flooring: Carpet
- Bathrooms: 1 full bathroom (main level)
- Heating & cooling: Central heating; Ceiling fans; Window cooling units
- Interior features: Walk-in closet(s); No shared/common walls; Workshop
- Laundry & utility: Laundry in hall
Neighborhood map
What this means for you Summary
Snapshot
- This is a 2-bed/1.0-bath single-family listed at $150k.
Deal economics
- At list price, monthly cash flow is $351 ($4k/yr) — positive.
- The deal already cash-flows at list — no discount required.
- Meets the 1% rule at list price ($2k rent vs $150k).
- Recommended offer: $145k (3.0% below list) — sets the bar for market timing.
- Cap rate 9.1% vs local median 3.7% in Cartersville — top-decile yield for the area; either an underpriced asset or a hidden risk that comps aren't pricing in. Stress-test before assuming the spread holds.
Location & tenants
- Location reads 74/100 on livability (#43 in GA, #4,800 nationally) — a middle-class / working-renter tenant base. Strengths: housing A+, health & safety A+, amenities A; Watch: commute F.
- Bartow County (rural): math 33% / reading 34% proficiency, ranked #70 of 174 in GA (top 40%) — families likely to look elsewhere, expect single-tenant / working-renter base with shorter leases.
- Zoned schools: Emerson Elementary School (math 32% / reading 32%, grade F, #582 of 1,228 statewide, top 50%, 386 students, 67% FRL); Red Top Middle School (math 26% / reading 28%, grade F, #271 of 470 statewide, top 60%, 565 students, 70% FRL) — zoned schools average 68% FRL vs 51% district-wide (17 pts higher); higher-poverty schools than district average — tighter screening recommended.
- Market conditions: Rents rising (+3.5%/yr); 523 active listings in the ZIP; high-income renter base; 1,618 units permitted in Bartow County in 2024 (265 in 5+ unit buildings).
Forward outlook
- Local home prices are declining (-3.0%/yr); year-one equity from $1k of loan paydown is wiped out by about $4k of value loss. Plan a longer hold.
- At projected returns (-3.0% appreciation + 3.5% rent growth), your $42k cash investment doubles in ~10 years — after that, you're playing with house money.
Negotiation context
- It's been on market 33 days — a 3% lower offer ($145k) is reasonable based on typical stale-listing flexibility.
- Current owner paid $90k; list at $150k implies a 66% gain — meaningful room to come down on a strong offer.
Risks & watch-outs
- Climate carrying-cost: extreme-heat days projected 7→18/yr by 2055 (HVAC capex compounding) — expect insurance premiums to compound above CPI over the hold.
Questions for the listing agent
- It's been on market 33 days. Have you received any prior offers? Is the seller open to a 3% concession, seller financing, or rate buy-down credit?
- Built in 1972 — when were the roof, HVAC, electrical panel, plumbing, and water heater last replaced?
- Is there a deadline driving the sale (1031 exchange, divorce, estate, relocation)? That informs how much negotiation room exists.
- Schools are D-rated, which usually means shorter tenancies and higher turnover. Who's the typical renter profile here, and what's been the actual vacancy rate?
- What's the average days-on-market for RENTAL listings here right now (not sales)? A rising rental-DOM trend means longer vacancies and softer asking-rent achievability than the comps imply.
- What's the recent tenant-quality profile in this submarket — average credit score on applications, eviction rate, late-payment / NSF rate, and stable-employment percentage? A property-management company in the area should have these aggregated.
- How much new for-sale + rental construction is in the pipeline within 1–3 miles? Heavy new supply typically softens prices + rents 12–24 months out; constrained supply supports both.
Investment metrics
- 1% rule
- 1.17% ✓
- Cap rate
- 9.11%
- Cash-on-cash
- 10.05%
- DSCR
- 1.45
- GRM
- 7.1
CMA / ARV
No comps found within radius.
Projected returns pro-forma
-3.0% appreciation · 3.48% rent growth · sell at horizon
- IRR
- -0.6%
- Equity multiple
- 0.98×
- Total profit
- $-1,022
- Equity at exit
- $22,321
- IRR
- 9.5%
- Equity multiple
- 1.75×
- Total profit
- $31,534
- Equity at exit
- $12,943
Cash invested: $41,916 (down + closing). Projections, not guarantees.
Landlord ↔ Tenant lean methodology
- Overall (STATE)
- 90 Strongly Landlord-Friendly
- State Georgia
- 90 Strongly Landlord-Friendly · R+3
- County
- — inherits STATE
- City
- — inherits STATE
ZIP-level market 30101
- Rents YoY
- 3.5%
- Active inventory
- 523
- Price-to-rent
- 7.1×
Monthly cashflow live
- Estimated rent
- $1,754 medium interval (Pro) →
- Mortgage (P&I)
- −$785
- Tax est. 1.5%
- −$187 /mo · $2,246/yr
- Insurance
- −$62
- HOA
- −$0
- Vacancy / Maint / Mgmt
- −$368
- Net cashflow
- $351
Break-even live
UW: 25.0% down · 7.5% · 30yr · 1.5% tax · 5.0% vac · 8.0% maint · 8.0% mgmt
Financing live
Cash to close
- Down payment
- $37,425
- Closing costs
- $4,491
- Reserves months
- —
- Total cash needed
- —
Loan-product check · same deal, 3 products live
Conventional
25% down · 7.5% · 30yr
- Down + closing
- —
- Monthly P&I
- —
- Monthly cashflow
- —
- DSCR
- —
- Eligible?
- —
Personal DTI + credit; lowest rate.
DSCR
20% down · 8.5% · 30yr
- Down + closing
- —
- Monthly P&I
- —
- Monthly cashflow
- —
- DSCR
- —
- Eligible?
- —
No personal income docs; deal must DSCR.
Hard money
10% down · 12.0% · 12mo
- Down + closing
- —
- Monthly P&I
- —
- Monthly cashflow
- —
- DSCR
- —
- Eligible?
- —
Short-term bridge; refi at stabilization.
Listing history 15 events
-
2026-06-18days on market $149,700 Active 33 DOM
-
2026-06-17days on market $149,700 Active 32 DOM
-
2026-06-16days on market $149,700 Active 31 DOM
-
2026-06-15days on market $149,700 Active 30 DOM
-
2026-06-13days on market $149,700 Active 28 DOM
-
2026-06-09days on market $149,700 Active 24 DOM
-
2026-06-08days on market $149,700 Active 23 DOM
-
2026-06-07days on market $149,700 Active 22 DOM
-
2026-06-04days on market $149,700 Active 19 DOM
-
2026-06-03days on market $149,700 Active 18 DOM
-
2026-06-02days on market $149,700 Active 17 DOM
-
2026-06-01days on market $149,700 Active 16 DOM
-
2026-05-31days on market $149,700 Active 15 DOM
-
2026-05-16$159,400 Active
-
2026-03-03soldstatus $90,000
ⓘ Source: listings_history table (triggers on properties + properties_extension) + one-shot
backfill from property_details.listing_events for pre-trigger history.
Climate risk First Street
- Flood 1/10 Low FEMA zone X (unshaded) · 0% chance over 30 yrs
- Wildfire 4/10 Moderate
- Heat 6/10 Major 7 d/yr ≥104°F today · 18 d/yr by 30 yrs out
- Wind 4/10 Moderate 17% chance of damaging wind over 30 yrs
- Air quality 4/10 Moderate 6 unhealthy d/yr today · 7 by 30 yrs out
Nearby sold comps map
Loading sold comps map…
Walkable amenities ~0.75 mi
Loading nearby amenities…
Taxation est. · year 1
- Rental income
- $21,047
- − Mortgage interest
- −$8,386
- − Property taxes
- −$2,246
- − Insurance
- −$748
- − Repairs & maintenance
- −$1,684
- − Management
- −$1,684
- − Depreciation
- −$4,355
- Taxable income
- $1,945
- Est. tax owed @ 24.0%
- −$467
- After-tax cash flow
- $3,746/yr
For passive investors: Depreciation is non-cash, so a rental often shows a tax loss while cash-flowing — sheltering income. Rental losses are passive: they offset passive income freely, and up to $25,000/yr can offset ordinary (W-2) income if you actively participate and your MAGI is under $100k (phasing out to $0 by $150k); unused losses carry forward. On sale, claimed depreciation is recaptured at up to 25%, and gains may owe capital-gains tax (a 1031 exchange can defer both). Figures are a year-1 estimate at your 24.0% rate — not tax advice; consult a CPA.
Schools (NCES district)
- District
- Bartow County
- NCES district ID
- 1300330
- Math proficiency
- 33% ▼ -8.00%
- Reading proficiency
- 34% ▼ -7.00%
- Median HH income
- $50,596
- Composite
- 29.16/100
- National rank
- #6577
- State rank
- #70 of 174 in GA
Livability — Cartersville
- Score
- 74/100
- State rank
- #43
- US rank
- #4800
Category grades
Schools grade is shown separately in the Schools card above.
Census & demographics
- County
- Cobb County · 777,758 people
- City population
- 70,885
- Metro
- Atlanta-Sandy Springs-Alpharetta, GA
- Population (ZIP)
- 62,593
- Household income
- $110,774
- Rent vs Own
- Severe rent burden
- 851.0
Population outlook (Bartow County) Hauer SSP2
- Today (2025)
- 107,887 people
- By 2030
- 109,594 · +1.6%
- By 2040
- 111,038 · +2.9%
- By 2050
- 109,046 · +1.1%
- By 2075
- 99,484 · -7.8%
- By 2100
- 83,431 · -22.7%
Race, ethnicity, and origin ACS 2023
- Neighborhood character
- Predominantly White (65%)
- Race & ethnicity
- White 65% Black 18% Hispanic / Latino 11% Two or more races 7% Asian 2%
- Hispanic origin (detail)
- Mexican 5% Puerto Rican 1%
- Common ancestry
- Italian 2% Slovak 2% Romanian 2%
- Foreign-born
- 10% · Canada, Jamaica, Vietnam
- Languages at home
- 85% English-only · Spanish 8% Arabic 1% Other Indo-European 1%
Political lean MEDSL · Bartow
- 2024 margin
- Solid R (+51.0) · D 24.2% · R 75.2%
- 2008→2024 swing
- -5.8pp toward R · 2008: -45.2pp · 2024: -51.0pp
- All cycles
- 2024: R+51.0 2020: R+50.7 2016: R+55.2 2012: R+51.7 2008: R+45.2
Not yet ingested
- Civics
- —
Market trends
- HPI YoY
- ▼ -132.08%
- Current HPI
- 237.1884
- Rent YoY
- ▲ 3.48%
- Metro
- Atlanta-Sandy Springs-Alpharetta, GA
- State GDP YoY
- ▲ 2.66%
- F500 in state
- 28
Industry mix (Fortune 500 HQ in GA)
| Industry | F500 HQs | Revenue |
|---|---|---|
| Paper / Packaging | 2 | $29B |
|
||
| Retail | 1 | $160B |
|
||
| Transportation / Logistics | 1 | $91B |
|
||
| Airlines | 1 | $62B |
|
||
| Consumer Goods | 1 | $47B |
|
||
| Utilities | 1 | $25B |
|
||
Price history
+77.1% since first listed2 events — show timeline
- 2026-05-16 Listed $159,400 FMLS
- 2026-03-03 Sold (Public Records) $90,000 Public Records
Property tax history
+72.3%/yrLatest (2020): $135 · +115.9% YoY. Source: county tax records.
Cash-flow waterfall
monthlySold comps — $/sqft
last 12 mo · ≤1 miLoading sold comps…