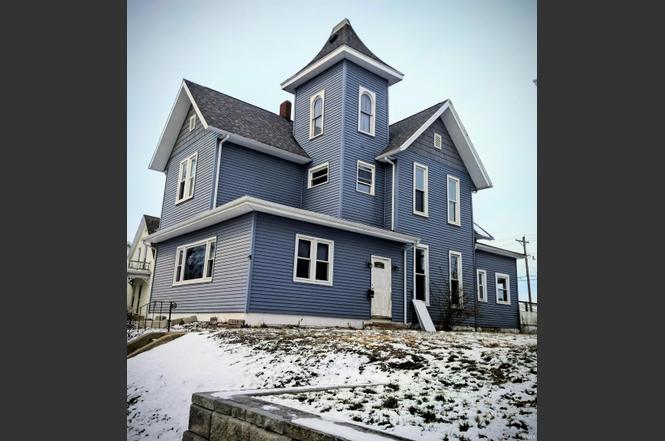
110 W 6th St · Peru, IN
Flood risk 1/10 · Minimal
- FEMA flood zone
- X (unshaded)
- Chance of flooding over 30 yrs
- 0.0%
- Est. flood insurance / yr
- $473 – $860
Fire risk 1/10 · Minimal
- Est. fire insurance / yr
- $717 – $1,331
Heat risk 3/10 · Minor
- Hot days now (above 102°F)
- 7 days/yr
- Hot days in 30 yrs
- 17 days/yr
Wind risk 2/10 · Minimal
- Chance of severe wind over 30 yrs
- —
Air-quality risk 2/10 · Minimal
- Unhealthy air days now
- 1 days/yr
- Unhealthy air days in 30 yrs
- 2 days/yr
Risk factors via First Street. Map © Google.
Why this score? — see what drove the B- grade
The composite is a weighted blend of 9 inputs, each scored 0–100. Each bar is that input's sub-score; the figure is the points it added to the 100-point composite (weight × sub-score).
- Cash flow +30.0/30.0
- 1% rule +10.0/10.0
- DSCR +10.0/10.0
- ARV discount +7.5/15.0
- Livability +3.9/5.0
- Schools +3.0/10.0
- Rent growth +2.5/5.0
- Condition / age +2.5/5.0
- Appreciation +0.0/10.0
$75,000
🖨 Deal sheet 📄 Offer letter ✓ Due diligence
Listing remarks
MOTIVATED SELLER! 5-bedroom, 1.5-bath property with prominent features, including a substantial layout, fireplace, winding staircase, private upper-level suite configuration, and updated siding and windows. Sold AS-IS and requiring full rehabilitation, cash only. Ideal for investors and contractors seeking a project with potential.
Key facts
- Winding staircase
- 8,712 sq ft lot
- Built 1954
Tags
Property features AI
Exterior
- Utilities: Public water; Public sewer
- Home design: Single-family residence (site-built); 2 stories
- Construction: Vinyl siding; Block foundation; Asphalt roof
- Exterior features: Level lot; Lot dimensions approximately 66 x 132 (0.2 acres); R1 zoning
Interior
- Bathrooms: 1 full bathroom; 1 half bathroom; One main-level bathroom
- Heating & cooling: Forced air heating; No central cooling
- Interior features: Living room fireplace (1); Full, unfinished basement with crawl space
- Laundry & utility: Laundry on the main level
Neighborhood map
What this means for you Summary
Snapshot
- This is a 4-bed/2.5-bath single-family listed at $75k.
Deal economics
- At list price, monthly cash flow is $497 ($6k/yr) — positive.
- The deal already cash-flows at list — no discount required.
- Meets the 1% rule at list price ($1k rent vs $75k).
- Recommended offer: $66k (12.0% below list) — sets the bar for market timing.
- Cap rate 14.3% vs local median 6.1% in Peru — top-decile yield for the area; either an underpriced asset or a hidden risk that comps aren't pricing in. Stress-test before assuming the spread holds.
Location & tenants
- Location reads 77/100 on livability (#35 in IN, #2,834 nationally) — a middle-class / working-renter tenant base. Strengths: amenities A+, cost of living A+, housing A+; Watch: crime D+, commute F, employment F.
- Peru Community Schools (town): math 31% / reading 42% proficiency, ranked #192 of 301 in IN (top 64%) — families likely to look elsewhere, expect single-tenant / working-renter base with shorter leases.
- Zoned schools: Blair Pointe Upper Elementary (math 34% / reading 38%, grade F, #577 of 994 statewide, top 59%, 552 students, 63% FRL); Peru Jr/Sr High School (math 27% / reading 57%, grade F, #197 of 369 statewide, top 57%, 883 students, 59% FRL).
- Market conditions: 129 active listings in the ZIP; 35 units permitted in Miami County in 2024 (0 in 5+ unit buildings).
Forward outlook
- Local home prices are declining (-3.0%/yr); year-one equity from $519 of loan paydown is wiped out by about $2k of value loss. Plan a longer hold.
- Miami County population projected at -12% by 2050 — secular population decline; favor cash flow + early exit over multi-decade hold.
- At projected returns (-3.0% appreciation + 3.0% rent growth), your $21k cash investment doubles in ~5 years — after that, you're playing with house money.
Negotiation context
- It's been on market 150 days — a 12% lower offer ($66k) is reasonable based on typical stale-listing flexibility.
Risks & watch-outs
- Watch-outs: property tax is 3.1% of price; built in 1954 — expect roof / HVAC / electrical / plumbing capex.
Questions for the listing agent
- It's been on market 150 days. Have you received any prior offers? Is the seller open to a 12% concession, seller financing, or rate buy-down credit?
- Built in 1954 — when were the roof, HVAC, electrical panel, plumbing, and water heater last replaced?
- Property tax is high relative to price — has the assessment been appealed recently, and will the sale trigger a re-assessment?
- Why hasn't it sold? Are there any deal-killer items the seller is aware of (foundation, flood, title, zoning, code violations)?
- Is there a deadline driving the sale (1031 exchange, divorce, estate, relocation)? That informs how much negotiation room exists.
- Schools are D-rated, which usually means shorter tenancies and higher turnover. Who's the typical renter profile here, and what's been the actual vacancy rate?
- Crime grade is D in this area — have there been break-ins, vandalism, or insurance claims at this property in the last 3 years? What carrier currently insures it and at what premium?
- What's the average days-on-market for RENTAL listings here right now (not sales)? A rising rental-DOM trend means longer vacancies and softer asking-rent achievability than the comps imply.
- What's the recent tenant-quality profile in this submarket — average credit score on applications, eviction rate, late-payment / NSF rate, and stable-employment percentage? A property-management company in the area should have these aggregated.
- How much new for-sale + rental construction is in the pipeline within 1–3 miles? Heavy new supply typically softens prices + rents 12–24 months out; constrained supply supports both.
Investment metrics
- 1% rule
- 1.88% ✓
- Cap rate
- 14.25%
- Cash-on-cash
- 28.42%
- DSCR
- 2.26
- GRM
- 4.4
CMA / ARV
- ARV (on-the-fly)
- $210,252
- Comps found
- 12
Show comp detail 12 sales within ~0.75 mi
| Address | Dist | Beds/Ba | Sqft | Sold | Price | $/sf | Match |
|---|---|---|---|---|---|---|---|
| 69 W 5 th St | 0.12mi | 3/2.0 (-1) | 2,450 (-2%) | 1mo | $212,000 | $87 | 83 |
| 226 W 3rd St | 0.30mi | 4/2.0 | 2,320 (-7%) | 1mo | $131,300 | $57 | 71 |
| 236 W 6th St | 0.24mi | 4/2.0 | 2,276 (-9%) | 2mo | $221,900 | $97 | 70 |
| 222 E 3rd St | 0.67mi | 4/2.5 | 2,500 (-0%) | 1mo | $248,875 | $100 | 68 |
| 429 W 7th St | 0.62mi | 4/2.5 | 2,408 (-4%) | 1mo | $195,000 | $81 | 64 |
| 357 W Main St | 0.48mi | 4/2.0 | 2,376 (-5%) | 4mo | $165,000 | $69 | 64 |
| 233 W 6th St | 0.24mi | 4/2.5 | 2,214 (-12%) | 8mo | $197,000 | $89 | 63 |
| 30 E Warren St | 0.65mi | 3/1.5 (-1) | 2,584 (+3%) | 4mo | $120,000 | $46 | 52 |
| 178 E Main St | 0.57mi | 5/3.0 (+1) | 2,680 (+7%) | 6mo | $225,000 | $84 | 50 |
| 103 E Riverside Dr | 0.63mi | 4/2.0 | 2,142 (-14%) | 1mo | $50,000 | $23 | 43 |
| 33 Delores Ave | 0.58mi | 5/3.0 (+1) | 2,200 (-12%) | 3mo | $225,000 | $102 | 43 |
| 234 E 6th St | 0.65mi | 4/2.5 | 2,137 (-15%) | 8mo | $169,900 | $80 | 39 |
Match score weights: distance 35% · size 25% · config 20% · recency 20%. Top-matched comps best support the ARV.
Projected returns pro-forma
-3.0% appreciation · 3.0% rent growth · sell at horizon
- IRR
- 22.7%
- Equity multiple
- 1.93×
- Total profit
- $19,607
- Equity at exit
- $11,183
- IRR
- 30.8%
- Equity multiple
- 3.77×
- Total profit
- $58,200
- Equity at exit
- $6,485
Cash invested: $21,000 (down + closing). Projections, not guarantees.
Landlord ↔ Tenant lean methodology
- Overall (STATE)
- 90 Strongly Landlord-Friendly
- State Indiana
- 90 Strongly Landlord-Friendly · R+11
- County
- — inherits STATE
- City
- — inherits STATE
ZIP-level market 46970
- Home prices YoY
- -8.8%
- Active inventory
- 129
- Price-to-rent
- 4.4×
Monthly cashflow live
- Estimated rent
- $1,413 medium interval (Pro) →
- Mortgage (P&I)
- −$393
- Tax from tax record
- −$194 /mo · $2,334/yr
- Insurance
- −$31
- HOA
- −$0
- Vacancy / Maint / Mgmt
- −$297
- Net cashflow
- $497
Break-even live
UW: 25.0% down · 7.5% · 30yr · 1.5% tax · 5.0% vac · 8.0% maint · 8.0% mgmt
Financing live
Cash to close
- Down payment
- $18,750
- Closing costs
- $2,250
- Reserves months
- —
- Total cash needed
- —
Loan-product check · same deal, 3 products live
Conventional
25% down · 7.5% · 30yr
- Down + closing
- —
- Monthly P&I
- —
- Monthly cashflow
- —
- DSCR
- —
- Eligible?
- —
Personal DTI + credit; lowest rate.
DSCR
20% down · 8.5% · 30yr
- Down + closing
- —
- Monthly P&I
- —
- Monthly cashflow
- —
- DSCR
- —
- Eligible?
- —
No personal income docs; deal must DSCR.
Hard money
10% down · 12.0% · 12mo
- Down + closing
- —
- Monthly P&I
- —
- Monthly cashflow
- —
- DSCR
- —
- Eligible?
- —
Short-term bridge; refi at stabilization.
Listing history 18 events
-
2026-06-12statusdays on market $75,000 Pending 150 DOM
-
2026-06-09days on market $75,000 Active Under Contract 148 DOM
-
2026-06-08days on market $75,000 Active Under Contract 147 DOM
-
2026-06-07days on market $75,000 Active Under Contract 146 DOM
-
2026-06-07days on market $75,000 Active Under Contract 145 DOM
-
2026-06-03days on market $75,000 Active Under Contract 142 DOM
-
2026-06-02days on market $75,000 Active Under Contract 141 DOM
-
2026-06-01days on market $75,000 Active Under Contract 140 DOM
-
2026-05-31days on market $75,000 Active Under Contract 139 DOM
-
2026-05-31days on market $75,000 Active Under Contract 138 DOM
-
2026-05-01historical Active Under Contract
-
2026-04-24price $75,000
-
2026-04-19price $80,000
-
2026-03-21price $85,000
-
2026-03-05price $90,000
-
2026-02-09price $92,000
-
2026-01-22price $95,000
-
2026-01-13$100,000 Active
ⓘ Source: listings_history table (triggers on properties + properties_extension) + one-shot
backfill from property_details.listing_events for pre-trigger history.
Tax reassessment forecast IN · Partial reset (capped growth)
- Current annual tax
- $2,334 · $194/mo
- Projected year-2 tax
- $2,334 · $194/mo
- Expected delta
- $0/yr ($0/mo · 0.0%)
ⓘ Screening estimate from a state-policy table — verify with the county assessor before closing.
Climate risk First Street
- Flood 1/10 Low FEMA zone X (unshaded) · 0% chance over 30 yrs
- Wildfire 1/10 Low
- Heat 3/10 Moderate 7 d/yr ≥102°F today · 17 d/yr by 30 yrs out
- Wind 2/10 Low
- Air quality 2/10 Low 1 unhealthy d/yr today · 2 by 30 yrs out
Nearby sold comps map
Loading sold comps map…
Walkable amenities ~0.75 mi
Loading nearby amenities…
Taxation est. · year 1
- Rental income
- $16,958
- − Mortgage interest
- −$4,201
- − Property taxes
- −$2,334
- − Insurance
- −$375
- − Repairs & maintenance
- −$1,357
- − Management
- −$1,357
- − Depreciation
- −$2,182
- Taxable income
- $5,153
- Est. tax owed @ 24.0%
- −$1,237
- After-tax cash flow
- $4,732/yr
For passive investors: Depreciation is non-cash, so a rental often shows a tax loss while cash-flowing — sheltering income. Rental losses are passive: they offset passive income freely, and up to $25,000/yr can offset ordinary (W-2) income if you actively participate and your MAGI is under $100k (phasing out to $0 by $150k); unused losses carry forward. On sale, claimed depreciation is recaptured at up to 25%, and gains may owe capital-gains tax (a 1031 exchange can defer both). Figures are a year-1 estimate at your 24.0% rate — not tax advice; consult a CPA.
Schools (NCES district)
- District
- Peru Community Schools
- NCES district ID
- 1808850
- Math proficiency
- 31% ▼ -9.00%
- Reading proficiency
- 42% ▼ -2.00%
- Median HH income
- $35,624
- Composite
- 30.18/100
- National rank
- #6316
- State rank
- #192 of 301 in IN
Livability — Peru
- Score
- 77/100
- State rank
- #35
- US rank
- #2834
Category grades
Schools grade is shown separately in the Schools card above.
Census & demographics
- Census place
- Peru, IN
- County
- Miami County · 23,020 people
- City population
- 23,020
- Metro
- Peru, IN
- Population (ZIP)
- 23,020
- Household income
- $57,842
- Rent vs Own
- Severe rent burden
- 498.0
Population outlook (Miami County) Hauer SSP2
- Today (2025)
- 34,421 people
- By 2030
- 33,571 · -2.5%
- By 2040
- 31,919 · -7.3%
- By 2050
- 30,313 · -11.9%
- By 2075
- 26,202 · -23.9%
- By 2100
- 20,856 · -39.4%
Race, ethnicity, and origin ACS 2023
- Neighborhood character
- Predominantly White (87%)
- Race & ethnicity
- White 87% Two or more races 6% Hispanic / Latino 4% Black 3%
- Common ancestry
- Iranian 2% Romanian 2% Slovak 2%
- Foreign-born
- 1% · Canada
- Languages at home
- 97% English-only · Spanish 2% German/W. Germanic 0%
Political lean MEDSL · Miami
- 2024 margin
- Solid R (+54.5) · D 21.8% · R 76.3% · Other 1.9%
- 2008→2024 swing
- -35.1pp toward R · 2008: -19.5pp · 2024: -54.5pp
- All cycles
- 2024: R+54.5 2020: R+53.1 2016: R+53.6 2012: R+30.9 2008: R+19.5
Not yet ingested
- Civics
- —
Market trends
- HPI YoY
- ▼ -24.29%
- Current HPI
- 252.7166
- Rent YoY
- —
- Metro
- Peru, IN
- State GDP YoY
- ▲ 2.90%
- F500 in state
- 18
Industry mix (Fortune 500 HQ in IN)
| Industry | F500 HQs | Revenue |
|---|---|---|
| Industrial Machinery | 2 | $37B |
|
||
| Healthcare | 1 | $177B |
|
||
| Pharmaceuticals | 1 | $45B |
|
||
| Metals / Steel | 1 | $18B |
|
||
| Agriculture | 1 | $17B |
|
||
| Packaging | 1 | $12B |
|
||
Price history
-25.0% since first listed8 events — show timeline
- 2026-05-01 Contingent — IRMLS
- 2026-04-24 Price Changed $75,000 IRMLS
- 2026-04-19 Price Changed $80,000 IRMLS
- 2026-03-21 Price Changed $85,000 IRMLS
- 2026-03-05 Price Changed $90,000 IRMLS
- 2026-02-09 Price Changed $92,000 IRMLS
- 2026-01-22 Price Changed $95,000 IRMLS
- 2026-01-13 Listed $100,000 IRMLS
Property tax history
-3.8%/yrLatest (2024): $2,334 · +1.1% YoY. Source: county tax records.
Cash-flow waterfall
monthlySold comps — $/sqft
last 12 mo · ≤1 miLoading sold comps…