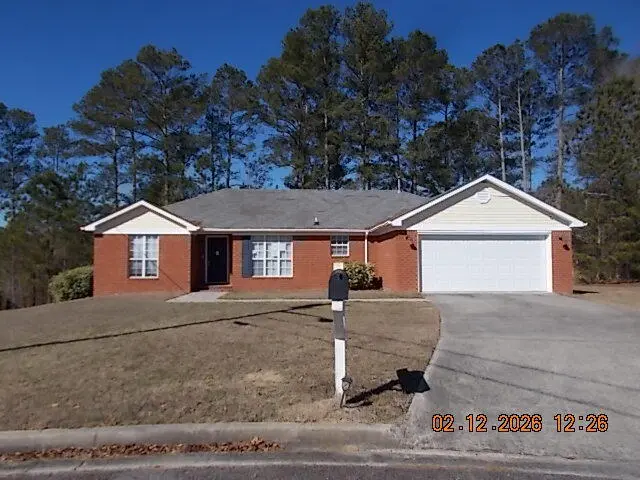
2820 Stoker Ct · Augusta-Richmond County consolidated government (balance), GA
Flood risk 1/10 · Minimal
- FEMA flood zone
- X (unshaded)
- Chance of flooding over 30 yrs
- 0.0%
- Est. flood insurance / yr
- $507 – $1,088
Fire risk 5/10 · Moderate
- Est. fire insurance / yr
- $963 – $1,789
Heat risk 7/10 · Major
- Hot days now (above 107°F)
- 7 days/yr
- Hot days in 30 yrs
- 18 days/yr
Wind risk 6/10 · Moderate
- Chance of severe wind over 30 yrs
- 69.0%
Air-quality risk 3/10 · Minor
- Unhealthy air days now
- 3 days/yr
- Unhealthy air days in 30 yrs
- 3 days/yr
Risk factors via First Street. Map © Google.
Why this score? — see what drove the D+ grade
The composite is a weighted blend of 9 inputs, each scored 0–100. Each bar is that input's sub-score; the figure is the points it added to the 100-point composite (weight × sub-score).
- Cash flow +15.2/30.0
- ARV discount +14.0/15.0
- DSCR +4.7/10.0
- 1% rule +4.2/10.0
- Livability +2.5/5.0
- Condition / age +2.5/5.0
- Rent growth +2.3/5.0
- Schools +1.3/10.0
- Appreciation +0.0/10.0
$199,000
🖨 Deal sheet 📄 Offer letter ✓ Due diligence
Listing remarks MLS
Better than new ranch plan home close to everything! Features include 1,651 sq ft of living space, 2 car garage 3 bedrooms, 2 full bathrooms, almost 1/2 acre lot at . 45 perfect for added privacy and space to play, , LVP floors throughout, cul-da-sac lot, established trees, large deck perfect for entertaining, freshly painted, brick exterior, and move in ready! Centrally located to Fort Gordon gate 5, restaurants, shopping, and Bobby Jones I-520. This home has it all at an amazingly affordable price!
Key facts
- 0.45 acre lot
- Garage
- Built 1998
Neighborhood map
What this means for you Summary
Snapshot
- This is a 3-bed/2.0-bath single-family listed at $199k.
Deal economics
- At list price, monthly cash flow is $68 ($819/yr) — positive.
- The deal already cash-flows at list — no discount required.
- To meet the 1% rule (rent ≥ 1% of price), the offer needs to be $183k (8.2% below list).
- Recommended offer: $183k (8.2% below list) — sets the bar for 1% rule.
- Cap rate 6.7% vs local median 5.3% in Augusta-Richmond County consolidated government (balance) — meaningfully above typical; check what's discounted (condition, days-on-market, listing class) to confirm the premium yield is real.
Location & tenants
- Location reads: area grade D — affects rentability + tenant quality, not the cash-flow math above.
- Richmond County (urban): math 12% / reading 20% proficiency, ranked #154 of 174 in GA (top 88%) — low school quality limits family demand, transient renter base, plan for 1-2y turnover; 72% free/reduced lunch — lower-income household profile, screen leases tightly.
- Zoned schools: Willis Foreman Elementary School (math 2% / reading 8%, grade F, #1,160 of 1,228 statewide, top 98%, 332 students, 98% FRL); Spirit Creek Middle School (math 4% / reading 12%, grade F, #445 of 470 statewide, top 95%, 532 students, 98% FRL) — zoned schools average 98% FRL vs 72% district-wide (26 pts higher); higher-poverty schools than district average — tighter screening recommended.
- Market conditions: Rents soft (-0.7%/yr); 359 active listings in the ZIP; 6 comparable units currently listed for rent nearby; rentals at typical pace (median 24d on market — plan ~3-4 weeks tenant-placement turnaround); 561 units permitted in Richmond County in 2024 (0 in 5+ unit buildings).
- This rent runs 31% of the median local income ($70k/yr) — at the standard rent-burdened threshold; future hikes will face affordability resistance.
Forward outlook
- Local home prices are declining (-3.0%/yr); year-one equity from $1k of loan paydown is wiped out by about $6k of value loss. Plan a longer hold.
- Richmond County population projected to shrink 5% by 2050 — rents likely to lag national; underwrite the cash flow, not the appreciation.
Negotiation context
- Only 0 days on market — expect competitive offers; lowballing is unlikely to land.
- 5 sale attempts since 4y ago with the ask held roughly flat each time — persistent listings suggest the price (not the market) is what's stuck; bring a comps-based counter.
Risks & watch-outs
- Climate carrying-cost: major wind risk, 69% chance of damaging wind over 30y; moderate wildfire risk; extreme-heat days projected 7→18/yr by 2055 (HVAC capex compounding) — expect insurance premiums to compound above CPI over the hold.
Questions for the listing agent
- Is there a deadline driving the sale (1031 exchange, divorce, estate, relocation)? That informs how much negotiation room exists.
- The area grade is low — what's the realistic commute time and amenity access for the typical tenant pool here? Any planned neighborhood developments (good or bad) we should know about?
- What's the average days-on-market for RENTAL listings here right now (not sales)? A rising rental-DOM trend means longer vacancies and softer asking-rent achievability than the comps imply.
- What's the recent tenant-quality profile in this submarket — average credit score on applications, eviction rate, late-payment / NSF rate, and stable-employment percentage? A property-management company in the area should have these aggregated.
- How much new for-sale + rental construction is in the pipeline within 1–3 miles? Heavy new supply typically softens prices + rents 12–24 months out; constrained supply supports both.
Investment metrics
- 1% rule
- 0.92% ✗
- Cap rate
- 6.70%
- Cash-on-cash
- 1.47%
- DSCR
- 1.07
- GRM
- 9.1
CMA / ARV
- ARV (on-the-fly)
- $232,791
- Comps found
- 8
Show comp detail 8 sales within ~0.75 mi
| Address | Dist | Beds/Ba | Sqft | Sold | Price | $/sf | Match |
|---|---|---|---|---|---|---|---|
| 2211 Altman Way | 0.20mi | 4/2.0 (+1) | 1,574 (-5%) | 8mo | $229,900 | $146 | 72 |
| 1326 Apache Trl | 0.25mi | 3/2.0 | 1,506 (-9%) | 9mo | $216,400 | $144 | 67 |
| 2046 Bassford Dr | 0.32mi | 3/2.0 | 1,876 (+14%) | 3mo | $245,000 | $131 | 60 |
| 2046 Bassford Dr | 0.32mi | 3/2.0 | 1,876 (+14%) | 3mo | $245,000 | $131 | 60 |
| 2049 Bassford Dr | 0.40mi | 3/2.0 | 1,835 (+11%) | 22mo | $205,000 | $112 | 44 |
| 1495 Brookstone Rd | 0.74mi | 3/2.0 | 1,620 (-2%) | 23mo | $235,000 | $145 | 44 |
| 1494 Brookstone Rd | 0.74mi | 3/2.0 | 1,815 (+10%) | 10mo | $250,000 | $138 | 40 |
| 1503 Brookstone Road Rd | 0.67mi | 3/2.0 | 1,829 (+11%) | 14mo | $257,000 | $141 | 39 |
Match score weights: distance 35% · size 25% · config 20% · recency 20%. Top-matched comps best support the ARV.
Projected returns pro-forma
-3.0% appreciation · 0.0% rent growth · sell at horizon
- IRR
- -17.4%
- Equity multiple
- 0.40×
- Total profit
- $-33,225
- Equity at exit
- $29,672
- IRR
- -16.3%
- Equity multiple
- 0.21×
- Total profit
- $-43,909
- Equity at exit
- $17,206
Cash invested: $55,720 (down + closing). Projections, not guarantees.
Landlord ↔ Tenant lean methodology
- Overall (STATE)
- 90 Strongly Landlord-Friendly
- State Georgia
- 90 Strongly Landlord-Friendly · R+3
- County
- — inherits STATE
- City
- — inherits STATE
ZIP-level market 30815
- Home prices YoY
- -24.2%
- Rents YoY
- -0.7%
- Active inventory
- 359
- Price-to-rent
- 9.1×
Monthly cashflow live
- Estimated rent
- $1,826 high interval (Pro) →
- Mortgage (P&I)
- −$1,044
- Tax from tax record
- −$248 /mo · $2,978/yr
- Insurance
- −$83
- HOA
- −$0
- Vacancy / Maint / Mgmt
- −$384
- Net cashflow
- $68
Break-even live
UW: 25.0% down · 7.5% · 30yr · 1.5% tax · 5.0% vac · 8.0% maint · 8.0% mgmt
Financing live
Cash to close
- Down payment
- $49,750
- Closing costs
- $5,970
- Reserves months
- —
- Total cash needed
- —
Loan-product check · same deal, 3 products live
Conventional
25% down · 7.5% · 30yr
- Down + closing
- —
- Monthly P&I
- —
- Monthly cashflow
- —
- DSCR
- —
- Eligible?
- —
Personal DTI + credit; lowest rate.
DSCR
20% down · 8.5% · 30yr
- Down + closing
- —
- Monthly P&I
- —
- Monthly cashflow
- —
- DSCR
- —
- Eligible?
- —
No personal income docs; deal must DSCR.
Hard money
10% down · 12.0% · 12mo
- Down + closing
- —
- Monthly P&I
- —
- Monthly cashflow
- —
- DSCR
- —
- Eligible?
- —
Short-term bridge; refi at stabilization.
Rent comps 6 comps
| Address | Beds | Baths | Sqft | Rent | $/sqft | DOM | Units | Dist |
|---|---|---|---|---|---|---|---|---|
| 3013 Heron Ct Hephzibah, GA | 3.0 | 2.0 | 1477 | $1,785 | $1.21 | 23d | 1 | 0.26mi |
| 3823 Fairington Dr Hephzibah, GA | 3.0 | 2.0 | 1380 | $1,450 | $1.05 | 14d | 1 | 1.26mi |
| 2933 Easton Dr Hephzibah, GA | 4.0 | 2.5 | 2038 | $2,200 | $1.08 | 43d | 1 | 1.38mi |
| 3881 Crest Dr Hephzibah, GA | 3.0 | 2.0 | 1400 | $1,595 | $1.14 | 14d | 1 | 1.44mi |
| 2629 Anthony Dejuan Pkwy Hephzibah, GA | 3.0 | 2.0 | 1392 | $1,650 | $1.19 | 43d | 1 | 1.45mi |
| 3883 Crest Dr Hephzibah, GA | 3.0 | 2.0 | 1380 | $3,600 | $2.61 | 14d | 1 | 1.45mi |
Listing history 14 events
-
2026-04-27status Pending
-
2026-04-27historical
-
2026-04-27historical
-
2026-03-20status Active
-
2026-03-06status Pending
-
2026-02-13$199,000 Active
-
2026-02-13$199,000
-
2022-12-01soldstatus $222,900
-
2022-11-29soldstatus $222,900 506-char remark
Show marketing remark (506 chars)
Better than new ranch plan home close to everything! Features include 1,651 sq ft of living space, 2 car garage 3 bedrooms, 2 full bathrooms, almost 1/2 acre lot at . 45 perfect for added privacy and space to play, , LVP floors throughout, cul-da-sac lot, established trees, large deck perfect for entertaining, freshly painted, brick exterior, and move in ready! Centrally located to Fort Gordon gate 5, restaurants, shopping, and Bobby Jones I-520. This home has it all at an amazingly affordable price!
-
2022-11-29soldstatus $222,900
Show marketing remark (506 chars)
Better than new ranch plan home close to everything! Features include 1,651 sq ft of living space, 2 car garage 3 bedrooms, 2 full bathrooms, almost 1/2 acre lot at . 45 perfect for added privacy and space to play, , LVP floors throughout, cul-da-sac lot, established trees, large deck perfect for entertaining, freshly painted, brick exterior, and move in ready! Centrally located to Fort Gordon gate 5, restaurants, shopping, and Bobby Jones I-520. This home has it all at an amazingly affordable price!
-
2022-10-15$219,900 506-char remark
Show marketing remark (506 chars)
Better than new ranch plan home close to everything! Features include 1,651 sq ft of living space, 2 car garage 3 bedrooms, 2 full bathrooms, almost 1/2 acre lot at . 45 perfect for added privacy and space to play, , LVP floors throughout, cul-da-sac lot, established trees, large deck perfect for entertaining, freshly painted, brick exterior, and move in ready! Centrally located to Fort Gordon gate 5, restaurants, shopping, and Bobby Jones I-520. This home has it all at an amazingly affordable price!
-
2022-10-15$219,900
Show marketing remark (506 chars)
Better than new ranch plan home close to everything! Features include 1,651 sq ft of living space, 2 car garage 3 bedrooms, 2 full bathrooms, almost 1/2 acre lot at . 45 perfect for added privacy and space to play, , LVP floors throughout, cul-da-sac lot, established trees, large deck perfect for entertaining, freshly painted, brick exterior, and move in ready! Centrally located to Fort Gordon gate 5, restaurants, shopping, and Bobby Jones I-520. This home has it all at an amazingly affordable price!
-
2021-01-26soldstatus $109,000
-
2003-02-27soldstatus $108,900
ⓘ Source: listings_history table (triggers on properties + properties_extension) + one-shot
backfill from property_details.listing_events for pre-trigger history.
Tax reassessment forecast GA · Resets to sale price
- Current annual tax
- $2,978 · $248/mo
- Projected year-2 tax
- $2,978 · $248/mo
- Expected delta
- $0/yr ($0/mo · 0.0%)
ⓘ Screening estimate from a state-policy table — verify with the county assessor before closing.
Climate risk First Street
- Flood 1/10 Low FEMA zone X (unshaded) · 0% chance over 30 yrs
- Wildfire 5/10 Major
- Heat 7/10 Severe 7 d/yr ≥107°F today · 18 d/yr by 30 yrs out
- Wind 6/10 Major 69% chance of damaging wind over 30 yrs
- Air quality 3/10 Moderate 3 unhealthy d/yr today · 3 by 30 yrs out
Nearby sold comps map
Loading sold comps map…
Walkable amenities ~0.75 mi
Loading nearby amenities…
Taxation est. · year 1
- Rental income
- $21,918
- − Mortgage interest
- −$11,147
- − Property taxes
- −$2,978
- − Insurance
- −$995
- − Repairs & maintenance
- −$1,753
- − Management
- −$1,753
- − Depreciation
- −$5,789
- Taxable loss
- −$2,498
- Est. tax savings @ 24.0%
- +$600
- After-tax cash flow
- $1,419/yr
For passive investors: Depreciation is non-cash, so a rental often shows a tax loss while cash-flowing — sheltering income. Rental losses are passive: they offset passive income freely, and up to $25,000/yr can offset ordinary (W-2) income if you actively participate and your MAGI is under $100k (phasing out to $0 by $150k); unused losses carry forward. On sale, claimed depreciation is recaptured at up to 25%, and gains may owe capital-gains tax (a 1031 exchange can defer both). Figures are a year-1 estimate at your 24.0% rate — not tax advice; consult a CPA.
Schools (NCES district)
- District
- Richmond County
- NCES district ID
- 1304380
- Math proficiency
- 12% ▼ -9.00%
- Reading proficiency
- 20% ▼ -6.00%
- Median HH income
- $38,069
- Composite
- 13.43/100
- National rank
- #9524
- State rank
- #154 of 174 in GA
Livability — Augusta-Richmond County consolidated government (balance)
No livability data for this city. (Only ~50 U.S. cities are tracked.)
Census & demographics
- Census place
- Augusta-Richmond County consolidated government (balance), GA
- County
- Richmond County · 190,917 people
- City population
- 154,035
- Metro
- Augusta-Richmond County, GA-SC
- Population (ZIP)
- 44,109
- Household income
- $70,202
- Rent vs Own
- Severe rent burden
- 867.0
Population outlook (Richmond County) Hauer SSP2
- Today (2025)
- 200,753 people
- By 2030
- 200,232 · -0.3%
- By 2040
- 196,813 · -2.0%
- By 2050
- 190,347 · -5.2%
- By 2075
- 172,496 · -14.1%
- By 2100
- 146,284 · -27.1%
Race, ethnicity, and origin ACS 2023
- Neighborhood character
- Majority Black (62%)
- Race & ethnicity
- Black 62% White 27% Two or more races 5% Hispanic / Latino 4%
- Foreign-born
- 4% · Canada, South Korea
- Languages at home
- 93% English-only · Spanish 3% Other Indo-European 1% Korean 1%
Political lean MEDSL · Richmond
- 2024 margin
- Solid D (+36.1) · D 67.8% · R 31.7%
- 2008→2024 swing
- +4.3pp toward D · 2008: 31.8pp · 2024: 36.1pp
- All cycles
- 2024: D+36.1 2020: D+37.2 2016: D+32.4 2012: D+33.8 2008: D+31.8
Not yet ingested
- Civics
- —
Market trends
- HPI YoY
- ▼ -51.74%
- Current HPI
- 162.4074
- Rent YoY
- ▼ -0.71%
- Metro
- Augusta-Richmond County, GA-SC
- State GDP YoY
- ▲ 2.66%
- F500 in state
- 28
Industry mix (Fortune 500 HQ in GA)
| Industry | F500 HQs | Revenue |
|---|---|---|
| Paper / Packaging | 2 | $29B |
|
||
| Retail | 1 | $160B |
|
||
| Transportation / Logistics | 1 | $91B |
|
||
| Airlines | 1 | $62B |
|
||
| Consumer Goods | 1 | $47B |
|
||
| Utilities | 1 | $25B |
|
||
Price history
+82.7% since first listed14 events — show timeline
- 2026-04-27 Pending — Hive MLS
- 2026-04-27 Listing Removed — Hive MLS
- 2026-04-27 Listing Removed — Hive MLS
- 2026-03-20 Relisted — Hive MLS
- 2026-03-06 Pending — Hive MLS
- 2026-02-13 Listed $199,000 Hive MLS
- 2026-02-13 Listed $199,000 Hive MLS
- 2022-12-01 Sold (Public Records) $222,900 Public Records
- 2022-11-29 Sold (MLS) $222,900 Hive MLS
- 2022-11-29 Sold (MLS) $222,900 Hive MLS
- 2022-10-15 Listed $219,900 Hive MLS
- 2022-10-15 Listed $219,900 Hive MLS
- 2021-01-26 Sold (Public Records) $109,000 Public Records
- 2003-02-27 Sold (Public Records) $108,900 Public Records
Property tax history
+4.1%/yrLatest (2025): $2,978 · +5.0% YoY. Source: county tax records.
Cash-flow waterfall
monthlySold comps — $/sqft
last 12 mo · ≤1 miLoading sold comps…