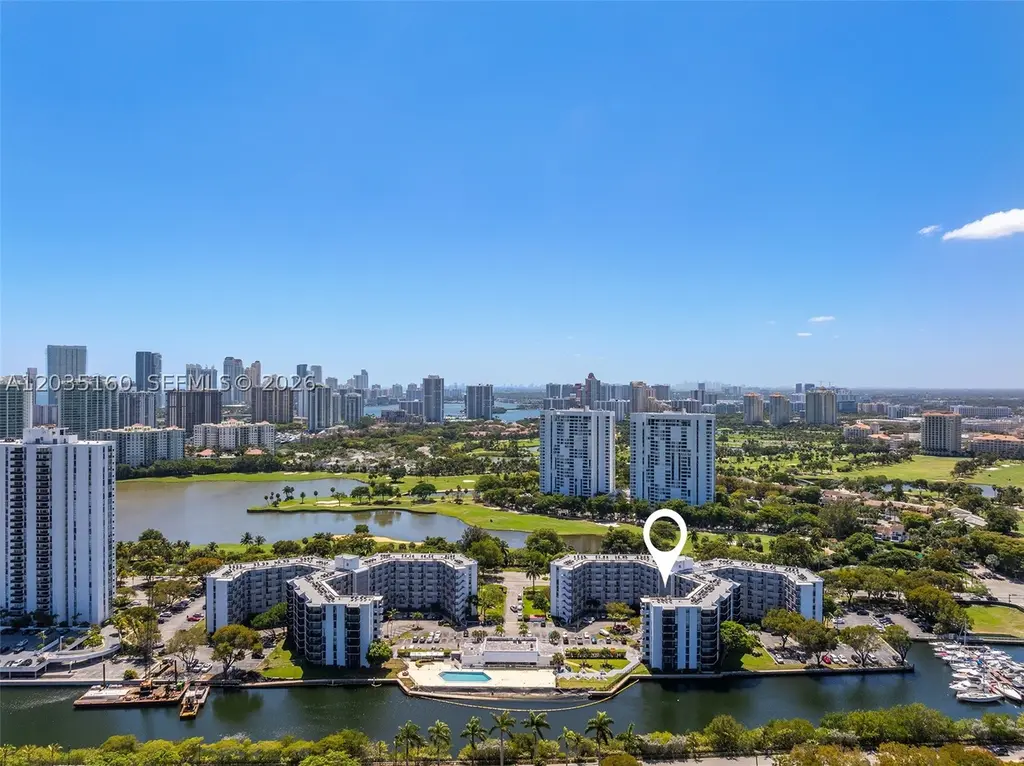
3401 N Country Club Dr #105 · Aventura, FL
Flood risk 8/10 · Major
- FEMA flood zone
- AE
- Chance of flooding over 30 yrs
- 0.97%
- Est. flood insurance / yr
- $1,737 – $8,500
Fire risk 1/10 · Minimal
- Est. fire insurance / yr
- $947 – $1,759
Heat risk 10/10 · Severe
- Hot days now (above 103°F)
- 6 days/yr
- Hot days in 30 yrs
- 22 days/yr
Wind risk 10/10 · Severe
- Chance of severe wind over 30 yrs
- 99.0%
Air-quality risk 2/10 · Minimal
- Unhealthy air days now
- 1 days/yr
- Unhealthy air days in 30 yrs
- 2 days/yr
Risk factors via First Street. Map © Google.
Why this score? — see what drove the B grade
The composite is a weighted blend of 9 inputs, each scored 0–100. Each bar is that input's sub-score; the figure is the points it added to the 100-point composite (weight × sub-score).
- Cash flow +30.0/30.0
- 1% rule +10.0/10.0
- DSCR +10.0/10.0
- ARV discount +7.5/15.0
- Schools +5.0/10.0
- Livability +4.0/5.0
- Condition / age +2.5/5.0
- Rent growth +2.1/5.0
- Appreciation +0.0/10.0
$209,000
🖨 Deal sheet (PDF) 📄 Offer letter ✓ Due diligence
Listing remarks
Welcome to this fully renovated first floor condo, centrally located at the Ensenada in Aventura. This 2 bedroom, 2 bath, 1,081 sqft condo has a versatile layout plus a large covered patio. Ensenada is a waterfront community located within a 5 minute drive of the Aventura Mall, Sunny Isles Beach, Aventura Brightline Station, Turnberry Isle Country Club and Gulf Stream Mall. Also, enjoy direct access to the 3.1 mile exercise trail that circles the golf course. Additionally, enjoy on-site amenities including pool, gym, BBQ, and billiard room. The HOA fee is very low and includes internet, trash, water and cable. Contact listing agent today for additional information and private showings.
Key facts
- Fully renovated
- Waterfront community
- Large covered patio
Tags
Property features AI
Finance
- Financial info: Pets allowed
- HOA & community: Monthly association fee; Association amenities include elevators; Association fee covers amenities, common areas, grounds maintenance, sewer, and trash
Exterior
- Parking: 1 garage space; 1 covered parking space
- Utilities: Sewer service included in association fee; Trash service included in association fee
- Home design: Attached property; Entry level: 1; 8-story building
- Construction: Block construction; Year built: Unknown
- Exterior features: Patio; Intracoastal access waterfront
Interior
- Kitchen: Dishwasher; Electric range; Microwave; Refrigerator
- Flooring: Vinyl flooring
- Bathrooms: 2 full bathrooms
- Heating & cooling: Central heating; Central air conditioning
- Interior features: First floor entry; Updated/remodeled condition; Other interior features
Neighborhood map
What this means for you Summary
Snapshot
- This is a 2-bed/2.0-bath condo listed at $209k.
Deal economics
- At list price, monthly cash flow is $387 ($5k/yr) — positive.
- The deal already cash-flows at list — no discount required.
- Meets the 1% rule at list price ($4k rent vs $209k).
- Cap rate 11.0% vs local median 2.6% in Aventura — top-decile yield for the area; either an underpriced asset or a hidden risk that comps aren't pricing in. Stress-test before assuming the spread holds.
Location & tenants
- Location reads 80/100 on livability (#127 in FL, #1,834 nationally) — a professional / high-income tenant draw. Strengths: schools A+, health & safety A+, amenities A; Watch: crime D+, cost of living F.
- Market conditions: Rents soft (-1.5%/yr); 992 active listings in the ZIP; 40 comparable units currently listed for rent nearby; rentals at typical pace (median 18d on market — plan ~3-4 weeks tenant-placement turnaround); solid renter incomes; 10,051 units permitted in Miami-Dade County in 2024 (7,758 in 5+ unit buildings).
- At $4,039/mo this rent would consume 53% of the median local household income ($91k/yr) (locally 1838% of renters already pay >50% of income on rent) — very limited rent-growth headroom before tenants either downsize or default.
Forward outlook
- Local home prices are declining (-3.0%/yr); year-one equity from $1k of loan paydown is wiped out by about $6k of value loss. Plan a longer hold.
- Miami-Dade County population projected at +28% by 2050 — long-run rental-demand tailwind backs the buy-and-hold thesis.
Negotiation context
- Only 10 days on market — expect competitive offers; lowballing is unlikely to land.
- 4 sale attempts since 12y ago with the ask held roughly flat each time — persistent listings suggest the price (not the market) is what's stuck; bring a comps-based counter.
- Current owner paid $85k; list at $209k implies a 146% gain — meaningful room to come down on a strong offer.
Risks & watch-outs
- Watch-outs: flood insurance adds $427/mo; HOA is 23% of rent.
- Climate carrying-cost: in FEMA flood zone AE (mandatory federal flood insurance); severe wind risk, 99% chance of damaging wind over 30y; extreme-heat days projected 6→22/yr by 2055 (HVAC capex compounding) — expect insurance premiums to compound above CPI over the hold.
Questions for the listing agent
- Built in 1971 — when were the roof, HVAC, electrical panel, plumbing, and water heater last replaced?
- What's the actual annual flood-insurance premium (NFIP or private), and is the property in a SFHA with mandatory coverage?
- What does the HOA fee cover, when was the last increase, and are there any pending special assessments or reserve-fund shortfalls?
- Any open or pending special assessments — roof, HVAC, plumbing, elevator, façade? What's the per-unit balance and payoff schedule, and is the seller paying it off at close or rolling it to the buyer?
- Is there a deadline driving the sale (1031 exchange, divorce, estate, relocation)? That informs how much negotiation room exists.
- Schools are A-rated — typically a magnet for longer-tenancy family renters. What's the average tenant stay here, and is there a school-zone premium baked into asking?
- Crime grade is D in this area — have there been break-ins, vandalism, or insurance claims at this property in the last 3 years? What carrier currently insures it and at what premium?
- What's the average days-on-market for RENTAL listings here right now (not sales)? A rising rental-DOM trend means longer vacancies and softer asking-rent achievability than the comps imply.
- What's the recent tenant-quality profile in this submarket — average credit score on applications, eviction rate, late-payment / NSF rate, and stable-employment percentage? A property-management company in the area should have these aggregated.
- How much new apartment / multifamily construction is in the pipeline within 1–3 miles? Heavy new supply (>2% of stock underway) typically softens rents 12–24 months out; light construction supports rent growth.
Investment metrics
- 1% rule
- 1.93% ✓
- Cap rate
- 10.96%
- Cash-on-cash
- 16.68%
- DSCR
- 1.74
- GRM
- 4.3
CMA / ARV
No comps found within radius.
Projected returns pro-forma
-3.0% appreciation · 0.0% rent growth · sell at horizon
- IRR
- -9.9%
- Equity multiple
- 0.66×
- Total profit
- $-20,150
- Equity at exit
- $31,163
- IRR
- -10.4%
- Equity multiple
- 0.52×
- Total profit
- $-27,898
- Equity at exit
- $18,071
Cash invested: $58,520 (down + closing). Projections, not guarantees.
Landlord ↔ Tenant lean methodology
- Overall (STATE)
- 87 Strongly Landlord-Friendly
- State Florida
- 87 Strongly Landlord-Friendly · R+3
- County
- — inherits STATE
- City
- — inherits STATE
ZIP-level market 33180
- Rents YoY
- -1.5%
- Active inventory
- 992
- Price-to-rent
- 4.3×
Monthly cashflow live
- Estimated rent
- $4,039 high interval (Pro) →
- Mortgage (P&I)
- −$1,096
- Tax from tax record
- −$265 /mo · $3,178/yr
- Insurance
- −$87
- Flood insurance flood zone
- −$427 /mo · $5,118/yr
- HOA
- −$929
- Vacancy / Maint / Mgmt
- −$848
- Net cashflow
- $387
Break-even live
Sensitivity live
| Price | -10% $505 | -5% $446 | +0% $387 | +5% $328 | +10% $269 |
|---|---|---|---|---|---|
| Rent | -10% $68 | -5% $228 | +0% $387 | +5% $547 | +10% $706 |
| Rate | -1.0pp $492 | -0.5pp $440 | base $387 | +0.5pp $333 | +1.0pp $278 |
UW: 25.0% down · 7.5% · 30yr · 1.5% tax · 5.0% vac · 8.0% maint · 8.0% mgmt
Financing live
Cash to close
- Down payment
- $52,250
- Closing costs
- $6,270
- Reserves months
- —
- Total cash needed
- —
Loan-product check · same deal, 3 products live
Conventional
25% down · 7.5% · 30yr
- Down + closing
- —
- Monthly P&I
- —
- Monthly cashflow
- —
- DSCR
- —
- Eligible?
- —
Personal DTI + credit; lowest rate.
DSCR
20% down · 8.5% · 30yr
- Down + closing
- —
- Monthly P&I
- —
- Monthly cashflow
- —
- DSCR
- —
- Eligible?
- —
No personal income docs; deal must DSCR.
Hard money
10% down · 12.0% · 12mo
- Down + closing
- —
- Monthly P&I
- —
- Monthly cashflow
- —
- DSCR
- —
- Eligible?
- —
Short-term bridge; refi at stabilization.
Rent comps 40 comps
| Address | Beds | Baths | Sqft | Rent | $/sqft | DOM | Units | Dist |
|---|---|---|---|---|---|---|---|---|
| 3180 S Ocean Dr #1709 Hallandale Beach, FL | 2.0 | 2.0 | 1105 | $4,000 | $3.62 | 8d | 1 | 1.00mi |
| 3180 S Ocean Dr Hallandale Beach, FL | 2.0–3.0 | 2.0 | 1263 | $3,750 | $2.97 | 21d | 2 | 1.00mi |
| 3180 S Ocean Dr Hallandale Beach, FL | 2.0–3.0 | 2.0 | 1285 | $3,650 | $2.84 | 25d | 3 | 1.00mi |
| 2069 S Ocean Dr Unit TH12 Hallandale Beach, FL | 3.0 | 3.0 | 1500 | $4,800 | $3.20 | 25d | 1 | 1.01mi |
| 2069 S Ocean Dr Unit TH12 Hallandale Beach, FL | 3.0 | 3.0 | 1500 | $4,800 | $3.20 | 11d | 1 | 1.01mi |
| 2017 S Ocean Dr #1107 Hallandale Beach, FL | 2.0 | 2.0 | 1270 | $3,900 | $3.07 | 14d | 1 | 1.02mi |
| 3140 S Ocean Dr Hallandale Beach, FL | 2.0 | 2.0 | 1100 | $4,250 | $3.86 | 2d | 2 | 1.03mi |
| 2065 S Ocean Dr Unit 1049793P Hallandale Beach, FL | 2.0 | 2.0 | 871 | $4,971 | $5.71 | 8d | 1 | 1.05mi |
| 2080 S Ocean Dr Hallandale Beach, FL | 2.0–3.0 | 2.0–2.5 | 1270 | $3,900 | $3.07 | 25d | 7 | 1.07mi |
| 2080 S Ocean Dr Hallandale Beach, FL | 2.0–3.0 | 2.0–2.5 | 1270 | $3,800 | $2.99 | 4d | 11 | 1.07mi |
| 2080 S Ocean Dr #3 Hallandale Beach, FL | 2.0 | 2.0 | 1260 | $5,000 | $3.97 | 25d | 1 | 1.07mi |
| 2080 S Ocean Dr #8 Hallandale Beach, FL | 2.0 | 2.0 | 1100 | $4,000 | $3.64 | 25d | 1 | 1.07mi |
| 2080 S Ocean Dr #6 Hallandale Beach, FL | 2.0 | 2.0 | 1165 | $4,500 | $3.86 | 25d | 1 | 1.07mi |
| 201 Golden Isles Dr #302 Hallandale Beach, FL | 2.0 | 2.0 | 1150 | $3,975 | $3.46 | 25d | 1 | 1.09mi |
| 2030 S Ocean Dr Hallandale Beach, FL | 2.0 | 2.0 | 1280 | $4,850 | $3.79 | 5d | 7 | 1.11mi |
| 2030 S Ocean Dr Hallandale Beach, FL | 2.0 | 2.0 | 1280 | $4,750 | $3.71 | 3d | 9 | 1.11mi |
| 2030 S Ocean Dr Hallandale Beach, FL | 2.0 | 2.0 | 1280 | $4,800 | $3.75 | 3d | 7 | 1.11mi |
| 2030 S Ocean Dr Hallandale Beach, FL | 2.0 | 2.0 | 1280 | $4,825 | $3.77 | 25d | 9 | 1.11mi |
| 2030 S Ocean Dr Hallandale Beach, FL | 2.0 | 2.0 | 1280 | $4,775 | $3.73 | 3d | 8 | 1.11mi |
| 1985 S Ocean Dr Unit 22P Hallandale Beach, FL | 2.0 | 2.0 | 1380 | $4,000 | $2.90 | 25d | 1 | 1.11mi |
| 1985 S Ocean Dr Unit 21P Hallandale Beach, FL | 2.0 | 2.0 | 1380 | $3,800 | $2.75 | 8d | 1 | 1.11mi |
| 1985 S Ocean Dr Unit 9G Hallandale Beach, FL | 2.0 | 2.0 | 1240 | $3,700 | $2.98 | 25d | 1 | 1.11mi |
| 121 Golden Isles Dr #1 Hallandale Beach, FL | 2.0 | 2.0 | 1379 | $4,000 | $2.90 | 25d | 1 | 1.19mi |
| 1945 S Ocean Dr Hallandale Beach, FL | 2.0–3.0 | 2.0–3.0 | 1542 | $4,500 | $2.92 | 8d | 2 | 1.21mi |
| 1945 S Ocean Dr Hallandale Beach, FL | 2.0–3.0 | 2.0–2.5 | 1522 | $3,650 | $2.40 | 19d | 3 | 1.21mi |
| 1945 S Ocean Dr Hallandale Beach, FL | 2.0–3.0 | 2.0–3.0 | 1542 | $4,000 | $2.59 | 15d | 3 | 1.21mi |
| 1945 S Ocean Dr Hallandale Beach, FL | 2.0–3.0 | 2.0–3.0 | 1542 | $4,500 | $2.92 | 13d | 2 | 1.21mi |
| 1180 E Hallandale Beach Blvd Unit 1241877P Hallandale Beach, FL | 1.0–2.0 | 1.0–2.0 | 844 | $5,453 | $6.46 | 4d | 2 | 1.22mi |
| 1950 S Ocean Dr Unit 3D Hallandale Beach, FL | 1.0 | 1.5 | 870 | $3,950 | $4.54 | 13d | 1 | 1.23mi |
| 1950 S Ocean Dr Unit 12M Hallandale Beach, FL | 1.0 | 1.5 | 870 | $3,800 | $4.37 | 3d | 1 | 1.23mi |
| 1950 S Ocean Dr Unit 12M Hallandale Beach, FL | 1.0 | 1.5 | 870 | $3,800 | $4.37 | 18d | 1 | 1.23mi |
| 1950 S Ocean Dr Unit 3D Hallandale Beach, FL | 1.0 | 1.5 | 870 | $3,950 | $4.54 | 6d | 1 | 1.23mi |
| 215 SE 5th St Hallandale Beach, FL | 2.0–3.0 | 2.0 | 1133 | $2,700 | $2.38 | 25d | 5 | 1.25mi |
| 211 SE 4th St #3 Hallandale Beach, FL | 3.0 | 2.5 | 1290 | $3,950 | $3.06 | 25d | 1 | 1.31mi |
| 223 SW 10th St Hallandale Beach, FL | 3.0 | 3.0 | 1289 | $3,900 | $3.03 | 25d | 1 | 1.32mi |
| 1904 S Ocean Dr #1707 Hallandale Beach, FL | 2.0 | 2.0 | 1350 | $5,000 | $3.70 | 25d | 1 | 1.33mi |
| 1880 N Ocean Dr Unit TS705 Hallandale Beach, FL | 2.0 | 2.0 | 1350 | $5,000 | $3.70 | 25d | 1 | 1.35mi |
| 1880 N Ocean Dr Unit TS705 Hallandale Beach, FL | 2.0 | 2.0 | 1350 | $5,000 | $3.70 | 17d | 1 | 1.35mi |
| 1880 N Ocean Dr Unit TS705 Hallandale Beach, FL | 2.0 | 2.0 | 1350 | $4,900 | $3.63 | 15d | 1 | 1.35mi |
| 707 SW 3rd Ave Hallandale Beach, FL | 3.0 | 2.0 | 1369 | $5,500 | $4.02 | 5d | 1 | 1.39mi |
HOA detail condo
- Monthly dues
- $929 · $11,148/yr
- Likely covers
- watertrashinternetcablepoolgym
- Assessments
- None detected in remarks — confirm with the listing agent.
Listing history 7 events
-
2026-06-21days on market $209,000 Active 10 DOM
-
2026-06-18days on market $209,000 Active 7 DOM
-
2026-06-17days on market $209,000 Active 6 DOM
-
2026-06-16days on market $209,000 Active 5 DOM
-
2026-06-15days on market $209,000 Active 4 DOM
-
2026-06-13remarks 694-char remark
-
2026-06-13$209,000 Active 2 DOM
ⓘ Source: listings_history table (triggers on properties + properties_extension) + one-shot
backfill from property_details.listing_events for pre-trigger history.
Tax reassessment forecast FL · Resets to sale price
- Current annual tax
- $3,178 · $265/mo
- Projected year-2 tax
- $3,178 · $265/mo
- Expected delta
- $0/yr ($0/mo · 0.0%)
ⓘ Screening estimate from a state-policy table — verify with the county assessor before closing.
Climate risk First Street
- Flood 8/10 Severe FEMA zone AE · 97% chance over 30 yrs
- Wildfire 1/10 Low
- Heat 10/10 Extreme 6 d/yr ≥103°F today · 22 d/yr by 30 yrs out
- Wind 10/10 Extreme 99% chance of damaging wind over 30 yrs
- Air quality 2/10 Low 1 unhealthy d/yr today · 2 by 30 yrs out
Nearby sold comps map
Loading sold comps map…
Walkable amenities ~0.75 mi
Loading nearby amenities…
Taxation est. · year 1
- Rental income
- $48,465
- − Mortgage interest
- −$11,707
- − Property taxes
- −$3,178
- − Insurance
- −$6,164
- − Repairs & maintenance
- −$3,877
- − Management
- −$3,877
- − HOA
- −$11,148
- − Depreciation
- −$6,080
- Taxable income
- $2,434
- Est. tax owed @ 24.0%
- −$584
- After-tax cash flow
- $4,061/yr
For passive investors: Depreciation is non-cash, so a rental often shows a tax loss while cash-flowing — sheltering income. Rental losses are passive: they offset passive income freely, and up to $25,000/yr can offset ordinary (W-2) income if you actively participate and your MAGI is under $100k (phasing out to $0 by $150k); unused losses carry forward. On sale, claimed depreciation is recaptured at up to 25%, and gains may owe capital-gains tax (a 1031 exchange can defer both). Figures are a year-1 estimate at your 24.0% rate — not tax advice; consult a CPA.
Schools (NCES district)
No district data.
Livability — Aventura
- Score
- 80/100
- State rank
- #127
- US rank
- #1834
Category grades
Schools grade is shown separately in the Schools card above.
Census & demographics
- Census place
- Aventura, FL
- County
- Miami-Dade County · 2,697,751 people
- City population
- 34,147
- Metro
- Miami-Fort Lauderdale-Pompano Beach, FL
- Population (ZIP)
- 34,147
- Household income
- $91,055
- Rent vs Own
- Severe rent burden
- 1838.0
Population outlook (Miami-Dade County) Hauer SSP2
- Today (2025)
- 3,126,439 people
- By 2030
- 3,325,765 · +6.4%
- By 2040
- 3,697,561 · +18.3%
- By 2050
- 4,012,134 · +28.3%
- By 2075
- 4,605,612 · +47.3%
- By 2100
- 4,866,598 · +55.7%
Race, ethnicity, and origin ACS 2023
- Neighborhood character
- Diverse neighborhood (Simpson 0.59)
- Race & ethnicity
- White 46% Hispanic / Latino 45% Two or more races 28% Black 2% Asian 2%
- Hispanic origin (detail)
- Mexican 2% Puerto Rican 2% Cuban 7% Dominican 1% Salvadoran 6%
- Common ancestry
- Scotch-Irish 5% Romanian 5% Italian 3%
- Foreign-born
- 52% · Canada, Jamaica, Dominican Republic
- Languages at home
- 30% English-only · Spanish 49% Other Indo-European 6% Russian/Polish/Slavic 4%
Political lean MEDSL · Miami-Dade
- 2024 margin
- R (+11.4) · D 43.9% · R 55.4%
- 2008→2024 swing
- -27.6pp toward R · 2008: 16.1pp · 2024: -11.4pp
- All cycles
- 2024: R+11.4 2020: D+7.3 2016: D+29.6 2012: D+23.7 2008: D+16.1
Not yet ingested
- Civics
- —
Market trends
- HPI YoY
- ▼ -343.81%
- Current HPI
- 234.7715
- Rent YoY
- ▼ -1.51%
- Metro
- Miami-Fort Lauderdale-Pompano Beach, FL
- State GDP YoY
- ▲ 3.28%
- F500 in state
- 36
Industry mix (Fortune 500 HQ in FL)
| Industry | F500 HQs | Revenue |
|---|---|---|
| Industrial Technology | 2 | $29B |
|
||
| Insurance | 2 | $17B |
|
||
| Retail | 1 | $60B |
|
||
| Technology Distribution | 1 | $58B |
|
||
| Homebuilding | 1 | $35B |
|
||
| Technology Manufacturing | 1 | $35B |
|
||
Price history
+394.1% since first listed17 events — show timeline
- 2026-06-10 Listed $209,000 MARMLS
- 2026-04-29 Listing Removed — MARMLS
- 2026-04-20 Price Changed $209,000 MARMLS
- 2026-03-16 Price Changed $219,000 MARMLS
- 2025-12-11 Price Changed $239,000 MARMLS
- 2025-09-04 Price Changed $248,000 MARMLS
- 2025-07-01 Price Changed $257,000 MARMLS
- 2025-07-01 Price Changed $255,000 MARMLS
- 2025-05-23 Listed $265,000 MARMLS
- 2023-08-22 Rental Removed $2,800 MARMLS
- 2023-08-16 Listed for Rent $2,800 MARMLS
- 2015-04-17 Listing Removed — MARMLS
- 2014-09-30 Listed $289,000 MARMLS
- 2011-05-05 Sold (Public Records) $85,000 Public Records
- 1995-01-11 Sold (Public Records) $59,500 Public Records
- 1995-01-01 Sold (Public Records) $59,500 Public Records
- 1977-12-01 Sold (Public Records) $42,300 Public Records
Property tax history
+5.4%/yrLatest (2025): $3,178 · -12.7% YoY. Source: county tax records.
Cash-flow waterfall
monthlySold comps — $/sqft
last 12 mo · ≤1 miLoading sold comps…