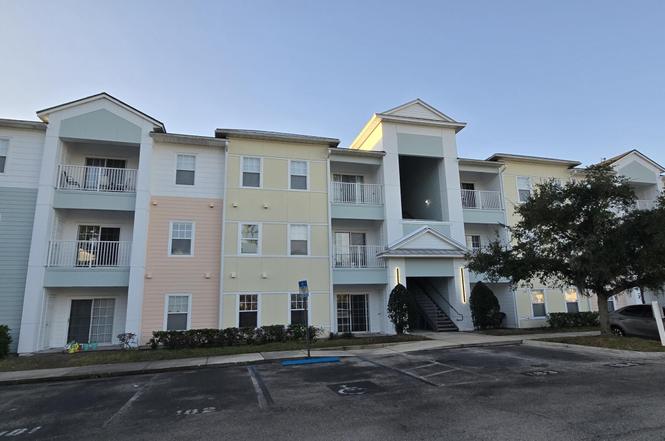
8226 Green Parrot Rd #206 · Jacksonville, FL
Flood risk 1/10 · Minimal
- FEMA flood zone
- X (unshaded)
- Chance of flooding over 30 yrs
- 0.0%
- Est. flood insurance / yr
- $507 – $1,088
Fire risk 3/10 · Minor
- Est. fire insurance / yr
- $947 – $1,759
Heat risk 9/10 · Severe
- Hot days now (above 107°F)
- 7 days/yr
- Hot days in 30 yrs
- 20 days/yr
Wind risk 9/10 · Severe
- Chance of severe wind over 30 yrs
- 99.0%
Air-quality risk 4/10 · Minor
- Unhealthy air days now
- 4 days/yr
- Unhealthy air days in 30 yrs
- 6 days/yr
Risk factors via First Street. Map © Google.
Why this score? — see what drove the D- grade
The composite is a weighted blend of 9 inputs, each scored 0–100. Each bar is that input's sub-score; the figure is the points it added to the 100-point composite (weight × sub-score).
- Cash flow +7.5/30.0
- ARV discount +7.5/15.0
- 1% rule +5.5/10.0
- Appreciation +4.2/10.0
- Livability +4.2/5.0
- Schools +3.9/10.0
- Rent growth +2.6/5.0
- Condition / age +2.5/5.0
- DSCR +1.7/10.0
$150,000
🖨 Deal sheet 📄 Offer letter ✓ Due diligence
Listing remarks
Motivated seller - Welcome to this private 2-bedroom, 2-bath second-floor unit in a gated community with peaceful water and nature views. Enjoy easy access to walking trails and a 7,400 sq ft recreation center featuring a pool, volleyball and basketball courts, fitness equipment, game tables, kitchen, and reservable event space. The unit offers updated appliances (2024) including a full-size LG washer and dryer, stainless steel refrigerator, and microwave, along with a 2020 A/C. Major exterior updates completed in 2025 include a new roof, balcony, and exterior walls. Community amenities include on-call security and maintenance, guest parking, dog-friendly areas, and a children's playground.
Key facts
- $355 HOA
- Community pool
- Built 2007
Property features AI
Finance
- Other: Unit is offered unfurnished; Community pool available (not private)
- HOA & community: Community association with monthly fee ($355); Association amenities include fitness center and playground; Association fee covers grounds maintenance and trash
Exterior
- Parking: Parking lot
- Security: Smoke detector(s)
- Utilities: Public sewer; Electricity connected; Sewer connected; Water connected
- Home design: Condominium; Property is attached; 3-story building
- Exterior features: Pond frontage; Asphalt road access
Interior
- Kitchen: Dishwasher; Electric range; Microwave; Refrigerator
- Bedrooms: 2 bedrooms
- Flooring: Carpet; Tile
- Bathrooms: 2 full bathrooms
- Heating & cooling: Central heating (electric); Central air conditioning (electric)
- Interior features: Breakfast bar; Ceiling fan(s); Split bedrooms; Balcony; Smoke detector(s)
- Laundry & utility: In-unit washer and dryer; Electric water heater
Neighborhood map
What this means for you Summary
Snapshot
- This is a 2-bed/2.0-bath condo listed at $150k.
Deal economics
- At list price, monthly cash flow is $-184 ($-2k/yr) — negative.
- To cash-flow at today's rent, offer at most $117k (21.7% below list).
- Meets the 1% rule at list price ($2k rent vs $150k).
- Recommended offer: $117k (21.7% below list) — sets the bar for cash-flow.
- Cap rate 4.8% vs local median 4.0% in Jacksonville — meaningfully above typical; check what's discounted (condition, days-on-market, listing class) to confirm the premium yield is real.
Location & tenants
- Location reads 83/100 on livability (#50 in FL, #911 nationally) — a professional / high-income tenant draw. Strengths: amenities A+, commute A+, housing A+.
- Duval (urban): math 46% / reading 45% proficiency, ranked #48 of 73 in FL (top 66%) — families likely to look elsewhere, expect single-tenant / working-renter base with shorter leases.
- Market conditions: Rents flat; 513 active listings in the ZIP; 39 comparable units currently listed for rent nearby; rentals leasing fast (median 8d on market — plan ~1-2 weeks tenant-placement turnaround); 6,503 units permitted in Duval County in 2024 (1,131 in 5+ unit buildings).
Forward outlook
- Local home prices are declining (-1.6%/yr); year-one equity from $1k of loan paydown is wiped out by about $2k of value loss. Plan a longer hold.
- Duval County population projected at +19% by 2050 — long-run rental-demand tailwind backs the buy-and-hold thesis.
Negotiation context
- It's been on market 146 days — a 12% lower offer ($132k) is reasonable based on typical stale-listing flexibility.
- 2 sale attempts; this cycle's ask has dropped $25k (14%) from the opening price — seller is motivated, your offer sets the floor, not the list.
Risks & watch-outs
- Watch-outs: HOA is 23% of rent.
- Climate carrying-cost: severe wind risk, 99% chance of damaging wind over 30y; extreme-heat days projected 7→20/yr by 2055 (HVAC capex compounding) — expect insurance premiums to compound above CPI over the hold.
Questions for the listing agent
- What do current leases actually rent for vs. the listed asking? Can we see a recent rent roll and the last 12 months of T-12 income?
- It's been on market 146 days. Have you received any prior offers? Is the seller open to a 22% concession, seller financing, or rate buy-down credit?
- What does the HOA fee cover, when was the last increase, and are there any pending special assessments or reserve-fund shortfalls?
- Any open or pending special assessments — roof, HVAC, plumbing, elevator, façade? What's the per-unit balance and payoff schedule, and is the seller paying it off at close or rolling it to the buyer?
- Why hasn't it sold? Are there any deal-killer items the seller is aware of (foundation, flood, title, zoning, code violations)?
- Is there a deadline driving the sale (1031 exchange, divorce, estate, relocation)? That informs how much negotiation room exists.
- Schools are B-rated — typically a magnet for longer-tenancy family renters. What's the average tenant stay here, and is there a school-zone premium baked into asking?
- The area grade is low — what's the realistic commute time and amenity access for the typical tenant pool here? Any planned neighborhood developments (good or bad) we should know about?
- What's the average days-on-market for RENTAL listings here right now (not sales)? A rising rental-DOM trend means longer vacancies and softer asking-rent achievability than the comps imply.
- What's the recent tenant-quality profile in this submarket — average credit score on applications, eviction rate, late-payment / NSF rate, and stable-employment percentage? A property-management company in the area should have these aggregated.
- How much new apartment / multifamily construction is in the pipeline within 1–3 miles? Heavy new supply (>2% of stock underway) typically softens rents 12–24 months out; light construction supports rent growth.
Investment metrics
- 1% rule
- 1.05% ✓
- Cap rate
- 4.82%
- Cash-on-cash
- -5.26%
- DSCR
- 0.77
- GRM
- 7.9
CMA / ARV
No comps found within radius.
Projected returns pro-forma
-1.58% appreciation · 0.39% rent growth · sell at horizon
- IRR
- -18.6%
- Equity multiple
- 0.27×
- Total profit
- $-30,665
- Equity at exit
- $32,090
- IRR
- -16.5%
- Equity multiple
- -0.15×
- Total profit
- $-48,102
- Equity at exit
- $30,302
Cash invested: $42,000 (down + closing). Projections, not guarantees.
Landlord ↔ Tenant lean methodology
- Overall (STATE)
- 87 Strongly Landlord-Friendly
- State Florida
- 87 Strongly Landlord-Friendly · R+3
- County
- — inherits STATE
- City
- — inherits STATE
ZIP-level market 32256
- Home prices YoY
- -0.7%
- Rents YoY
- 0.4%
- Active inventory
- 513
- Price-to-rent
- 7.9×
Monthly cashflow live
- Estimated rent
- $1,575 high interval (Pro) →
- Mortgage (P&I)
- −$787
- Tax from tax record
- −$224 /mo · $2,691/yr
- Insurance
- −$62
- HOA
- −$355
- Vacancy / Maint / Mgmt
- −$331
- Net cashflow
- $-184
Break-even live
UW: 25.0% down · 7.5% · 30yr · 1.5% tax · 5.0% vac · 8.0% maint · 8.0% mgmt
Financing live
Cash to close
- Down payment
- $37,500
- Closing costs
- $4,500
- Reserves months
- —
- Total cash needed
- —
Loan-product check · same deal, 3 products live
Conventional
25% down · 7.5% · 30yr
- Down + closing
- —
- Monthly P&I
- —
- Monthly cashflow
- —
- DSCR
- —
- Eligible?
- —
Personal DTI + credit; lowest rate.
DSCR
20% down · 8.5% · 30yr
- Down + closing
- —
- Monthly P&I
- —
- Monthly cashflow
- —
- DSCR
- —
- Eligible?
- —
No personal income docs; deal must DSCR.
Hard money
10% down · 12.0% · 12mo
- Down + closing
- —
- Monthly P&I
- —
- Monthly cashflow
- —
- DSCR
- —
- Eligible?
- —
Short-term bridge; refi at stabilization.
Rent comps 39 comps
| Address | Beds | Baths | Sqft | Rent | $/sqft | DOM | Units | Dist |
|---|---|---|---|---|---|---|---|---|
| 8215 Green Parrot Rd #103 Jacksonville, FL | 2.0 | 2.0 | 978 | $1,429 | $1.46 | 11d | 1 | 0.06mi |
| 5006 Key Lime Dr Jacksonville, FL | 2.0 | 2.0 | 1068 | $1,335 | $1.25 | 20d | 2 | 0.11mi |
| 5006 Key Lime Dr Jacksonville, FL | 2.0 | 2.0 | 1068 | $1,335 | $1.25 | 21d | 2 | 0.11mi |
| 4974 Key Lime Dr Jacksonville, FL | 2.0 | 2.0 | 927 | $1,650 | $1.78 | 23d | 1 | 0.12mi |
| 4931 Key Lime Dr #205 Jacksonville, FL | 2.0 | 2.0 | 927 | $1,350 | $1.46 | 21d | 1 | 0.12mi |
| 8649 A C Skinner Pkwy Jacksonville, FL | 1.0–3.0 | 1.0–2.0 | 1093 | $1,710 | $1.56 | 1d | 21 | 0.16mi |
| 8681 A C Skinner Pkwy Jacksonville, FL | 1.0–3.0 | 1.0–2.0 | 1103 | $1,744 | $1.58 | 1d | 22 | 0.22mi |
| 8409 Zenith Cir Jacksonville, FL | 2.0 | 2.5 | 1110 | $1,695 | $1.53 | 23d | 1 | 0.24mi |
| 8362 Retrograde Rd Unit 1 Jacksonville, FL | 2.0 | 2.5 | 1009 | $1,650 | $1.64 | 16d | 1 | 0.30mi |
| 8362 Retrograde Rd Jacksonville, FL | 2.0 | 3.0 | 1009 | $1,650 | $1.64 | 4d | 1 | 0.30mi |
| 8330 Zenith Cir Unit 1 Jacksonville, FL | 2.0 | 2.5 | 1109 | $1,650 | $1.49 | 23d | 1 | 0.32mi |
| 8330 Zenith Cir Jacksonville, FL | 2.0 | 3.0 | 1109 | $1,650 | $1.49 | 23d | 1 | 0.32mi |
| 8319 Zenith Cir Jacksonville, FL | 2.0 | 2.5 | 1110 | $1,700 | $1.53 | 14d | 1 | 0.33mi |
| 8317 Asteroid St Jacksonville, FL | 2.0 | 2.5 | 1109 | $1,650 | $1.49 | 23d | 1 | 0.34mi |
| 8876 A C Skinner Pkwy Jacksonville, FL | 3.0 | 1.0–3.0 | 1050 | $2,048 | $1.95 | 3d | 35 | 0.44mi |
| 8181 A C Skinner Pkwy Jacksonville, FL | 3.0 | 1.0–3.0 | 1055 | $2,641 | $2.50 | 3d | 40 | 0.53mi |
| 8450 Gate Pkwy W Jacksonville, FL | 1.0–3.0 | 1.0–2.0 | 1194 | $1,676 | $1.40 | 3d | 19 | 0.66mi |
| 7524 Southside Blvd Jacksonville, FL | 1.0–2.0 | 1.0–2.0 | 775 | $1,350 | $1.74 | 16d | 10 | 0.67mi |
| 7738 A C Skinner Pkwy Jacksonville, FL | 2.0 | 1.0–2.0 | 960 | $2,187 | $2.28 | 1d | 13 | 0.71mi |
| 8539 Gate Pkwy W Jacksonville, FL | 1.0–3.0 | 1.0–2.0 | 995 | $1,597 | $1.61 | 17d | 7 | 0.71mi |
| 8539 Gate Pkwy W Jacksonville, FL | 1.0–3.0 | 1.0–2.0 | 995 | $1,548 | $1.56 | 14d | 6 | 0.71mi |
| 8539 Gate Pkwy W Jacksonville, FL | 1.0–3.0 | 1.0–2.0 | 995 | $1,599 | $1.61 | 14d | 5 | 0.71mi |
| 8539 Gate Pkwy W Jacksonville, FL | 1.0–3.0 | 1.0–2.0 | 995 | $1,548 | $1.56 | 4d | 4 | 0.71mi |
| 9734 Tapestry Park Cir Jacksonville, FL | 1.0–3.0 | 1.0–2.0 | 1094 | $1,762 | $1.61 | 1d | 41 | 0.75mi |
| 7595 Baymeadows Cir W Jacksonville, FL | 1.0–3.0 | 1.0–2.0 | 1027 | $1,402 | $1.37 | 1d | 29 | 0.85mi |
| 8451 Gate Pkwy W Jacksonville, FL | 1.0–3.0 | 1.0–2.0 | 1107 | $1,802 | $1.63 | 10d | 21 | 0.86mi |
| 4870 Deer Lake Dr E Jacksonville, FL | 3.0 | 1.0–2.0 | 953 | $1,754 | $1.84 | 1d | 1 | 0.87mi |
| 9803 Creekfront Rd Jacksonville, FL | 1.0–3.0 | 1.0–2.0 | 1084 | $1,534 | $1.41 | 2d | 79 | 0.93mi |
| 8290 Gate Pkwy W Jacksonville, FL | 1.0–2.0 | 1.0–2.0 | 1007 | $1,600 | $1.59 | 23d | 5 | 0.97mi |
| 8290 Gate Pkwy W Jacksonville, FL | 1.0–2.0 | 1.0–2.0 | 946 | $1,450 | $1.53 | 1d | 8 | 0.97mi |
| 7740 Southside Blvd Jacksonville, FL | 1.0–3.0 | 1.0–2.0 | 1125 | $1,541 | $1.37 | 3d | 9 | 1.07mi |
| 7816 Southside Blvd Jacksonville, FL | 1.0–3.0 | 1.0–2.0 | 1115 | $2,182 | $1.96 | 1d | 1 | 1.16mi |
| 10010 Skinner Lake Dr Jacksonville, FL | 1.0–3.0 | 1.0–2.0 | 1001 | $1,574 | $1.57 | 1d | 14 | 1.20mi |
| 10640 Satori Ln Jacksonville, FL | 1.0–2.0 | 1.0–2.0 | 933 | $1,913 | $2.05 | 4d | 24 | 1.23mi |
| 7915 Baymeadows Cir E Jacksonville, FL | 1.0–3.0 | 1.0–2.5 | 1142 | $1,402 | $1.23 | 1d | 59 | 1.28mi |
| 9825 Gate Pkwy N Jacksonville, FL | 1.0–3.0 | 1.0–2.0 | 1281 | $1,790 | $1.40 | 1d | 29 | 1.30mi |
| 10000 Gate Pkwy N Jacksonville, FL | 1.0–2.0 | 1.0–2.0 | 920 | $1,550 | $1.68 | 7d | 1 | 1.33mi |
| 7932 Southside Blvd Jacksonville, FL | 1.0–2.0 | 1.0–1.5 | 925 | $1,525 | $1.65 | 23d | 1 | 1.42mi |
| 9800 Touchton Rd Jacksonville, FL | 1.0–3.0 | 1.0–2.0 | 1160 | $1,662 | $1.43 | 23d | 1 | 1.47mi |
HOA detail condo
- Monthly dues
- $355 · $4,260/yr
- Likely covers
- waterpoolsecurity
- Assessments
- None detected in remarks — confirm with the listing agent.
Listing history 16 events
-
2026-06-18days on market $150,000 Active 146 DOM
-
2026-06-17days on market $150,000 Active 145 DOM
-
2026-06-16days on market $150,000 Active 144 DOM
-
2026-06-15days on market $150,000 Active 143 DOM
-
2026-06-10days on market $150,000 Active 137 DOM
-
2026-06-08days on market $150,000 Active 136 DOM
-
2026-06-07days on market $150,000 Active 135 DOM
-
2026-06-03days on market $150,000 Active 131 DOM
-
2026-06-02days on market $150,000 Active 130 DOM
-
2026-06-01days on market $150,000 Active 129 DOM
-
2026-05-31days on market $150,000 Active 128 DOM
-
2026-04-20status Active
-
2026-04-08historical Active Under Contract
-
2026-03-01price $165,000
-
2026-02-02price $170,000
-
2026-01-23$175,000 Active
ⓘ Source: listings_history table (triggers on properties + properties_extension) + one-shot
backfill from property_details.listing_events for pre-trigger history.
Tax reassessment forecast FL · Resets to sale price
- Current annual tax
- $2,691 · $224/mo
- Projected year-2 tax
- $2,691 · $224/mo
- Expected delta
- $0/yr ($0/mo · 0.0%)
ⓘ Screening estimate from a state-policy table — verify with the county assessor before closing.
Climate risk First Street
- Flood 1/10 Low FEMA zone X (unshaded) · 0% chance over 30 yrs
- Wildfire 3/10 Moderate
- Heat 9/10 Extreme 7 d/yr ≥107°F today · 20 d/yr by 30 yrs out
- Wind 9/10 Extreme 99% chance of damaging wind over 30 yrs
- Air quality 4/10 Moderate 4 unhealthy d/yr today · 6 by 30 yrs out
Nearby sold comps map
Loading sold comps map…
Walkable amenities ~0.75 mi
Loading nearby amenities…
Taxation est. · year 1
- Rental income
- $18,898
- − Mortgage interest
- −$8,402
- − Property taxes
- −$2,691
- − Insurance
- −$750
- − Repairs & maintenance
- −$1,512
- − Management
- −$1,512
- − HOA
- −$4,260
- − Depreciation
- −$4,364
- Taxable loss
- −$4,592
- Est. tax savings @ 24.0%
- +$1,102
- After-tax cash flow
- $-1,109/yr
For passive investors: Depreciation is non-cash, so a rental often shows a tax loss while cash-flowing — sheltering income. Rental losses are passive: they offset passive income freely, and up to $25,000/yr can offset ordinary (W-2) income if you actively participate and your MAGI is under $100k (phasing out to $0 by $150k); unused losses carry forward. On sale, claimed depreciation is recaptured at up to 25%, and gains may owe capital-gains tax (a 1031 exchange can defer both). Figures are a year-1 estimate at your 24.0% rate — not tax advice; consult a CPA.
Schools (NCES district)
- District
- Duval
- NCES district ID
- 1200480
- Math proficiency
- 46% ▼ -11.00%
- Reading proficiency
- 45% ▼ -4.00%
- Median HH income
- $48,987
- Composite
- 38.97/100
- National rank
- #4076
- State rank
- #48 of 73 in FL
Livability — Jacksonville
- Score
- 83/100
- State rank
- #50
- US rank
- #911
Category grades
Schools grade is shown separately in the Schools card above.
Census & demographics
- Census place
- Jacksonville, FL
- County
- Duval County · 1,015,274 people
- City population
- 979,034
- Metro
- Jacksonville, FL
- Population (ZIP)
- 58,192
- Household income
- $73,570
- Rent vs Own
- Severe rent burden
- 2706.0
Population outlook (Duval County) Hauer SSP2
- Today (2025)
- 1,013,010 people
- By 2030
- 1,059,228 · +4.6%
- By 2040
- 1,141,439 · +12.7%
- By 2050
- 1,205,258 · +19.0%
- By 2075
- 1,324,282 · +30.7%
- By 2100
- 1,319,620 · +30.3%
Race, ethnicity, and origin ACS 2023
- Neighborhood character
- Diverse neighborhood (Simpson 0.68)
- Race & ethnicity
- White 51% Black 18% Asian 13% Hispanic / Latino 11% Two or more races 10%
- Hispanic origin (detail)
- Puerto Rican 4% Cuban 1%
- Common ancestry
- Italian 4% Lithuanian 2% Romanian 2%
- Foreign-born
- 22% · Canada, Jamaica, China
- Languages at home
- 73% English-only · Spanish 9% Other Indo-European 6% Other Asian/Pacific 3%
Political lean MEDSL · Duval
- 2024 margin
- Toss-up / Even · D 48.7% · R 50.1% · Other 1.2%
- 2008→2024 swing
- +0.4pp no change · 2008: -1.9pp · 2024: -1.5pp
- All cycles
- 2024: R+1.5 2020: D+3.8 2016: R+1.5 2012: R+3.6 2008: R+1.9
Not yet ingested
- Civics
- —
Market trends
- HPI YoY
- ▼ -1.58%
- Current HPI
- 216.5115
- Rent YoY
- ▲ 0.39%
- Metro
- Jacksonville, FL
- State GDP YoY
- ▲ 3.28%
- F500 in state
- 36
Industry mix (Fortune 500 HQ in FL)
| Industry | F500 HQs | Revenue |
|---|---|---|
| Industrial Technology | 2 | $29B |
|
||
| Insurance | 2 | $17B |
|
||
| Retail | 1 | $60B |
|
||
| Technology Distribution | 1 | $58B |
|
||
| Homebuilding | 1 | $35B |
|
||
| Technology Manufacturing | 1 | $35B |
|
||
Price history
-5.7% since first listed5 events — show timeline
- 2026-04-20 Relisted — realMLS
- 2026-04-08 Contingent — realMLS
- 2026-03-01 Price Changed $165,000 realMLS
- 2026-02-02 Price Changed $170,000 realMLS
- 2026-01-23 Listed $175,000 realMLS
Property tax history
+16.3%/yrLatest (2025): $2,691 · +2.4% YoY. Source: county tax records.
Cash-flow waterfall
monthlySold comps — $/sqft
last 12 mo · ≤1 miLoading sold comps…