1432 S Colorado Ave · Indianapolis city (balance), IN
Flood risk 1/10 · Minimal
- FEMA flood zone
- X (unshaded)
- Chance of flooding over 30 yrs
- 0.0%
- Est. flood insurance / yr
- $507 – $1,088
Fire risk 1/10 · Minimal
- Est. fire insurance / yr
- $717 – $1,331
Heat risk 3/10 · Minor
- Hot days now (above 102°F)
- 7 days/yr
- Hot days in 30 yrs
- 19 days/yr
Wind risk 2/10 · Minimal
- Chance of severe wind over 30 yrs
- 1.0%
Air-quality risk 3/10 · Minor
- Unhealthy air days now
- 2 days/yr
- Unhealthy air days in 30 yrs
- 3 days/yr
Risk factors via First Street. Map © Google.
Why this score? — see what drove the D+ grade
The composite is a weighted blend of 9 inputs, each scored 0–100. Each bar is that input's sub-score; the figure is the points it added to the 100-point composite (weight × sub-score).
- Cash flow +16.9/30.0
- ARV discount +9.4/15.0
- DSCR +5.2/10.0
- 1% rule +4.3/10.0
- Rent growth +3.2/5.0
- Livability +2.5/5.0
- Condition / age +2.5/5.0
- Schools +1.4/10.0
- Appreciation +0.0/10.0
$139,900
🖨 Deal sheet (PDF) 📄 Offer letter ✓ Due diligence
Listing remarks
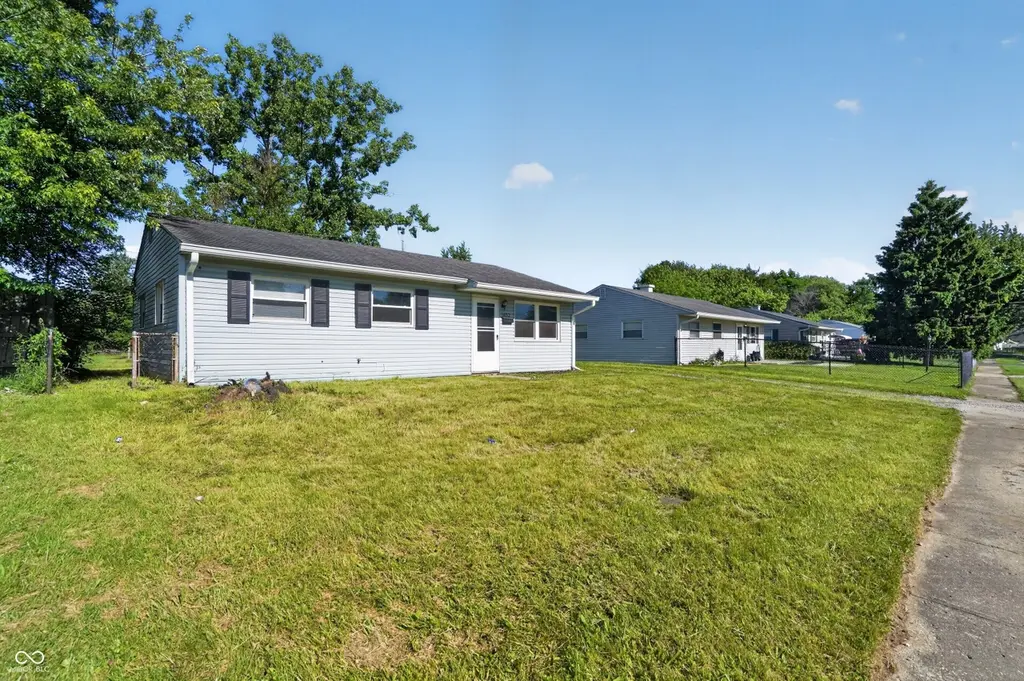
Discover the potential of single-family living at 1432 S Colorado AVE, INDIANAPOLIS, IN, USA. Built in 1960, this charming residence offers 936 square feet of comfortable living space, presenting a unique opportunity to craft your ideal home. This one-story home features two bedrooms, providing adaptable spaces for rest and personalization. The single full bathroom is thoughtfully appointed to serve the household's needs. Set on a generous 6360 square foot lot, this property offers ample outdoor space for leisure and gardening pursuits. Envision the possibilities this sizable plot holds for creating your own private retreat. Embrace the opportunity to cultivate your lifestyle in this inviti
Key facts
- Outdoor space
- Private retreat
- 6,360 sq ft lot
Tags
Property features AI
Exterior
- Parking: On-street parking; Gravel parking area
- Security: Smoke detector(s)
- Utilities: Public water; Municipal sewer connected; Natural gas service; 100 amp electric service with circuit breakers
- Home design: Single family residence; One story
- Construction: Aluminum siding; Crawl space foundation
- Exterior features: Covered patio/porch; Full yard fencing; Sidewalks; Mature trees
Interior
- Kitchen: Electric oven; Refrigerator; Range hood
- Bedrooms: 2 bedrooms (both on the main level)
- Flooring: Hardwood floors
- Bathrooms: 1 full bathroom (on the main level)
- Heating & cooling: Forced air heating (natural gas); Central air; Attic fan
- Interior features: Hardwood floors; Smoke alarm
- Laundry & utility: Dedicated laundry room with sink (main level)
Neighborhood map
What this means for you Summary
Snapshot
- This is a 2-bed/1.0-bath single-family listed at $140k.
Deal economics
- At list price, monthly cash flow is $92 ($1k/yr) — positive.
- The deal already cash-flows at list — no discount required.
- To meet the 1% rule (rent ≥ 1% of price), the offer needs to be $130k (6.8% below list).
- Recommended offer: $130k (6.8% below list) — sets the bar for 1% rule.
- Cap rate 7.1% vs local median 4.4% in Indianapolis city (balance) — top-decile yield for the area; either an underpriced asset or a hidden risk that comps aren't pricing in. Stress-test before assuming the spread holds.
Location & tenants
- Location reads: area grade D — affects rentability + tenant quality, not the cash-flow math above.
- Indianapolis Public Schools (urban): math 14% / reading 20% proficiency, ranked #286 of 301 in IN (top 95%) — low school quality limits family demand, transient renter base, plan for 1-2y turnover; 77% free/reduced lunch — lower-income household profile, screen leases tightly.
- Zoned schools: Christian Park School 82 (math 8% / reading 8%, grade F, #949 of 994 statewide, top 97%, 246 students, 83% FRL); H L Harshman Middle School (math 3% / reading 16%, grade F, #316 of 330 statewide, top 96%, 549 students, 84% FRL); Arsenal Technical High School (math 6% / reading 27%, grade F, #353 of 369 statewide, top 96%, 2,366 students, 74% FRL) — zoned schools at 80% FRL track the district average.
- Market conditions: Rents rising (+2.9%/yr); 500 active listings in the ZIP; 25 comparable units currently listed for rent nearby; rentals at typical pace (median 26d on market — plan ~3-4 weeks tenant-placement turnaround); 40% of comp listings sitting > 30 days — soft ceiling on asking rent; 1,906 units permitted in Marion County in 2024 (621 in 5+ unit buildings).
Forward outlook
- Local home prices are declining (-3.0%/yr); year-one equity from $967 of loan paydown is wiped out by about $4k of value loss. Plan a longer hold.
- Marion County population projected at +18% by 2050 — long-run rental-demand tailwind backs the buy-and-hold thesis.
Negotiation context
- It's been on market 16 days — a 2% lower offer ($138k) is reasonable based on typical stale-listing flexibility.
- 3 sale attempts since 5y ago with the ask held roughly flat each time — persistent listings suggest the price (not the market) is what's stuck; bring a comps-based counter.
- Current owner paid $72k; list at $140k implies a 94% gain — meaningful room to come down on a strong offer.
Questions for the listing agent
- Built in 1960 — when were the roof, HVAC, electrical panel, plumbing, and water heater last replaced?
- Is there a deadline driving the sale (1031 exchange, divorce, estate, relocation)? That informs how much negotiation room exists.
- The area grade is low — what's the realistic commute time and amenity access for the typical tenant pool here? Any planned neighborhood developments (good or bad) we should know about?
- What's the average days-on-market for RENTAL listings here right now (not sales)? A rising rental-DOM trend means longer vacancies and softer asking-rent achievability than the comps imply.
- What's the recent tenant-quality profile in this submarket — average credit score on applications, eviction rate, late-payment / NSF rate, and stable-employment percentage? A property-management company in the area should have these aggregated.
- How much new for-sale + rental construction is in the pipeline within 1–3 miles? Heavy new supply typically softens prices + rents 12–24 months out; constrained supply supports both.
Investment metrics
- 1% rule
- 0.93% ✗
- Cap rate
- 7.08%
- Cash-on-cash
- 2.81%
- DSCR
- 1.12
- GRM
- 8.9
CMA / ARV
- ARV (on-the-fly)
- $146,016
- Comps found
- 12
Show comp detail 12 sales within ~0.75 mi
| Address | Dist | Beds/Ba | Sqft | Sold | Price | $/sf | Match |
|---|---|---|---|---|---|---|---|
| 4307 Terrace Ave | 0.06mi | 3/1.0 (+1) | 936 (0%) | 3mo | $150,000 | $160 | 90 |
| 1214 S Grant Ave | 0.18mi | 3/1.0 (+1) | 971 (+4%) | 1mo | $215,000 | $221 | 79 |
| 1159 S Bradley Ave | 0.34mi | 3/1.0 (+1) | 936 (0%) | 1mo | $86,000 | $92 | 78 |
| 4108 E Naomi St | 0.29mi | 2/1.0 | 896 (-4%) | 8mo | $135,000 | $151 | 73 |
| 4514 Rowney St | 0.19mi | 3/1.0 (+1) | 1,043 (+11%) | 3mo | $185,000 | $177 | 65 |
| 1214 S Chester Ave | 0.25mi | 2/1.0 | 796 (-15%) | 0mo | $124,000 | $156 | 63 |
| 3847 Hoyt Ave | 0.68mi | 2/1.0 | 912 (-3%) | 6mo | $75,000 | $82 | 59 |
| 1641 S Sherman Dr | 0.36mi | 3/1.0 (+1) | 1,008 (+8%) | 10mo | $110,000 | $109 | 57 |
| 1819 S Drexel Ave | 0.38mi | 3/1.0 (+1) | 1,008 (+8%) | 11mo | $175,000 | $174 | 56 |
| 4721 E Morris St | 0.44mi | 2/1.0 | 840 (-10%) | 9mo | $165,000 | $196 | 55 |
| 4903 Rowney St | 0.49mi | 2/1.0 | 1,020 (+9%) | 9mo | $43,000 | $42 | 55 |
| 3909 Hoyt Ave | 0.67mi | 2/1.0 | 864 (-8%) | 7mo | $120,000 | $139 | 50 |
Match score weights: distance 35% · size 25% · config 20% · recency 20%. Top-matched comps best support the ARV.
Projected returns pro-forma
-3.0% appreciation · 2.88% rent growth · sell at horizon
- IRR
- -12.0%
- Equity multiple
- 0.57×
- Total profit
- $-16,987
- Equity at exit
- $20,860
- IRR
- -3.0%
- Equity multiple
- 0.80×
- Total profit
- $-7,909
- Equity at exit
- $12,096
Cash invested: $39,172 (down + closing). Projections, not guarantees.
Landlord ↔ Tenant lean methodology
- Overall (STATE)
- 90 Strongly Landlord-Friendly
- State Indiana
- 90 Strongly Landlord-Friendly · R+11
- County
- — inherits STATE
- City
- — inherits STATE
ZIP-level market 46203
- Home prices YoY
- -26.7%
- Rents YoY
- 2.9%
- Active inventory
- 500
- Price-to-rent
- 8.9×
Monthly cashflow live
- Estimated rent
- $1,304 high interval (Pro) →
- Mortgage (P&I)
- −$734
- Tax from tax record
- −$146 /mo · $1,758/yr
- Insurance
- −$58
- HOA
- −$0
- Vacancy / Maint / Mgmt
- −$274
- Net cashflow
- $92
Break-even live
Sensitivity live
| Price | -10% $171 | -5% $131 | +0% $92 | +5% $52 | +10% $12 |
|---|---|---|---|---|---|
| Rent | -10% $-11 | -5% $40 | +0% $92 | +5% $143 | +10% $195 |
| Rate | -1.0pp $162 | -0.5pp $127 | base $92 | +0.5pp $55 | +1.0pp $19 |
UW: 25.0% down · 7.5% · 30yr · 1.5% tax · 5.0% vac · 8.0% maint · 8.0% mgmt
Financing live
Cash to close
- Down payment
- $34,975
- Closing costs
- $4,197
- Reserves months
- —
- Total cash needed
- —
Loan-product check · same deal, 3 products live
Conventional
25% down · 7.5% · 30yr
- Down + closing
- —
- Monthly P&I
- —
- Monthly cashflow
- —
- DSCR
- —
- Eligible?
- —
Personal DTI + credit; lowest rate.
DSCR
20% down · 8.5% · 30yr
- Down + closing
- —
- Monthly P&I
- —
- Monthly cashflow
- —
- DSCR
- —
- Eligible?
- —
No personal income docs; deal must DSCR.
Hard money
10% down · 12.0% · 12mo
- Down + closing
- —
- Monthly P&I
- —
- Monthly cashflow
- —
- DSCR
- —
- Eligible?
- —
Short-term bridge; refi at stabilization.
Rent comps 25 comps
| Address | Beds | Baths | Sqft | Rent | $/sqft | DOM | Units | Dist |
|---|---|---|---|---|---|---|---|---|
| 3518 Terrace Ave Indianapolis, IN | 3.0 | 1.0 | 864 | $1,300 | $1.50 | 45d | 1 | 0.59mi |
| 5056 Emerton Pl Unit 5046 Indianapolis, IN | 2.0 | 1.5 | 1039 | $1,245 | $1.20 | 25d | 1 | 0.69mi |
| 5056 Emerton Pl Unit 5056 Indianapolis, IN | 2.0 | 1.0 | 868 | $1,245 | $1.43 | 25d | 1 | 0.69mi |
| 3906 Hoyt Ave Indianapolis, IN | 2.0 | 1.0 | 912 | $1,250 | $1.37 | 9d | 1 | 0.70mi |
| 5010 Emerton Pl Indianapolis, IN | 2.0 | 1.5 | 1002 | $1,095 | $1.09 | 45d | 1 | 0.72mi |
| 750 S Dequincy St Indianapolis, IN | 3.0 | 1.5 | 936 | $1,500 | $1.60 | 45d | 1 | 0.75mi |
| 3441 Prospect St Indianapolis, IN | 2.0 | 1.0 | 1008 | $1,700 | $1.69 | 46d | 1 | 0.78mi |
| 3441 Prospect St Indianapolis, IN | 2.0 | 1.0 | 1008 | $1,500 | $1.49 | 25d | 1 | 0.78mi |
| 3706 Hoyt Ave Indianapolis, IN | 3.0 | 1.0 | 960 | $1,500 | $1.56 | 15d | 1 | 0.79mi |
| 3702 Hoyt Ave Indianapolis, IN | 3.0 | 2.0 | 960 | $1,500 | $1.56 | 15d | 1 | 0.79mi |
| 528 S Bosart Ave Indianapolis, IN | 3.0 | 1.0 | 720 | $1,305 | $1.81 | 45d | 1 | 0.85mi |
| 1730 Perkins Ave Indianapolis, IN | 3.0 | 1.0 | 924 | $1,300 | $1.41 | 25d | 1 | 0.93mi |
| 3012 E Minnesota St Indianapolis, IN | 2.0 | 1.0 | 767 | $1,000 | $1.30 | 25d | 1 | 0.94mi |
| 3012 E Minnesota St Indianapolis, IN | 2.0 | 1.0 | 875 | $1,000 | $1.14 | 45d | 1 | 0.94mi |
| 1505 S Rural St Indianapolis, IN | 3.0 | 1.0 | 1104 | $1,500 | $1.36 | 14d | 1 | 1.12mi |
| 4919 Orion Ave Indianapolis, IN | 2.0 | 1.0 | 766 | $875 | $1.14 | 45d | 1 | 1.22mi |
| 5131 E Burgess Ave Indianapolis, IN | 2.0 | 1.0 | 816 | $1,100 | $1.35 | 0d | 1 | 1.26mi |
| 5131 E Burgess Ave Indianapolis, IN | 2.0 | 1.0 | 816 | $1,100 | $1.35 | 45d | 1 | 1.26mi |
| 3022 English Ave Unit 3022 Indianapolis, IN | 2.0 | 1.0 | 600 | $650 | $1.08 | 45d | 1 | 1.28mi |
| 340 S Dearborn St Indianapolis, IN | 2.0 | 1.0 | 873 | $1,180 | $1.35 | 25d | 1 | 1.29mi |
| 270 S Lasalle St Indianapolis, IN | 3.0 | 2.0 | 562 | $1,329 | $2.36 | 9d | 1 | 1.33mi |
| 301 S Gray St Indianapolis, IN | 2.0 | 1.0 | 841 | $1,025 | $1.22 | 25d | 1 | 1.38mi |
| 37 S Sherman Dr Indianapolis, IN | 1.0 | 1.0 | 700 | $800 | $1.14 | 25d | 1 | 1.44mi |
| 350 S Oxford St Indianapolis, IN | 3.0 | 1.0 | 826 | $1,300 | $1.57 | 45d | 1 | 1.45mi |
| 2631 Southeastern Ave Indianapolis, IN | 3.0 | 2.0 | 1072 | $1,195 | $1.11 | 13d | 1 | 1.47mi |
Listing history 11 events
-
2026-06-21days on market $139,900 Active 16 DOM
-
2026-06-18days on market $139,900 Active 13 DOM
-
2026-06-17days on market $139,900 Active 12 DOM
-
2026-06-16days on market $139,900 Active 11 DOM
-
2026-06-15days on market $139,900 Active 10 DOM
-
2026-06-13days on market $139,900 Active 8 DOM
-
2026-06-13days on market $139,900 Active 7 DOM
-
2026-06-09days on market $139,900 Active 4 DOM
-
2026-06-08days on market $139,900 Active 3 DOM
-
2026-06-07remarks 699-char remark
-
2026-06-07$139,900 Active 2 DOM
ⓘ Source: listings_history table (triggers on properties + properties_extension) + one-shot
backfill from property_details.listing_events for pre-trigger history.
Tax reassessment forecast IN · Partial reset (capped growth)
- Current annual tax
- $1,758 · $146/mo
- Projected year-2 tax
- $1,758 · $146/mo
- Expected delta
- $0/yr ($0/mo · 0.0%)
ⓘ Screening estimate from a state-policy table — verify with the county assessor before closing.
Climate risk First Street
- Flood 1/10 Low FEMA zone X (unshaded) · 0% chance over 30 yrs
- Wildfire 1/10 Low
- Heat 3/10 Moderate 7 d/yr ≥102°F today · 19 d/yr by 30 yrs out
- Wind 2/10 Low 100% chance of damaging wind over 30 yrs
- Air quality 3/10 Moderate 2 unhealthy d/yr today · 3 by 30 yrs out
Nearby sold comps map
Loading sold comps map…
Walkable amenities ~0.75 mi
Loading nearby amenities…
Taxation est. · year 1
- Rental income
- $15,647
- − Mortgage interest
- −$7,837
- − Property taxes
- −$1,758
- − Insurance
- −$700
- − Repairs & maintenance
- −$1,252
- − Management
- −$1,252
- − Depreciation
- −$4,070
- Taxable loss
- −$1,220
- Est. tax savings @ 24.0%
- +$293
- After-tax cash flow
- $1,393/yr
For passive investors: Depreciation is non-cash, so a rental often shows a tax loss while cash-flowing — sheltering income. Rental losses are passive: they offset passive income freely, and up to $25,000/yr can offset ordinary (W-2) income if you actively participate and your MAGI is under $100k (phasing out to $0 by $150k); unused losses carry forward. On sale, claimed depreciation is recaptured at up to 25%, and gains may owe capital-gains tax (a 1031 exchange can defer both). Figures are a year-1 estimate at your 24.0% rate — not tax advice; consult a CPA.
Schools (NCES district)
- District
- Indianapolis Public Schools
- NCES district ID
- 1804770
- Math proficiency
- 14% ▼ -7.00%
- Reading proficiency
- 20% ▼ -3.00%
- Median HH income
- $32,034
- Composite
- 13.69/100
- National rank
- #9499
- State rank
- #286 of 301 in IN
Livability — Indianapolis city (balance)
No livability data for this city. (Only ~50 U.S. cities are tracked.)
Census & demographics
- Census place
- Indianapolis city (balance), IN
- County
- Marion County · 998,460 people
- City population
- 881,119
- Metro
- Indianapolis-Carmel-Anderson, IN
- Population (ZIP)
- 37,758
- Household income
- $57,393
- Rent vs Own
- Severe rent burden
- 1499.0
Population outlook (Marion County) Hauer SSP2
- Today (2025)
- 1,025,572 people
- By 2030
- 1,065,727 · +3.9%
- By 2040
- 1,141,577 · +11.3%
- By 2050
- 1,208,920 · +17.9%
- By 2075
- 1,367,288 · +33.3%
- By 2100
- 1,438,201 · +40.2%
Race, ethnicity, and origin ACS 2023
- Neighborhood character
- Predominantly White (69%)
- Race & ethnicity
- White 69% Hispanic / Latino 14% Black 12% Two or more races 8% Asian 2% Native American 1%
- Hispanic origin (detail)
- Mexican 12% Puerto Rican 1%
- Common ancestry
- Slovak 2% Lithuanian 2% Italian 1%
- Foreign-born
- 8% · Canada
- Languages at home
- 88% English-only · Spanish 10% Other Indo-European 1%
Political lean MEDSL · Marion
- 2024 margin
- Strong D (+27.7) · D 63.0% · R 35.3% · Other 1.7%
- 2008→2024 swing
- -0.7pp no change · 2008: 28.4pp · 2024: 27.7pp
- All cycles
- 2024: D+27.7 2020: D+29.1 2016: D+22.8 2012: D+22.2 2008: D+28.4
Not yet ingested
- Civics
- —
Market trends
- HPI YoY
- ▼ -127.37%
- Current HPI
- 349.579
- Rent YoY
- ▲ 2.88%
- Metro
- Indianapolis-Carmel-Anderson, IN
- State GDP YoY
- ▲ 2.90%
- F500 in state
- 18
Industry mix (Fortune 500 HQ in IN)
| Industry | F500 HQs | Revenue |
|---|---|---|
| Industrial Machinery | 2 | $37B |
|
||
| Healthcare | 1 | $177B |
|
||
| Pharmaceuticals | 1 | $45B |
|
||
| Metals / Steel | 1 | $18B |
|
||
| Agriculture | 1 | $17B |
|
||
| Packaging | 1 | $12B |
|
||
Price history
+47.3% since first listed7 events — show timeline
- 2026-06-05 Listed $139,900 MIBOR as Distributed by MLS Grid
- 2022-08-23 Sold (Public Records) $72,000 Public Records
- 2022-07-01 Relisted — MIBOR as Distributed by MLS Grid
- 2022-01-01 Listing Removed — MIBOR as Distributed by MLS Grid
- 2021-10-12 Pending — MIBOR as Distributed by MLS Grid
- 2021-10-10 Price Changed $89,900 MIBOR as Distributed by MLS Grid
- 2021-09-23 Listed $95,000 MIBOR as Distributed by MLS Grid
Property tax history
+6.8%/yrLatest (2025): $1,758 · +15.3% YoY. Source: county tax records.
Cash-flow waterfall
monthlySold comps — $/sqft
last 12 mo · ≤1 miLoading sold comps…