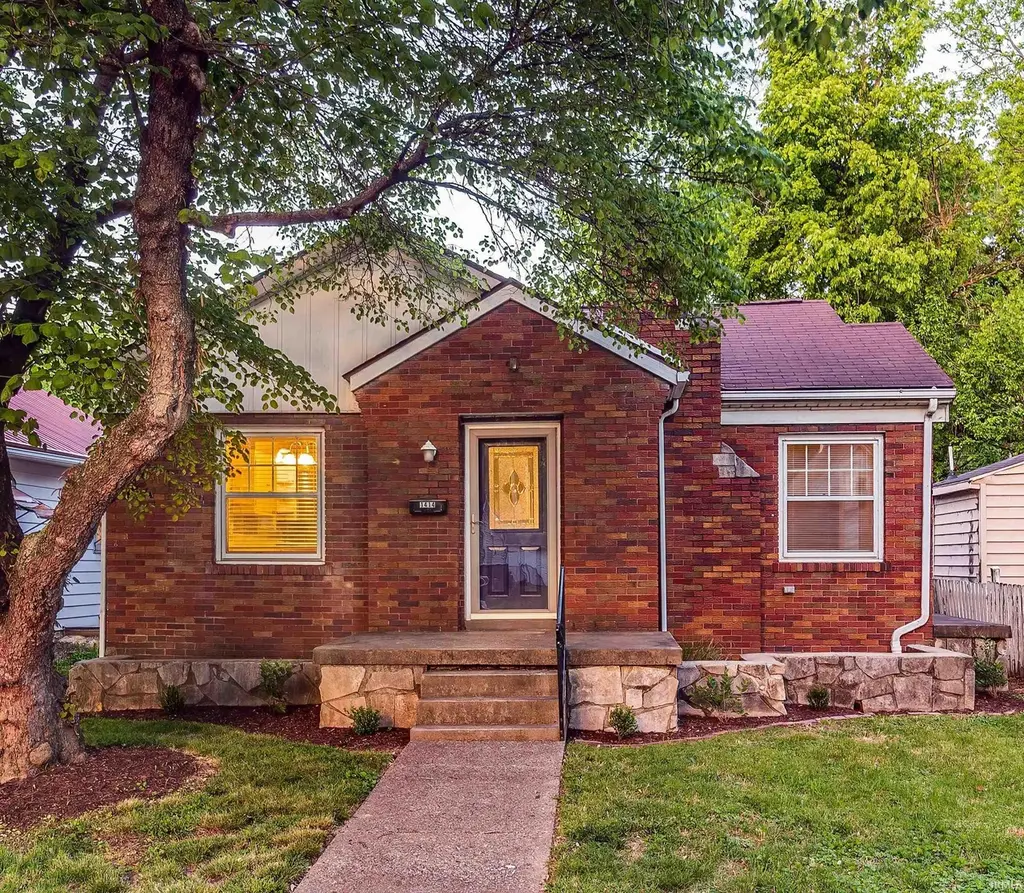
1414 Marshall Ave · Evansville, IN
Flood risk 6/10 · Moderate
- FEMA flood zone
- X
- Chance of flooding over 30 yrs
- 0.7%
- Est. flood insurance / yr
- $507 – $1,088
Fire risk 1/10 · Minimal
- Est. fire insurance / yr
- $717 – $1,331
Heat risk 5/10 · Moderate
- Hot days now (above 107°F)
- 7 days/yr
- Hot days in 30 yrs
- 19 days/yr
Wind risk 2/10 · Minimal
- Chance of severe wind over 30 yrs
- 4.0%
Air-quality risk 3/10 · Minor
- Unhealthy air days now
- 3 days/yr
- Unhealthy air days in 30 yrs
- 4 days/yr
Risk factors via First Street. Map © Google.
Why this score? — see what drove the C grade
The composite is a weighted blend of 9 inputs, each scored 0–100. Each bar is that input's sub-score; the figure is the points it added to the 100-point composite (weight × sub-score).
- Cash flow +18.2/30.0
- ARV discount +15.0/15.0
- DSCR +5.7/10.0
- 1% rule +4.7/10.0
- Rent growth +4.5/5.0
- Schools +3.3/10.0
- Livability +3.2/5.0
- Condition / age +2.5/5.0
- Appreciation +0.0/10.0
$120,000
🖨 Deal sheet 📄 Offer letter ✓ Due diligence
Listing remarks MLS
Check out this TOTALLY remodeled 2 Bedroom 1 Bathroom with a possible 3rd bedroom brick home! As you come up to the house, gaze at the brick exterior and know that this home is built to last. When you enter through the front door, hang your jacket in the coat closet and admire the FRESH PAINT and NEW CARPET. Enter into the grand living room, perfect for hosting with its built in fireplace. As you make your way to the kitchen, look at the LUXERY VINYL floors, perfect for standing up to what life throws at it. You will have a nice amount of space for a dining room table, and enjoy the cute built ins. Make your way to the bedrooms and be amazed at the size of them. This cute house wont last! Take a look at it today.
Key facts
- Original built-ins
- Solid brick bungalow
- 4,792 sq ft lot
Tags
Neighborhood map
What this means for you Summary
Snapshot
- This is a 2-bed/1.0-bath single-family listed at $120k.
Deal economics
- At list price, monthly cash flow is $108 ($1k/yr) — positive.
- The deal already cash-flows at list — no discount required.
- To meet the 1% rule (rent ≥ 1% of price), the offer needs to be $116k (3.3% below list).
- Recommended offer: $116k (3.3% below list) — sets the bar for 1% rule.
- Cap rate 7.4% vs local median 4.6% in Evansville — top-decile yield for the area; either an underpriced asset or a hidden risk that comps aren't pricing in. Stress-test before assuming the spread holds.
Location & tenants
- Location reads 63/100 on livability (#416 in IN) — a middle-class / working-renter tenant base. Strengths: cost of living A+, housing A+, health & safety A+; Watch: crime F, commute F, employment D-.
- Evansville Vanderburgh School Corporation (urban): math 36% / reading 43% proficiency, ranked #153 of 301 in IN (top 51%) — families likely to look elsewhere, expect single-tenant / working-renter base with shorter leases.
- Zoned schools: Harper Elementary School (math 32% / reading 27%, grade F, #697 of 994 statewide, top 73%, 337 students, 74% FRL); Washington Middle School (math 14% / reading 24%, grade F, #274 of 330 statewide, top 83%, 353 students, 70% FRL) — zoned schools average 72% FRL vs 50% district-wide (22 pts higher); higher-poverty schools than district average — tighter screening recommended.
- Zoned-school proficiency averages 24% at this address vs 40% district-wide (-15 pts) — the specific schools serving this property underperform the Evansville Vanderburgh School Corporation average; the district grade overstates school quality for this exact location.
- Market conditions: Rents rising fast (+7.9%/yr); 188 active listings in the ZIP; 17 comparable units currently listed for rent nearby; rentals at typical pace (median 21d on market — plan ~3-4 weeks tenant-placement turnaround); 508 units permitted in Vanderburgh County in 2024 (32 in 5+ unit buildings).
Forward outlook
- Local home prices are declining (-3.0%/yr); year-one equity from $830 of loan paydown is wiped out by about $4k of value loss. Plan a longer hold.
- At projected returns (-3.0% appreciation + 7.9% rent growth), your $34k cash investment doubles in ~10 years — after that, you're playing with house money.
Negotiation context
- Only 3 days on market — expect competitive offers; lowballing is unlikely to land.
- 3 sale attempts since 6y ago with the ask held roughly flat each time — persistent listings suggest the price (not the market) is what's stuck; bring a comps-based counter.
- Current owner paid $62k; list at $120k implies a 94% gain — meaningful room to come down on a strong offer.
Risks & watch-outs
- Watch-outs: built in 1930 — expect roof / HVAC / electrical / plumbing capex.
- Climate carrying-cost: major flood risk; extreme-heat days projected 7→19/yr by 2055 (HVAC capex compounding) — expect insurance premiums to compound above CPI over the hold.
Questions for the listing agent
- Built in 1930 — when were the roof, HVAC, electrical panel, plumbing, and water heater last replaced?
- Is there a deadline driving the sale (1031 exchange, divorce, estate, relocation)? That informs how much negotiation room exists.
- Schools are D-rated, which usually means shorter tenancies and higher turnover. Who's the typical renter profile here, and what's been the actual vacancy rate?
- Crime grade is F in this area — have there been break-ins, vandalism, or insurance claims at this property in the last 3 years? What carrier currently insures it and at what premium?
- What's the average days-on-market for RENTAL listings here right now (not sales)? A rising rental-DOM trend means longer vacancies and softer asking-rent achievability than the comps imply.
- What's the recent tenant-quality profile in this submarket — average credit score on applications, eviction rate, late-payment / NSF rate, and stable-employment percentage? A property-management company in the area should have these aggregated.
- How much new for-sale + rental construction is in the pipeline within 1–3 miles? Heavy new supply typically softens prices + rents 12–24 months out; constrained supply supports both.
Investment metrics
- 1% rule
- 0.97% ✗
- Cap rate
- 7.37%
- Cash-on-cash
- 3.85%
- DSCR
- 1.17
- GRM
- 8.6
CMA / ARV
- ARV (on-the-fly)
- $150,040
- Comps found
- 12
Show comp detail 12 sales within ~0.75 mi
| Address | Dist | Beds/Ba | Sqft | Sold | Price | $/sf | Match |
|---|---|---|---|---|---|---|---|
| 1414 Marshall Ave | 0.00mi | 3/1.0 (+1) | 1,364 (0%) | 1mo | $122,000 | $89 | 94 |
| 1101 Ravenswood Dr | 0.34mi | 2/1.0 | 1,269 (-7%) | 1mo | $155,000 | $122 | 72 |
| 951 S Rotherwood Ave | 0.50mi | 2/2.0 | 1,418 (+4%) | 2mo | $175,000 | $123 | 64 |
| 1862 Marshall Ave | 0.47mi | 3/1.0 (+1) | 1,302 (-4%) | 3mo | $65,000 | $50 | 63 |
| 1425 Covert Ave | 0.20mi | 3/1.0 (+1) | 1,183 (-13%) | 1mo | $118,000 | $100 | 63 |
| 1255 Maple Ct | 0.57mi | 2/1.5 | 1,450 (+6%) | 1mo | $159,900 | $110 | 60 |
| 1628 Washington Ave | 0.45mi | 3/2.0 (+1) | 1,453 (+6%) | 1mo | $127,500 | $88 | 59 |
| 2101 Waggoner Ave | 0.74mi | 3/1.0 (+1) | 1,268 (-7%) | 1mo | $65,000 | $51 | 48 |
| 2118 Mahrendale Ave | 0.75mi | 3/1.5 (+1) | 1,276 (-6%) | 1mo | $115,000 | $90 | 46 |
| 1809 Powell Ave | 0.64mi | 2/1.0 | 1,168 (-14%) | 1mo | $185,000 | $158 | 45 |
| 2031 Taylor Ave | 0.63mi | 3/1.5 (+1) | 1,523 (+12%) | 2mo | $200,000 | $131 | 43 |
| 1813 E Chandler Ave | 0.68mi | 3/2.0 (+1) | 1,494 (+10%) | 1mo | $235,000 | $157 | 42 |
Match score weights: distance 35% · size 25% · config 20% · recency 20%. Top-matched comps best support the ARV.
Projected returns pro-forma
-3.0% appreciation · 7.86% rent growth · sell at horizon
- IRR
- -5.0%
- Equity multiple
- 0.80×
- Total profit
- $-6,619
- Equity at exit
- $17,892
- IRR
- 9.6%
- Equity multiple
- 1.90×
- Total profit
- $30,123
- Equity at exit
- $10,375
Cash invested: $33,600 (down + closing). Projections, not guarantees.
Landlord ↔ Tenant lean methodology
- Overall (STATE)
- 90 Strongly Landlord-Friendly
- State Indiana
- 90 Strongly Landlord-Friendly · R+11
- County
- — inherits STATE
- City
- — inherits STATE
ZIP-level market 47714
- Rents YoY
- 7.9%
- Active inventory
- 188
- Price-to-rent
- 8.6×
Monthly cashflow live
- Estimated rent
- $1,161 high interval (Pro) →
- Mortgage (P&I)
- −$629
- Tax from tax record
- −$130 /mo · $1,560/yr
- Insurance
- −$50
- HOA
- −$0
- Vacancy / Maint / Mgmt
- −$244
- Net cashflow
- $108
Break-even live
UW: 25.0% down · 7.5% · 30yr · 1.5% tax · 5.0% vac · 8.0% maint · 8.0% mgmt
Financing live
Cash to close
- Down payment
- $30,000
- Closing costs
- $3,600
- Reserves months
- —
- Total cash needed
- —
Loan-product check · same deal, 3 products live
Conventional
25% down · 7.5% · 30yr
- Down + closing
- —
- Monthly P&I
- —
- Monthly cashflow
- —
- DSCR
- —
- Eligible?
- —
Personal DTI + credit; lowest rate.
DSCR
20% down · 8.5% · 30yr
- Down + closing
- —
- Monthly P&I
- —
- Monthly cashflow
- —
- DSCR
- —
- Eligible?
- —
No personal income docs; deal must DSCR.
Hard money
10% down · 12.0% · 12mo
- Down + closing
- —
- Monthly P&I
- —
- Monthly cashflow
- —
- DSCR
- —
- Eligible?
- —
Short-term bridge; refi at stabilization.
Rent comps 17 comps
| Address | Beds | Baths | Sqft | Rent | $/sqft | DOM | Units | Dist |
|---|---|---|---|---|---|---|---|---|
| 1133 Bayard Park Dr Unit B Evansville, IN | 2.0 | 1.0 | 990 | $800 | $0.81 | 21d | 1 | 0.60mi |
| 1952 Colts Ln Evansville, IN | 1.0–3.0 | 1.0 | 1146 | $1,035 | $0.90 | 21d | 8 | 0.82mi |
| 1762 Spring Ct Evansville, IN | 2.0 | 1.0 | 975 | $1,450 | $1.49 | 21d | 1 | 0.83mi |
| 605 Madison Ave Evansville, IN | 2.0 | 1.0 | 1069 | $1,375 | $1.29 | 21d | 1 | 0.92mi |
| 734 Bayard Park Dr Evansville, IN | 3.0 | 2.0 | 1000 | $1,425 | $1.43 | 21d | 1 | 0.95mi |
| 2340 Sunburst Blvd Unit 2200-202 Evansville, IN | 3.0 | 1.0 | 973 | $1,050 | $1.08 | 21d | 1 | 1.00mi |
| 2001 S Taft Ave Evansville, IN | 3.0 | 2.0 | 1472 | $1,000 | $0.68 | 21d | 1 | 1.17mi |
| 304 S Grand Ave Evansville, IN | 2.0 | 1.0 | 967 | $955 | $0.99 | 21d | 1 | 1.23mi |
| 827 Judson St Evansville, IN | 3.0 | 1.0 | 1008 | $1,295 | $1.28 | 13d | 1 | 1.28mi |
| 210 S Weinbach Ave Evansville, IN | 3.0 | 1.0 | 1080 | $1,450 | $1.34 | 21d | 1 | 1.31mi |
| 900 S Saint James Blvd Evansville, IN | 3.0 | 2.0 | 1118 | $1,450 | $1.30 | 21d | 1 | 1.33mi |
| 1604 Marbo Ave Evansville, IN | 2.0 | 1.0 | 900 | $1,095 | $1.22 | 21d | 1 | 1.35mi |
| 1321 E Indiana St Evansville, IN | 2.0 | 1.0 | 964 | $1,050 | $1.09 | 13d | 1 | 1.38mi |
| 1303 E Indiana St Evansville, IN | 2.0 | 1.0 | 975 | $1,195 | $1.23 | 13d | 1 | 1.38mi |
| 1713 Hawthorne Ave Evansville, IN | 3.0 | 2.0 | 1204 | $1,395 | $1.16 | 21d | 1 | 1.40mi |
| 17 Washington Ave Evansville, IN | 2.0 | 1.0 | 882 | $1,455 | $1.65 | 21d | 1 | 1.42mi |
| 2947 Ravenswood Dr Unit 2927 Evansville, IN | 2.0 | 1.0 | 1150 | $975 | $0.85 | 21d | 1 | 1.44mi |
Listing history 7 events
-
2026-04-26status Pending
-
2026-04-23$120,000 Active
-
2024-03-21historical $1,060
-
2024-02-01price $1,060
-
2024-01-25$1,090
-
2020-08-28soldstatus $61,900 722-char remark
Show marketing remark (722 chars)
Check out this TOTALLY remodeled 2 Bedroom 1 Bathroom with a possible 3rd bedroom brick home! As you come up to the house, gaze at the brick exterior and know that this home is built to last. When you enter through the front door, hang your jacket in the coat closet and admire the FRESH PAINT and NEW CARPET. Enter into the grand living room, perfect for hosting with its built in fireplace. As you make your way to the kitchen, look at the LUXERY VINYL floors, perfect for standing up to what life throws at it. You will have a nice amount of space for a dining room table, and enjoy the cute built ins. Make your way to the bedrooms and be amazed at the size of them. This cute house wont last! Take a look at it today.
-
2020-03-19$64,900 722-char remark
Show marketing remark (722 chars)
Check out this TOTALLY remodeled 2 Bedroom 1 Bathroom with a possible 3rd bedroom brick home! As you come up to the house, gaze at the brick exterior and know that this home is built to last. When you enter through the front door, hang your jacket in the coat closet and admire the FRESH PAINT and NEW CARPET. Enter into the grand living room, perfect for hosting with its built in fireplace. As you make your way to the kitchen, look at the LUXERY VINYL floors, perfect for standing up to what life throws at it. You will have a nice amount of space for a dining room table, and enjoy the cute built ins. Make your way to the bedrooms and be amazed at the size of them. This cute house wont last! Take a look at it today.
ⓘ Source: listings_history table (triggers on properties + properties_extension) + one-shot
backfill from property_details.listing_events for pre-trigger history.
Tax reassessment forecast IN · Partial reset (capped growth)
- Current annual tax
- $1,560 · $130/mo
- Projected year-2 tax
- $1,560 · $130/mo
- Expected delta
- $0/yr ($0/mo · 0.0%)
ⓘ Screening estimate from a state-policy table — verify with the county assessor before closing.
Climate risk First Street
- Flood 6/10 Major FEMA zone X · 70% chance over 30 yrs
- Wildfire 1/10 Low
- Heat 5/10 Major 7 d/yr ≥107°F today · 19 d/yr by 30 yrs out
- Wind 2/10 Low 4% chance of damaging wind over 30 yrs
- Air quality 3/10 Moderate 3 unhealthy d/yr today · 4 by 30 yrs out
Nearby sold comps map
Loading sold comps map…
Walkable amenities ~0.75 mi
Loading nearby amenities…
Taxation est. · year 1
- Rental income
- $13,931
- − Mortgage interest
- −$6,722
- − Property taxes
- −$1,560
- − Insurance
- −$600
- − Repairs & maintenance
- −$1,114
- − Management
- −$1,114
- − Depreciation
- −$3,491
- Taxable loss
- −$671
- Est. tax savings @ 24.0%
- +$161
- After-tax cash flow
- $1,455/yr
For passive investors: Depreciation is non-cash, so a rental often shows a tax loss while cash-flowing — sheltering income. Rental losses are passive: they offset passive income freely, and up to $25,000/yr can offset ordinary (W-2) income if you actively participate and your MAGI is under $100k (phasing out to $0 by $150k); unused losses carry forward. On sale, claimed depreciation is recaptured at up to 25%, and gains may owe capital-gains tax (a 1031 exchange can defer both). Figures are a year-1 estimate at your 24.0% rate — not tax advice; consult a CPA.
Schools (NCES district)
- District
- Evansville Vanderburgh School Corporation
- NCES district ID
- 1803450
- Math proficiency
- 36% ▼ -7.00%
- Reading proficiency
- 43% ▼ -3.00%
- Median HH income
- $43,270
- Composite
- 33.41/100
- National rank
- #5471
- State rank
- #153 of 301 in IN
Livability — Evansville
- Score
- 63/100
- State rank
- #416
- US rank
- #15047
Category grades
Schools grade is shown separately in the Schools card above.
Census & demographics
- Census place
- Evansville, IN
- County
- Vanderburgh County · 146,793 people
- City population
- 146,793
- Metro
- Evansville, IN-KY
- Population (ZIP)
- 32,132
- Household income
- $55,910
- Rent vs Own
- Severe rent burden
- 1394.0
Population outlook (Vanderburgh County) Hauer SSP2
- Today (2025)
- 187,038 people
- By 2030
- 188,907 · +1.0%
- By 2040
- 190,272 · +1.7%
- By 2050
- 188,871 · +1.0%
- By 2075
- 180,751 · -3.4%
- By 2100
- 163,015 · -12.8%
Race, ethnicity, and origin ACS 2023
- Neighborhood character
- Predominantly White (71%)
- Race & ethnicity
- White 71% Black 17% Two or more races 6% Hispanic / Latino 6% Asian 1%
- Hispanic origin (detail)
- Mexican 3%
- Common ancestry
- Italian 3% Lithuanian 2% Slovak 1%
- Foreign-born
- 6% · Canada, China
- Languages at home
- 92% English-only · Spanish 4% Other Asian/Pacific 1% French/Haitian/Cajun 1%
Political lean MEDSL · Vanderburgh
- 2024 margin
- R (+12.7) · D 43.0% · R 55.6% · Other 1.4%
- 2008→2024 swing
- -15.1pp toward R · 2008: 2.5pp · 2024: -12.7pp
- All cycles
- 2024: R+12.7 2020: R+9.6 2016: R+16.9 2012: R+10.8 2008: D+2.5
Not yet ingested
- Civics
- —
Market trends
- HPI YoY
- ▼ -124.80%
- Current HPI
- 211.1755
- Rent YoY
- ▲ 7.86%
- Metro
- Evansville, IN-KY
- State GDP YoY
- ▲ 2.90%
- F500 in state
- 18
Industry mix (Fortune 500 HQ in IN)
| Industry | F500 HQs | Revenue |
|---|---|---|
| Industrial Machinery | 2 | $37B |
|
||
| Healthcare | 1 | $177B |
|
||
| Pharmaceuticals | 1 | $45B |
|
||
| Metals / Steel | 1 | $18B |
|
||
| Agriculture | 1 | $17B |
|
||
| Packaging | 1 | $12B |
|
||
Price history
+84.9% since first listed7 events — show timeline
- 2026-04-26 Pending — IRMLS
- 2026-04-23 Listed $120,000 IRMLS
- 2024-03-21 Rental Removed $1,060 RENTLY
- 2024-02-01 Price Changed $1,060 RENTLY
- 2024-01-25 Listed for Rent $1,090 RENTLY
- 2020-08-28 Sold (MLS) $61,900 IRMLS
- 2020-03-19 Listed $64,900 IRMLS
Property tax history
-2.2%/yrLatest (2024): $1,560 · +0.3% YoY. Source: county tax records.
Cash-flow waterfall
monthlySold comps — $/sqft
last 12 mo · ≤1 miLoading sold comps…