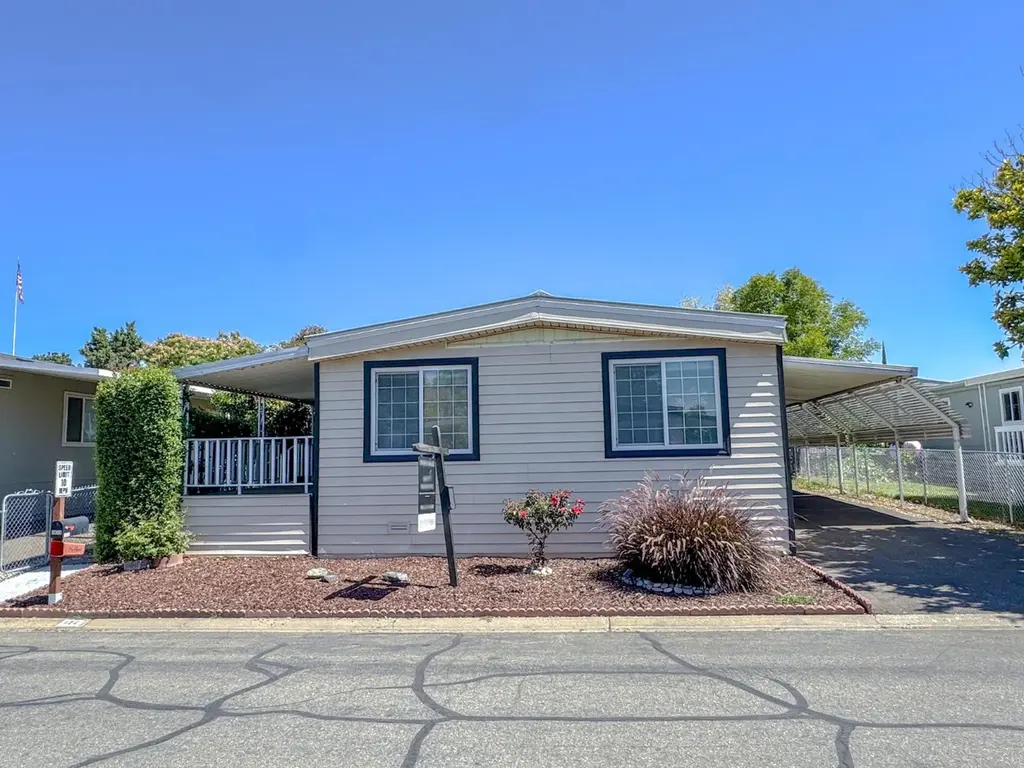
5833 Stonyford #122 · Foothill Farms, CA
Flood risk 1/10 · Minimal
- FEMA flood zone
- X (unshaded)
- Chance of flooding over 30 yrs
- 0.0%
- Est. flood insurance / yr
- $507 – $1,088
Fire risk 2/10 · Minimal
- Est. fire insurance / yr
- $659 – $1,223
Heat risk 7/10 · Major
- Hot days now (above 103°F)
- 7 days/yr
- Hot days in 30 yrs
- 15 days/yr
Wind risk 1/10 · Minimal
- Chance of severe wind over 30 yrs
- —
Air-quality risk 10/10 · Severe
- Unhealthy air days now
- 34 days/yr
- Unhealthy air days in 30 yrs
- 36 days/yr
Risk factors via First Street. Map © Google.
Why this score? — see what drove the C+ grade
The composite is a weighted blend of 9 inputs, each scored 0–100. Each bar is that input's sub-score; the figure is the points it added to the 100-point composite (weight × sub-score).
- Cash flow +30.0/30.0
- 1% rule +10.0/10.0
- DSCR +10.0/10.0
- Rent growth +4.1/5.0
- Livability +3.2/5.0
- Schools +3.1/10.0
- Condition / age +2.5/5.0
- ARV discount +1.3/15.0
- Appreciation +0.0/10.0
$134,900
🖨 Deal sheet 📄 Offer letter ✓ Due diligence
Listing remarks
Charming doublewide 3-bedroom, 2-bath mobile home located in the all-ages Meadowbrook Mobile Home Park! Recently updated within the last 5 years - improvements include, updated white cabinets with gold hardware, counters and appliances, water heater, HVAC system, laminate flooring, remodeled bathrooms, and dual-pane windows throughout. The open floorplan offers a bright and comfortable living space, large bedrooms and a primary suite with spacious attached bathroom. Outside, enjoy an oversized private covered patio, a spacious fenced yard with garden beds, hybrid apple tree, and plenty of room for pets, play, or relaxing outdoors. Additional features include a large 2-car carport and extra
Key facts
- Spacious fenced yard
- Dual-pane windows
- Gold hardware
Tags
Property features AI
Finance
- Other: Address: 5833 Stonyford #122, Sacramento, CA 95842
- Financial info: Land lease amount listed ($1,140) — verify applicability
- HOA & community: No association; Not a senior community; Not land-leased
Exterior
- Parking: Attached covered parking; Guest parking available; No garage
- Utilities: Public water; Public sewer; Cable available; Internet available; Individual electric meter; Individual gas meter
- Home design: Manufactured home in park; Double-wide; Built in 1977; Updated/remodeled
- Construction: Vinyl skirting; Manufactured construction (Bendix)
- Exterior features: Metal roof; Regular-shaped lot
Interior
- Kitchen: Free-standing gas range; Dishwasher; Garbage disposal; Microwave; Dining space in kitchen
- Bedrooms: 3 bedrooms
- Flooring: Laminate flooring; Vinyl flooring
- Bathrooms: 2 full bathrooms; Tubs with shower over
- Heating & cooling: Central heating; Central air conditioning
- Interior features: Updated/remodeled interior; Great room living area; Covered carpeted patio; Synthetic countertops; Pets allowed with number and size limits
- Laundry & utility: Indoor laundry room with hookups only; 220V outlet in laundry
Neighborhood map
What this means for you Summary
Snapshot
- This is a 3-bed/2.0-bath manufactured listed at $135k.
Deal economics
- At list price, monthly cash flow is $1k ($12k/yr) — positive.
- The deal already cash-flows at list — no discount required.
- Meets the 1% rule at list price ($2k rent vs $135k).
- Recommended offer: $133k (1.5% below list) — sets the bar for market timing.
- Cap rate 15.5% vs local median 3.9% in Foothill Farms — top-decile yield for the area; either an underpriced asset or a hidden risk that comps aren't pricing in. Stress-test before assuming the spread holds.
Location & tenants
- Location reads 64/100 on livability (#433 in CA) — a middle-class / working-renter tenant base. Strengths: housing A+, schools A; Watch: employment D+, crime F, amenities F.
- Twin Rivers Unified (suburban): math 29% / reading 37% proficiency, ranked #970 of 1,400 in CA (top 69%) — families likely to look elsewhere, expect single-tenant / working-renter base with shorter leases; 76% free/reduced lunch — lower-income household profile, screen leases tightly.
- Market conditions: Rents rising fast (+6.5%/yr); 130 active listings in the ZIP; 26 comparable units currently listed for rent nearby; rentals at typical pace (median 15d on market — plan ~3-4 weeks tenant-placement turnaround); 6,825 units permitted in Sacramento County in 2024 (1,752 in 5+ unit buildings).
- This rent runs 40% of the median local income ($68k/yr) — at the standard rent-burdened threshold; future hikes will face affordability resistance.
Forward outlook
- Local home prices are declining (-3.0%/yr); year-one equity from $933 of loan paydown is wiped out by about $4k of value loss. Plan a longer hold.
- Sacramento County population projected at +17% by 2050 — long-run rental-demand tailwind backs the buy-and-hold thesis.
- At projected returns (-3.0% appreciation + 6.5% rent growth), your $38k cash investment doubles in ~4 years — after that, you're playing with house money.
Negotiation context
- It's been on market 27 days — a 2% lower offer ($133k) is reasonable based on typical stale-listing flexibility.
Risks & watch-outs
- Climate carrying-cost: extreme-heat days projected 7→15/yr by 2055 (HVAC capex compounding) — expect insurance premiums to compound above CPI over the hold.
Questions for the listing agent
- Built in 1977 — when were the roof, HVAC, electrical panel, plumbing, and water heater last replaced?
- Is there a deadline driving the sale (1031 exchange, divorce, estate, relocation)? That informs how much negotiation room exists.
- Schools are A-rated — typically a magnet for longer-tenancy family renters. What's the average tenant stay here, and is there a school-zone premium baked into asking?
- Crime grade is F in this area — have there been break-ins, vandalism, or insurance claims at this property in the last 3 years? What carrier currently insures it and at what premium?
- What's the average days-on-market for RENTAL listings here right now (not sales)? A rising rental-DOM trend means longer vacancies and softer asking-rent achievability than the comps imply.
- What's the recent tenant-quality profile in this submarket — average credit score on applications, eviction rate, late-payment / NSF rate, and stable-employment percentage? A property-management company in the area should have these aggregated.
- How much new for-sale + rental construction is in the pipeline within 1–3 miles? Heavy new supply typically softens prices + rents 12–24 months out; constrained supply supports both.
Investment metrics
- 1% rule
- 1.71% ✓
- Cap rate
- 15.46%
- Cash-on-cash
- 32.73%
- DSCR
- 2.46
- GRM
- 4.9
CMA / ARV
- ARV (on-the-fly)
- $118,656
- Comps found
- 12
Show comp detail 12 sales within ~0.75 mi
| Address | Dist | Beds/Ba | Sqft | Sold | Price | $/sf | Match |
|---|---|---|---|---|---|---|---|
| 7324 Azimuth Ln #19 | 0.10mi | 3/2.0 | 1,120 (-3%) | 7mo | $114,900 | $103 | 84 |
| 5832 Stonyford Ln #114 | 0.02mi | 3/2.0 | 1,152 (0%) | 21mo | $130,000 | $113 | 82 |
| 7600 Golden Eye Ln #43 | 0.39mi | 3/2.0 | 1,136 (-1%) | 1mo | $182,500 | $161 | 79 |
| 7425 Sylmar Ln #181 | 0.10mi | 3/2.0 | 1,272 (+10%) | 10mo | $140,000 | $110 | 69 |
| 5831 Eureka | 0.04mi | 2/2.0 (-1) | 1,238 (+8%) | 14mo | $128,500 | $104 | 69 |
| 5825 Hobbs Ln #68 | 0.08mi | 2/2.0 (-1) | 1,000 (-13%) | 1mo | $100,000 | $100 | 68 |
| 7408 Azimuth Ln #242 | 0.12mi | 3/2.0 | 1,000 (-13%) | 6mo | $103,000 | $103 | 68 |
| 5839 Eureka | 0.04mi | 3/2.0 | 1,306 (+13%) | 13mo | $125,000 | $96 | 65 |
| 5913 Cackler Ln #62 | 0.35mi | 2/2.0 (-1) | 1,244 (+8%) | 1mo | $126,000 | $101 | 65 |
| 7405 Sylmar Ln #186 | 0.12mi | 3/2.0 | 1,320 (+15%) | 11mo | $153,000 | $116 | 61 |
| 6005 Cackler Ln #55 | 0.39mi | 2/2.0 (-1) | 1,152 (0%) | 20mo | $105,000 | $91 | 60 |
| 7516 Scaup Ln | 0.33mi | 2/2.0 (-1) | 1,248 (+8%) | 7mo | $123,000 | $99 | 60 |
Match score weights: distance 35% · size 25% · config 20% · recency 20%. Top-matched comps best support the ARV.
Projected returns pro-forma
-3.0% appreciation · 6.52% rent growth · sell at horizon
- IRR
- 31.5%
- Equity multiple
- 2.38×
- Total profit
- $52,155
- Equity at exit
- $20,114
- IRR
- 40.4%
- Equity multiple
- 5.42×
- Total profit
- $166,965
- Equity at exit
- $11,664
Cash invested: $37,772 (down + closing). Projections, not guarantees.
Landlord ↔ Tenant lean methodology
- Overall (STATE)
- 18 Strongly Tenant-Friendly
- State California
- 18 Strongly Tenant-Friendly · D+13
- County
- — inherits STATE
- City
- — inherits STATE
ZIP-level market 95842
- Home prices YoY
- -30.3%
- Rents YoY
- 6.5%
- Active inventory
- 130
- Price-to-rent
- 4.9×
Monthly cashflow live
- Estimated rent
- $2,304 high interval (Pro) →
- Mortgage (P&I)
- −$707
- Tax from tax record
- −$26 /mo · $312/yr
- Insurance
- −$56
- HOA
- −$0
- Vacancy / Maint / Mgmt
- −$484
- Net cashflow
- $1,030
Break-even live
UW: 25.0% down · 7.5% · 30yr · 1.5% tax · 5.0% vac · 8.0% maint · 8.0% mgmt
Financing live
Cash to close
- Down payment
- $33,725
- Closing costs
- $4,047
- Reserves months
- —
- Total cash needed
- —
Loan-product check · same deal, 3 products live
Conventional
25% down · 7.5% · 30yr
- Down + closing
- —
- Monthly P&I
- —
- Monthly cashflow
- —
- DSCR
- —
- Eligible?
- —
Personal DTI + credit; lowest rate.
DSCR
20% down · 8.5% · 30yr
- Down + closing
- —
- Monthly P&I
- —
- Monthly cashflow
- —
- DSCR
- —
- Eligible?
- —
No personal income docs; deal must DSCR.
Hard money
10% down · 12.0% · 12mo
- Down + closing
- —
- Monthly P&I
- —
- Monthly cashflow
- —
- DSCR
- —
- Eligible?
- —
Short-term bridge; refi at stabilization.
Rent comps 26 comps
| Address | Beds | Baths | Sqft | Rent | $/sqft | DOM | Units | Dist |
|---|---|---|---|---|---|---|---|---|
| 7761 Pompei Ct Unit 7763 Citrus Heights, CA | 2.0 | 1.0 | 900 | $1,705 | $1.89 | 23d | 1 | 0.69mi |
| 6413 Tupelo Dr Citrus Heights, CA | 1.0–2.0 | 1.0–2.0 | 775 | $2,000 | $2.58 | 1d | 10 | 0.71mi |
| 5411 Vichy Cir Antelope, CA | 2.0 | 2.0 | 886 | $2,375 | $2.68 | 1d | 1 | 0.72mi |
| 6319 Misty Wood Way Citrus Heights, CA | 3.0 | 2.0 | 1454 | $2,500 | $1.72 | 43d | 1 | 0.82mi |
| 7613 Luzern Way Antelope, CA | 3.0 | 2.0 | 1401 | $2,500 | $1.78 | 11d | 1 | 0.83mi |
| 7827 Zenith Dr Citrus Heights, CA | 2.0 | 2.0 | 1031 | $1,995 | $1.94 | 14d | 1 | 0.86mi |
| 7629 Downing Place Way Antelope, CA | 3.0 | 2.0 | 1200 | $2,600 | $2.17 | 1d | 1 | 0.91mi |
| 6913 Gold Run Ave Sacramento, CA | 4.0 | 2.0 | 1474 | $2,800 | $1.90 | 20d | 1 | 0.94mi |
| 7915 Zenith Dr Citrus Heights, CA | 2.0 | 1.0 | 1015 | $1,895 | $1.87 | 21d | 1 | 0.96mi |
| 7137 Reyn Oaks Way Sacramento, CA | 3.0 | 2.0 | 1279 | $2,450 | $1.92 | 1d | 1 | 1.06mi |
| 7137 Reyn Oaks Way Sacramento, CA | 3.0 | 2.0 | 1279 | $2,455 | $1.92 | 12d | 1 | 1.06mi |
| 7632 Van Maren Ln Unit 1 Citrus Heights, CA | 4.0 | 2.0 | 1300 | $2,495 | $1.92 | 14d | 1 | 1.09mi |
| 6841 Concert Way Sacramento, CA | 2.0 | 2.0 | 1000 | $1,995 | $2.00 | 1d | 1 | 1.09mi |
| 7120 Van Maren Ln Citrus Heights, CA | 3.0 | 2.0 | 1292 | $2,495 | $1.93 | 17d | 1 | 1.12mi |
| 8077 Cornerstone Way Citrus Heights, CA | 4.0 | 2.0 | 1380 | $2,795 | $2.03 | 43d | 1 | 1.20mi |
| 5109 Andrea Blvd Sacramento, CA | 2.0 | 1.0 | 828 | $1,769 | $2.14 | 1d | 2 | 1.20mi |
| 5417 Olympic Way Sacramento, CA | 2.0 | 1.0 | 920 | $1,795 | $1.95 | 14d | 1 | 1.23mi |
| 7135 Cobalt Way Citrus Heights, CA | 3.0 | 1.0 | 1200 | $1,995 | $1.66 | 4d | 1 | 1.23mi |
| 4901 Adorn Ct Sacramento, CA | 3.0 | 2.0 | 1361 | $2,450 | $1.80 | 1d | 1 | 1.25mi |
| 6430 Verner Ave Sacramento, CA | 1.0–2.0 | 1.0–2.0 | 705 | $2,295 | $3.25 | 23d | 1 | 1.28mi |
| 7330 Stratford Pl #706 Sacramento, CA | 3.0 | 2.0 | 1322 | $2,600 | $1.97 | 1d | 1 | 1.31mi |
| 7139 Baranga Dr Citrus Heights, CA | 3.0 | 1.5 | 1162 | $2,500 | $2.15 | 2d | 1 | 1.40mi |
| 6219 Oak Valley Ln Citrus Heights, CA | 3.0 | 2.5 | 1304 | $2,295 | $1.76 | 43d | 1 | 1.42mi |
| 6219 Oak Valley Ln Citrus Heights, CA | 3.0 | 3.0 | 1304 | $2,295 | $1.76 | 17d | 1 | 1.42mi |
| 6544 Auburn Blvd Citrus Heights, CA | 2.0 | 2.0 | 800 | $1,850 | $2.31 | 23d | 1 | 1.47mi |
| 6546 Auburn Blvd Citrus Heights, CA | 2.0 | 1.0 | 624 | $1,853 | $2.97 | 4d | 10 | 1.48mi |
Listing history 13 events
-
2026-06-18days on market $134,900 Active 27 DOM
-
2026-06-17days on market $134,900 Active 26 DOM
-
2026-06-16days on market $134,900 Active 25 DOM
-
2026-06-15days on market $134,900 Active 24 DOM
-
2026-06-13days on market $134,900 Active 22 DOM
-
2026-06-13pricedays on market $134,900 Active 21 DOM
-
2026-06-09days on market $144,900 Active 18 DOM
-
2026-06-08days on market $144,900 Active 17 DOM
-
2026-06-07days on market $144,900 Active 16 DOM
-
2026-06-03days on market $144,900 Active 12 DOM
-
2026-06-02days on market $144,900 Active 11 DOM
-
2026-06-01days on market $144,900 Active 10 DOM
-
2026-05-31days on market $144,900 Active 9 DOM
ⓘ Source: listings_history table (triggers on properties + properties_extension) + one-shot
backfill from property_details.listing_events for pre-trigger history.
Tax reassessment forecast CA · Resets to sale price
- Current annual tax
- $312 · $26/mo
- Projected year-2 tax
- $1,025 · $85/mo
- Expected delta
- +$713/yr (+$59/mo · 228.2%)
ⓘ Screening estimate from a state-policy table — verify with the county assessor before closing.
Climate risk First Street
- Flood 1/10 Low FEMA zone X (unshaded) · 0% chance over 30 yrs
- Wildfire 2/10 Low
- Heat 7/10 Severe 7 d/yr ≥103°F today · 15 d/yr by 30 yrs out
- Wind 1/10 Low
- Air quality 10/10 Extreme 34 unhealthy d/yr today · 36 by 30 yrs out
Nearby sold comps map
Loading sold comps map…
Walkable amenities ~0.75 mi
Loading nearby amenities…
Taxation est. · year 1
- Rental income
- $27,645
- − Mortgage interest
- −$7,556
- − Property taxes
- −$312
- − Insurance
- −$674
- − Repairs & maintenance
- −$2,212
- − Management
- −$2,212
- − Depreciation
- −$3,924
- Taxable income
- $10,754
- Est. tax owed @ 24.0%
- −$2,581
- After-tax cash flow
- $9,783/yr
For passive investors: Depreciation is non-cash, so a rental often shows a tax loss while cash-flowing — sheltering income. Rental losses are passive: they offset passive income freely, and up to $25,000/yr can offset ordinary (W-2) income if you actively participate and your MAGI is under $100k (phasing out to $0 by $150k); unused losses carry forward. On sale, claimed depreciation is recaptured at up to 25%, and gains may owe capital-gains tax (a 1031 exchange can defer both). Figures are a year-1 estimate at your 24.0% rate — not tax advice; consult a CPA.
Schools (NCES district)
- District
- Twin Rivers Unified
- NCES district ID
- 0601332
- Math proficiency
- 29% ▲ 2.00%
- Reading proficiency
- 37% ▲ 2.00%
- Median HH income
- $42,481
- Composite
- 30.67/100
- National rank
- #11437
- State rank
- #970 of 1400 in CA
Livability — Foothill Farms
- Score
- 64/100
- State rank
- #433
- US rank
- #14728
Category grades
Schools grade is shown separately in the Schools card above.
Census & demographics
- Census place
- Foothill Farms, CA
- County
- Sacramento County · 1,539,646 people
- City population
- 35,031
- Metro
- Sacramento-Roseville-Folsom, CA
- Population (ZIP)
- 34,034
- Household income
- $68,276
- Rent vs Own
- Severe rent burden
- 1906.0
Population outlook (Sacramento County) Hauer SSP2
- Today (2025)
- 1,660,763 people
- By 2030
- 1,732,990 · +4.3%
- By 2040
- 1,855,755 · +11.7%
- By 2050
- 1,941,335 · +16.9%
- By 2075
- 2,046,162 · +23.2%
- By 2100
- 1,961,444 · +18.1%
Race, ethnicity, and origin ACS 2023
- Neighborhood character
- Highly diverse neighborhood (Simpson 0.71)
- Race & ethnicity
- White 45% Hispanic / Latino 23% Two or more races 14% Asian 12% Black 12% Native American 1%
- Hispanic origin (detail)
- Mexican 19%
- Common ancestry
- Scotch-Irish 5% Subsaharan African 5% Lithuanian 2%
- Foreign-born
- 26% · Canada, Vietnam, South Korea
- Languages at home
- 61% English-only · Spanish 14% Russian/Polish/Slavic 11% Other Indo-European 5%
Political lean MEDSL · Sacramento
- 2024 margin
- D (+19.7) · D 58.1% · R 38.4% · Other 3.5%
- 2008→2024 swing
- +0.7pp no change · 2008: 19.0pp · 2024: 19.7pp
- All cycles
- 2024: D+19.7 2020: D+25.3 2016: D+23.7 2012: D+16.3 2008: D+19.0
Not yet ingested
- Civics
- —
Market trends
- HPI YoY
- ▼ -166.74%
- Current HPI
- 384.1812
- Rent YoY
- ▲ 6.52%
- Metro
- Sacramento-Roseville-Folsom, CA
- State GDP YoY
- ▲ 3.21%
- F500 in state
- 116
Industry mix (Fortune 500 HQ in CA)
| Industry | F500 HQs | Revenue |
|---|---|---|
| Technology | 27 | $1,492B |
|
||
| Financial Services | 3 | $174B |
|
||
| Retail | 3 | $44B |
|
||
| Insurance | 3 | $26B |
|
||
| Media / Entertainment | 2 | $115B |
|
||
| Pharmaceuticals / Biotech | 2 | $62B |
|
||
Property tax history
+3.9%/yrLatest (2025): $312 · +1.4% YoY. Source: county tax records.
Cash-flow waterfall
monthlySold comps — $/sqft
last 12 mo · ≤1 miLoading sold comps…