 Duplex
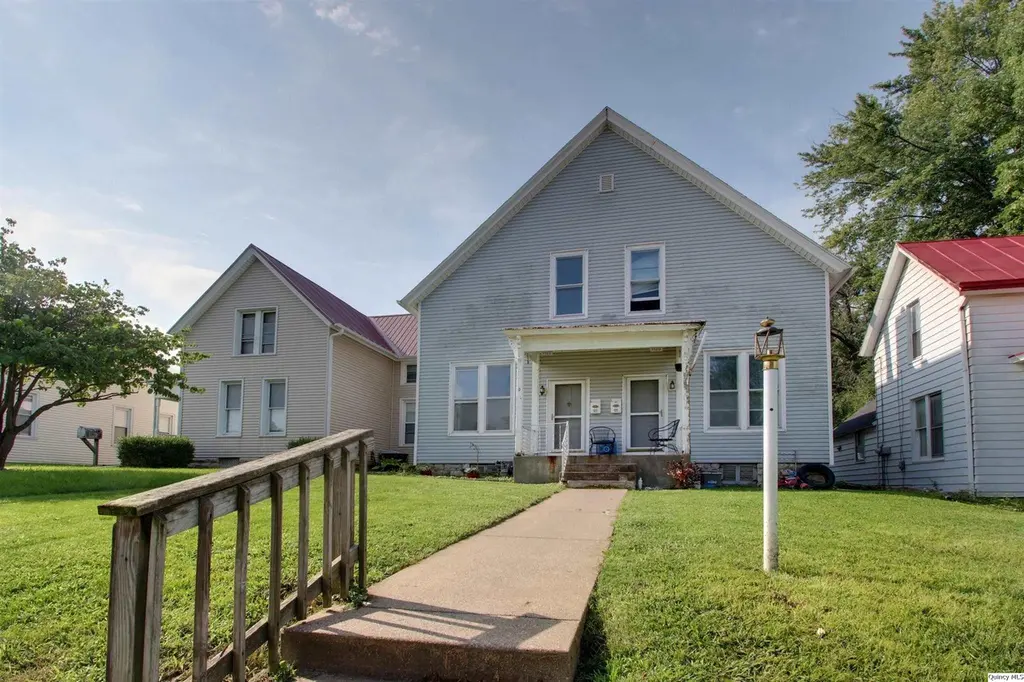
1120-1122 Washington St · Quincy, IL
Flood risk 1/10 · Minimal
- FEMA flood zone
- X (unshaded)
- Chance of flooding over 30 yrs
- 0.0%
- Est. flood insurance / yr
- $473 – $860
Fire risk 1/10 · Minimal
- Est. fire insurance / yr
- $804 – $1,492
Heat risk 4/10 · Minor
- Hot days now (above 106°F)
- 7 days/yr
- Hot days in 30 yrs
- 17 days/yr
Wind risk 2/10 · Minimal
- Chance of severe wind over 30 yrs
- —
Air-quality risk 2/10 · Minimal
- Unhealthy air days now
- 1 days/yr
- Unhealthy air days in 30 yrs
- 1 days/yr
Risk factors via First Street. Map © Google.
Why this score? — see what drove the C+ grade
The composite is a weighted blend of 9 inputs, each scored 0–100. Each bar is that input's sub-score; the figure is the points it added to the 100-point composite (weight × sub-score).
- Cash flow +30.0/30.0
- 1% rule +10.0/10.0
- DSCR +10.0/10.0
- Rent growth +5.0/5.0
- Livability +3.4/5.0
- Condition / age +2.8/5.0
- Schools +2.2/10.0
- ARV discount +0.0/15.0
- Appreciation +0.0/10.0
$139,900
🖨 Deal sheet (PDF) 📄 Offer letter ✓ Due diligence
Multi-family units
County records classify this as Multi-Family (2-4 Unit). Listing-text estimate: 2 units. confirmed
Listing remarks
Your investment opportunity awaits! This is a large, two family home-a duplex - each unit has two bedrooms but each unit could easily have three bedrooms. One unit has a long time tenant and the other unit was just rented again. There's a large two car garage that could also be rented for additional income. Check this one out before it's gone!
Key facts
- 9,148 sq ft lot
- Garage
- Listed 309 days
Neighborhood map
What this means for you Summary
Snapshot
- This is a 2 × 2-bed/1.0-bath units multifamily listed at $140k. Condition is rated average.
Deal economics
- At list price, monthly cash flow is $754 ($9k/yr) — positive. Per door: $377/mo.
- The deal already cash-flows at list — no discount required.
- Meets the 1% rule at list price ($2k rent vs $140k).
- Recommended offer: $123k (12.0% below list) — sets the bar for market timing.
- Cap rate 12.8% vs local median 4.3% in Quincy — top-decile yield for the area; either an underpriced asset or a hidden risk that comps aren't pricing in. Stress-test before assuming the spread holds.
Location & tenants
- Location reads 67/100 on livability (#506 in IL) — a middle-class / working-renter tenant base. Strengths: cost of living A+, housing A+; Watch: crime D, employment D, amenities D-.
- Quincy SD 172 (town): math 24% / reading 27% proficiency, ranked #328 of 620 in IL (top 53%) — low school quality limits family demand, transient renter base, plan for 1-2y turnover.
- Zoned schools: Quincy Jr High School (math 25% / reading 30%, grade F, #295 of 665 statewide, top 45%, 1,348 students, 0% FRL); Quincy Sr High School (math 21% / reading 28%, grade F, #256 of 693 statewide, top 44%, 1,924 students, 0% FRL) — zoned schools average 0% FRL vs 48% district-wide (48 pts lower); this property's tenant base skews higher-income than the district average.
- Market conditions: Rents rising fast (+10.8%/yr); 180 active listings in the ZIP; 1 comparable units currently listed for rent nearby; 68 units permitted in Adams County in 2024 (0 in 5+ unit buildings).
- At $2,178/mo this rent would consume 50% of the median local household income ($52k/yr) (locally 1238% of renters already pay >50% of income on rent) — very limited rent-growth headroom before tenants either downsize or default.
Forward outlook
- Local home prices are declining (-3.0%/yr); year-one equity from $967 of loan paydown is wiped out by about $4k of value loss. Plan a longer hold.
- Adams County population projected at -14% by 2050 — secular population decline; favor cash flow + early exit over multi-decade hold.
- At projected returns (-3.0% appreciation + 8.0% rent growth), your $39k cash investment doubles in ~5 years — after that, you're playing with house money.
Negotiation context
- It's been on market 310 days — a 12% lower offer ($123k) is reasonable based on typical stale-listing flexibility.
- 5 sale attempts since 15y ago; this cycle's ask has dropped $12k (8%) from the opening price — seller is motivated, your offer sets the floor, not the list.
Questions for the listing agent
- It's been on market 310 days. Have you received any prior offers? Is the seller open to a 12% concession, seller financing, or rate buy-down credit?
- Can we see the unit-by-unit rent roll, current vacancy, and any below-market leases? What's the average tenancy length?
- What capital expenditures (roof, boiler, parking lot, exteriors) have been made in the last 5 years, and what's planned in the next 2?
- Why hasn't it sold? Are there any deal-killer items the seller is aware of (foundation, flood, title, zoning, code violations)?
- Is there a deadline driving the sale (1031 exchange, divorce, estate, relocation)? That informs how much negotiation room exists.
- Schools are D-rated, which usually means shorter tenancies and higher turnover. Who's the typical renter profile here, and what's been the actual vacancy rate?
- Crime grade is D in this area — have there been break-ins, vandalism, or insurance claims at this property in the last 3 years? What carrier currently insures it and at what premium?
- What's the average days-on-market for RENTAL listings here right now (not sales)? A rising rental-DOM trend means longer vacancies and softer asking-rent achievability than the comps imply.
- What's the recent tenant-quality profile in this submarket — average credit score on applications, eviction rate, late-payment / NSF rate, and stable-employment percentage? A property-management company in the area should have these aggregated.
- How much new apartment / multifamily construction is in the pipeline within 1–3 miles? Heavy new supply (>2% of stock underway) typically softens rents 12–24 months out; light construction supports rent growth.
Investment metrics
- 1% rule
- 1.56% ✓
- Cap rate
- 12.76%
- Cash-on-cash
- 23.09%
- DSCR
- 2.03
- GRM
- 5.4
CMA / ARV
- ARV (median comp)
- $112,552
- List price
- $139,900
- Delta
- 24.30%
- Verdict
- OVERPRICED
- Comps
- 20 within 1.0 mi
Show comp detail 2 sales within ~0.75 mi
| Address | Dist | Beds/Ba | Sqft | Sold | Price | $/sf | Match |
|---|---|---|---|---|---|---|---|
| 1100 Payson Ave | 0.12mi | 4/2.0 | 2,210 (+5%) | 4mo | $118,000 | $53 | 82 |
| 1019 Washington St | 0.11mi | 4/2.0 | 2,010 (-4%) | 17mo | $107,500 | $53 | 74 |
Match score weights: distance 35% · size 25% · config 20% · recency 20%. Top-matched comps best support the ARV.
Projected returns pro-forma
-3.0% appreciation · 8.0% rent growth · sell at horizon
- IRR
- 21.6%
- Equity multiple
- 1.94×
- Total profit
- $36,883
- Equity at exit
- $20,860
- IRR
- 32.9%
- Equity multiple
- 4.74×
- Total profit
- $146,459
- Equity at exit
- $12,096
Cash invested: $39,172 (down + closing). Projections, not guarantees.
Landlord ↔ Tenant lean methodology
- Overall (STATE)
- 43 Moderately Tenant-Leaning
- State Illinois
- 43 Moderately Tenant-Leaning · D+7
- County
- — inherits STATE
- City
- — inherits STATE
ZIP-level market 62301
- Rents YoY
- 10.8%
- Active inventory
- 180
- Price-to-rent
- 10.7×
Monthly cashflow live
- Estimated rent
- $2,178 medium interval (Pro) →
- Mortgage (P&I)
- −$734
- Tax est. 1.5%
- −$175 /mo · $2,098/yr
- Insurance
- −$58
- HOA
- −$0
- Vacancy / Maint / Mgmt
- −$457
- Net cashflow
- $754
Break-even live
Sensitivity live
| Price | -10% $850 | -5% $802 | +0% $754 | +5% $705 | +10% $657 |
|---|---|---|---|---|---|
| Rent | -10% $582 | -5% $668 | +0% $754 | +5% $840 | +10% $926 |
| Rate | -1.0pp $824 | -0.5pp $789 | base $754 | +0.5pp $718 | +1.0pp $681 |
2-unit breakdown (identical units grouped — click to expand)
| Units | Beds | Baths | Est. rent |
|---|---|---|---|
| 2× units | 2 | 1 | $2,178 |
| #1 | 2 | 1 | $1,089 |
| #2 | 2 | 1 | $1,089 |
| Total (2 units) | $2,178 | ||
UW: 25.0% down · 7.5% · 30yr · 1.5% tax · 5.0% vac · 8.0% maint · 8.0% mgmt
Financing live
Cash to close
- Down payment
- $34,975
- Closing costs
- $4,197
- Reserves months
- —
- Total cash needed
- —
Loan-product check · same deal, 3 products live
Conventional
25% down · 7.5% · 30yr
- Down + closing
- —
- Monthly P&I
- —
- Monthly cashflow
- —
- DSCR
- —
- Eligible?
- —
Personal DTI + credit; lowest rate.
DSCR
20% down · 8.5% · 30yr
- Down + closing
- —
- Monthly P&I
- —
- Monthly cashflow
- —
- DSCR
- —
- Eligible?
- —
No personal income docs; deal must DSCR.
Hard money
10% down · 12.0% · 12mo
- Down + closing
- —
- Monthly P&I
- —
- Monthly cashflow
- —
- DSCR
- —
- Eligible?
- —
Short-term bridge; refi at stabilization.
Rent comps 1 comps
| Address | Beds | Baths | Sqft | Rent | $/sqft | DOM | Units | Dist |
|---|---|---|---|---|---|---|---|---|
| 116 N 3rd St Quincy, IL | 1.0–4.0 | 1.0–2.0 | 1950 | $5,600 | $2.87 | 45d | 12 | 1.06mi |
Listing history 34 events
-
2026-06-19days on market $139,900 Active 310 DOM
-
2026-06-18days on market $139,900 Active 309 DOM
-
2026-06-17days on market $139,900 Active 308 DOM
-
2026-06-16days on market $139,900 Active 307 DOM
-
2026-06-15days on market $139,900 Active 306 DOM
-
2026-06-14days on market $139,900 Active 304 DOM
-
2026-06-12days on market $139,900 Active 303 DOM
-
2026-06-09days on market $139,900 Active 300 DOM
-
2026-06-08days on market $139,900 Active 299 DOM
-
2026-06-07days on market $139,900 Active 298 DOM
-
2026-06-03days on market $139,900 Active 294 DOM
-
2026-06-02days on market $139,900 Active 293 DOM
-
2026-06-01days on market $139,900 Active 292 DOM
-
2026-05-31days on market $139,900 Active 291 DOM
-
2026-05-30days on market $139,900 Active 290 DOM
-
2026-01-12historical
-
2026-01-12historical
-
2026-01-06historical
-
2026-01-05historical
-
2025-11-18price $139,900
-
2025-11-18price
-
2025-11-14price $147,500
-
2025-11-14price
-
2025-08-26price $149,000
-
2025-08-26price
-
2025-08-11Active
-
2025-08-11$152,000 Active
-
2023-03-27soldstatus $125,000 Closed
-
2023-02-09historical Under Contract
-
2023-01-19$139,000 Active
-
2012-01-09soldstatus $68,000
-
2012-01-09soldstatus $68,000
-
2011-08-26$79,900
-
2011-08-26$79,900
ⓘ Source: listings_history table (triggers on properties + properties_extension) + one-shot
backfill from property_details.listing_events for pre-trigger history.
Climate risk First Street
- Flood 1/10 Low FEMA zone X (unshaded) · 0% chance over 30 yrs
- Wildfire 1/10 Low
- Heat 4/10 Moderate 7 d/yr ≥106°F today · 17 d/yr by 30 yrs out
- Wind 2/10 Low
- Air quality 2/10 Low 1 unhealthy d/yr today · 1 by 30 yrs out
Nearby sold comps map
Loading sold comps map…
Walkable amenities ~0.75 mi
Loading nearby amenities…
Taxation est. · year 1
- Rental income
- $26,136
- − Mortgage interest
- −$7,837
- − Property taxes
- −$2,098
- − Insurance
- −$700
- − Repairs & maintenance
- −$2,091
- − Management
- −$2,091
- − Depreciation
- −$4,070
- Taxable income
- $7,250
- Est. tax owed @ 24.0%
- −$1,740
- After-tax cash flow
- $7,306/yr
For passive investors: Depreciation is non-cash, so a rental often shows a tax loss while cash-flowing — sheltering income. Rental losses are passive: they offset passive income freely, and up to $25,000/yr can offset ordinary (W-2) income if you actively participate and your MAGI is under $100k (phasing out to $0 by $150k); unused losses carry forward. On sale, claimed depreciation is recaptured at up to 25%, and gains may owe capital-gains tax (a 1031 exchange can defer both). Figures are a year-1 estimate at your 24.0% rate — not tax advice; consult a CPA.
Condition & rehab AI · 12 photos
A moderate rehab project is needed to improve the home's curb appeal and overall condition, enhancing its resale and rental value.
Repairs flagged
- Moderate exterior siding — Weathered and discolored
- Minor interior walls — Some scuffing
Value-add opportunities
- Both paint exterior — Enhances curb appeal and value
- Both repair siding — Improves home's appearance and value
- Both update flooring — Modernizes and increases value
- Both update bathrooms — Modernizes and increases value
- Both update kitchen — Modernizes and increases value
Renovation cost estimate screening
| Repair item | Severity | Est. cost |
|---|---|---|
| exterior siding · Weathered and discolored | Moderate | $3,000–15,000 |
| interior walls · Some scuffing | Minor | $500–3,000 |
| Total estimated repair cost · 2 items | $3,500–18,000 |
Value-add ROI direction
- Both paint exterior — Enhances curb appeal and value ↑
- Both repair siding — Improves home's appearance and value ↑
- Both update flooring — Modernizes and increases value ↑
- Both update bathrooms — Modernizes and increases value ↑
- Both update kitchen — Modernizes and increases value ↑
ⓘ Cost ranges are severity-bucket heuristics (US national rule-of-thumb). Get contractor quotes + a written scope before underwriting a rehab budget.
Schools (NCES district)
- District
- Quincy SD 172
- NCES district ID
- 1733000
- Math proficiency
- 24% ▬ 0.00%
- Reading proficiency
- 27% ▬ 0.00%
- Median HH income
- $44,132
- Composite
- 21.91/100
- National rank
- #8229
- State rank
- #328 of 620 in IL
Livability — Quincy
- Score
- 67/100
- State rank
- #506
- US rank
- #10458
Category grades
Schools grade is shown separately in the Schools card above.
Census & demographics
- Census place
- Quincy, IL
- County
- Adams County · 30,746 people
- City population
- 30,746
- Metro
- Quincy, IL-MO
- Population (ZIP)
- 30,746
- Household income
- $52,055
- Rent vs Own
- Severe rent burden
- 1238.0
Population outlook (Adams County) Hauer SSP2
- Today (2025)
- 65,795 people
- By 2030
- 64,436 · -2.1%
- By 2040
- 61,007 · -7.3%
- By 2050
- 56,851 · -13.6%
- By 2075
- 46,424 · -29.4%
- By 2100
- 34,305 · -47.9%
Race, ethnicity, and origin ACS 2023
- Neighborhood character
- Predominantly White (84%)
- Race & ethnicity
- White 84% Two or more races 7% Black 6% Hispanic / Latino 3% Asian 1%
- Common ancestry
- Slovak 2% Iranian 1% Lithuanian 1%
- Foreign-born
- 2% · Canada
- Languages at home
- 96% English-only · Spanish 2%
Political lean MEDSL · Adams
- 2024 margin
- Solid R (+47.4) · D 25.6% · R 73.0% · Other 1.5%
- 2008→2024 swing
- -25.0pp toward R · 2008: -22.4pp · 2024: -47.4pp
- All cycles
- 2024: R+47.4 2020: R+46.5 2016: R+47.5 2012: R+35.2 2008: R+22.4
Not yet ingested
- Civics
- —
Market trends
- HPI YoY
- ▼ -121.44%
- Current HPI
- 131.7344
- Rent YoY
- ▲ 10.78%
- Metro
- Quincy, IL-MO
- State GDP YoY
- ▲ 1.59%
- F500 in state
- 60
Industry mix (Fortune 500 HQ in IL)
| Industry | F500 HQs | Revenue |
|---|---|---|
| Insurance | 4 | $201B |
|
||
| Consumer Goods | 4 | $87B |
|
||
| Industrial Machinery | 3 | $64B |
|
||
| Healthcare | 2 | $55B |
|
||
| Retail / Pharmacy | 1 | $148B |
|
||
| Agriculture / Food | 1 | $86B |
|
||
Price history
+75.1% since first listed19 events — show timeline
- 2026-01-12 Listing Removed — MRED as Distributed by MLS Grid
- 2026-01-12 Listing Removed — MRED as Distributed by MLS Grid
- 2026-01-06 Listing Removed — RMLSA as Distributed by MLS Grid
- 2026-01-05 Listing Removed — MRED as Distributed by MLS Grid
- 2025-11-18 Price Changed $139,900 Quincy AOR
- 2025-11-18 Price Changed — MRED as Distributed by MLS Grid
- 2025-11-14 Price Changed $147,500 Quincy AOR
- 2025-11-14 Price Changed — MRED as Distributed by MLS Grid
- 2025-08-26 Price Changed $149,000 Quincy AOR
- 2025-08-26 Price Changed — MRED as Distributed by MLS Grid
- 2025-08-11 Listed $152,000 Quincy AOR
- 2025-08-11 Listed — MRED as Distributed by MLS Grid
- 2023-03-27 Sold (MLS) $125,000 RMLSA as Distributed by MLS Grid
- 2023-02-09 Contingent — RMLSA as Distributed by MLS Grid
- 2023-01-19 Listed $139,000 RMLSA as Distributed by MLS Grid
- 2012-01-09 Sold (MLS) $68,000 MRED as Distributed by MLS Grid
- 2012-01-09 Sold (MLS) $68,000 RMLSA as Distributed by MLS Grid
- 2011-08-26 Listed $79,900 MRED as Distributed by MLS Grid
- 2011-08-26 Listed $79,900 RMLSA as Distributed by MLS Grid
Cash-flow waterfall
monthlySold comps — $/sqft
last 12 mo · ≤1 miLoading sold comps…