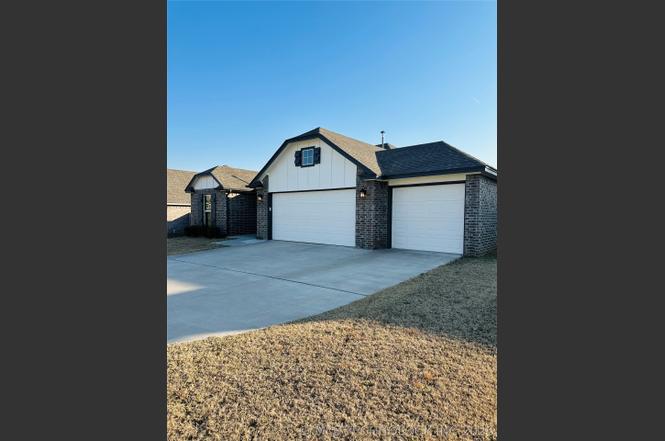
3634 E 143rd Pl S · Bixby, OK
Flood risk 1/10 · Minimal
- FEMA flood zone
- X (unshaded)
- Chance of flooding over 30 yrs
- 0.0%
- Est. flood insurance / yr
- $473 – $860
Fire risk 6/10 · Moderate
- Est. fire insurance / yr
- $2,463 – $4,575
Heat risk 6/10 · Moderate
- Hot days now (above 112°F)
- 7 days/yr
- Hot days in 30 yrs
- 18 days/yr
Wind risk 3/10 · Minor
- Chance of severe wind over 30 yrs
- 4.0%
Air-quality risk 2/10 · Minimal
- Unhealthy air days now
- 1 days/yr
- Unhealthy air days in 30 yrs
- 1 days/yr
Risk factors via First Street. Map © Google.
Why this score? — see what drove the D grade
The composite is a weighted blend of 9 inputs, each scored 0–100. Each bar is that input's sub-score; the figure is the points it added to the 100-point composite (weight × sub-score).
- Cash flow +12.8/30.0
- ARV discount +10.8/15.0
- DSCR +3.8/10.0
- 1% rule +3.6/10.0
- Livability +3.6/5.0
- Schools +3.5/10.0
- Rent growth +3.3/5.0
- Condition / age +2.5/5.0
- Appreciation +0.0/10.0
$280,000
🖨 Deal sheet (PDF) 📄 Offer letter ✓ Due diligence
Listing remarks MLS
Entered for Statistical Purposes
Key facts
- Highway access
- Huge back yard
- Granite countertops
Tags
Property features AI
Finance
- HOA & community: Community association with annual fee of $600; Community amenities include a park and pool; Community features include gutters and sidewalks
Exterior
- Parking: Attached garage with 3 spaces
- Security: Smoke detector(s); No safety shelter
- Utilities: Public water; Public sewer; Electricity available; Natural gas available; Cable available
- Home design: Single-story; Faces east; Single wide body type; Slab foundation
- Construction: Brick and block construction; Year built per public records
- Exterior features: Concrete driveway; Rain gutters; Covered patio; Full fencing
Interior
- Kitchen: Built-in oven; Oven; Range / Stove; Microwave; Dishwasher; Pantry
- Bedrooms: Master bedroom with walk-in closet (first level); Bedroom with walk-in closet (first level); Bedroom with walk-in closet (first level)
- Flooring: Carpet; Laminate; Tile; Vinyl
- Bathrooms: 2 full bathrooms
- Heating & cooling: Central heating (gas); Central air conditioning
- Interior features: Granite counters; High ceilings; Cable TV; Gas range and gas oven connections; Smoke detector(s)
- Laundry & utility: Washer hookup; Utility room (inside, first level); Electric water heater
Neighborhood map
What this means for you Summary
Snapshot
- This is a 3-bed/2.0-bath single-family listed at $280k.
Deal economics
- At list price, monthly cash flow is $-27 ($-324/yr) — negative.
- To cash-flow at today's rent, offer at most $275k (1.7% below list).
- To meet the 1% rule (rent ≥ 1% of price), the offer needs to be $239k (14.5% below list).
- Recommended offer: $239k (14.5% below list) — sets the bar for 1% rule.
- Cap rate 6.2% vs local median 3.7% in Bixby — top-decile yield for the area; either an underpriced asset or a hidden risk that comps aren't pricing in. Stress-test before assuming the spread holds.
Location & tenants
- Location reads 72/100 on livability (#24 in OK) — a middle-class / working-renter tenant base. Strengths: crime A+, employment A+, housing A+; Watch: amenities F, commute F, health & safety F.
- Bixby (suburban): math 39% / reading 36% proficiency, ranked #15 of 270 in OK (top 6%) — families likely to look elsewhere, expect single-tenant / working-renter base with shorter leases; only 19% free/reduced lunch — higher-income household profile.
- Zoned schools: Central Es (math 32% / reading 32%, grade F, #213 of 845 statewide, top 28%, 646 students, 0% FRL); Bixby Ms (math 37% / reading 30%, grade F, #33 of 345 statewide, top 10%, 1,216 students, 0% FRL); Bixby Hs (math 42% / reading 48%, grade D-, #13 of 447 statewide, top 3%, 2,102 students, 0% FRL) — zoned schools average 0% FRL vs 19% district-wide (19 pts lower); this property's tenant base skews higher-income than the district average.
- Market conditions: Rents rising (+3.3%/yr); 795 active listings in the ZIP; 9 comparable units currently listed for rent nearby; rentals leasing fast (median 5d on market — plan ~1-2 weeks tenant-placement turnaround); solid renter incomes; 2,818 units permitted in Tulsa County in 2024 (518 in 5+ unit buildings).
Forward outlook
- Local home prices are declining (-3.0%/yr); year-one equity from $2k of loan paydown is wiped out by about $8k of value loss. Plan a longer hold.
- Tulsa County population projected at +30% by 2050 — long-run rental-demand tailwind backs the buy-and-hold thesis.
Negotiation context
- It's been on market 109 days — a 9% lower offer ($255k) is reasonable based on typical stale-listing flexibility.
- 3 sale attempts since 5y ago with the ask held roughly flat each time — persistent listings suggest the price (not the market) is what's stuck; bring a comps-based counter.
- Current owner paid $221k; 27% above their basis — modest negotiation headroom, anchor on the comps not their cost.
Risks & watch-outs
- Climate carrying-cost: major wildfire risk; extreme-heat days projected 7→18/yr by 2055 (HVAC capex compounding) — expect insurance premiums to compound above CPI over the hold.
Questions for the listing agent
- What do current leases actually rent for vs. the listed asking? Can we see a recent rent roll and the last 12 months of T-12 income?
- It's been on market 109 days. Have you received any prior offers? Is the seller open to a 14% concession, seller financing, or rate buy-down credit?
- What does the HOA fee cover, when was the last increase, and are there any pending special assessments or reserve-fund shortfalls?
- Why hasn't it sold? Are there any deal-killer items the seller is aware of (foundation, flood, title, zoning, code violations)?
- Is there a deadline driving the sale (1031 exchange, divorce, estate, relocation)? That informs how much negotiation room exists.
- Schools are B-rated — typically a magnet for longer-tenancy family renters. What's the average tenant stay here, and is there a school-zone premium baked into asking?
- The area grade is low — what's the realistic commute time and amenity access for the typical tenant pool here? Any planned neighborhood developments (good or bad) we should know about?
- What's the average days-on-market for RENTAL listings here right now (not sales)? A rising rental-DOM trend means longer vacancies and softer asking-rent achievability than the comps imply.
- What's the recent tenant-quality profile in this submarket — average credit score on applications, eviction rate, late-payment / NSF rate, and stable-employment percentage? A property-management company in the area should have these aggregated.
- How much new for-sale + rental construction is in the pipeline within 1–3 miles? Heavy new supply typically softens prices + rents 12–24 months out; constrained supply supports both.
Investment metrics
- 1% rule
- 0.86% ✗
- Cap rate
- 6.18%
- Cash-on-cash
- -0.41%
- DSCR
- 0.98
- GRM
- 9.7
CMA / ARV
- ARV (on-the-fly)
- $302,016
- Comps found
- 12
Show comp detail 12 sales within ~0.75 mi
| Address | Dist | Beds/Ba | Sqft | Sold | Price | $/sf | Match |
|---|---|---|---|---|---|---|---|
| 3634 E 143rd Pl S | 0.00mi | 3/2.0 | 1,716 (0%) | 0mo | $280,000 | $163 | 100 |
| 14321 S Harvard Pl | 0.21mi | 3/2.0 | 1,712 (-0%) | 1mo | $301,900 | $176 | 89 |
| 3636 E 143rd Ct S | 0.06mi | 3/2.0 | 1,632 (-5%) | 4mo | $265,000 | $162 | 86 |
| 3583 E 144th Pl S | 0.17mi | 3/2.0 | 1,794 (+4%) | 1mo | $300,000 | $167 | 84 |
| 14324 S Harvard Pl | 0.24mi | 3/2.0 | 1,693 (-1%) | 6mo | $300,000 | $177 | 82 |
| 3648 E 144th St S | 0.13mi | 4/2.0 (+1) | 1,780 (+4%) | 2mo | $330,000 | $185 | 81 |
| 3728 E 143rd Pl S | 0.04mi | 3/2.0 | 1,594 (-7%) | 6mo | $280,000 | $176 | 81 |
| 3838 E 144th St S | 0.11mi | 3/2.0 | 1,933 (+13%) | 1mo | $305,000 | $158 | 73 |
| 14482 S Vandalia Ave | 0.73mi | 3/2.0 | 1,859 (+8%) | 3mo | $310,500 | $167 | 50 |
| 14390 S Vandalia Ave | 0.71mi | 3/2.0 | 1,916 (+12%) | 2mo | $332,000 | $173 | 46 |
| 14510 S Vandalia Ave | 0.74mi | 3/2.0 | 1,919 (+12%) | 1mo | $343,750 | $179 | 45 |
| 2126 E 138th St S | 0.58mi | 4/2.0 (+1) | 1,970 (+15%) | 3mo | $406,900 | $207 | 41 |
Match score weights: distance 35% · size 25% · config 20% · recency 20%. Top-matched comps best support the ARV.
Projected returns pro-forma
-3.0% appreciation · 3.34% rent growth · sell at horizon
- IRR
- -16.6%
- Equity multiple
- 0.41×
- Total profit
- $-46,243
- Equity at exit
- $41,749
- IRR
- -7.8%
- Equity multiple
- 0.50×
- Total profit
- $-38,980
- Equity at exit
- $24,209
Cash invested: $78,400 (down + closing). Projections, not guarantees.
Landlord ↔ Tenant lean methodology
- Overall (STATE)
- 83 Strongly Landlord-Friendly
- State Oklahoma
- 83 Strongly Landlord-Friendly · R+20
- County
- — inherits STATE
- City
- — inherits STATE
ZIP-level market 74008
- Rents YoY
- 3.3%
- Active inventory
- 795
- Price-to-rent
- 9.7×
Monthly cashflow live
- Estimated rent
- $2,394 high interval (Pro) →
- Mortgage (P&I)
- −$1,468
- Tax from tax record
- −$283 /mo · $3,400/yr
- Insurance
- −$117
- HOA
- −$50
- Vacancy / Maint / Mgmt
- −$503
- Net cashflow
- $-27
Break-even live
Sensitivity live
| Price | -10% $132 | -5% $52 | +0% $-27 | +5% $-106 | +10% $-185 |
|---|---|---|---|---|---|
| Rent | -10% $-216 | -5% $-122 | +0% $-27 | +5% $68 | +10% $162 |
| Rate | -1.0pp $114 | -0.5pp $44 | base $-27 | +0.5pp $-100 | +1.0pp $-173 |
UW: 25.0% down · 7.5% · 30yr · 1.5% tax · 5.0% vac · 8.0% maint · 8.0% mgmt
Financing live
Cash to close
- Down payment
- $70,000
- Closing costs
- $8,400
- Reserves months
- —
- Total cash needed
- —
Loan-product check · same deal, 3 products live
Conventional
25% down · 7.5% · 30yr
- Down + closing
- —
- Monthly P&I
- —
- Monthly cashflow
- —
- DSCR
- —
- Eligible?
- —
Personal DTI + credit; lowest rate.
DSCR
20% down · 8.5% · 30yr
- Down + closing
- —
- Monthly P&I
- —
- Monthly cashflow
- —
- DSCR
- —
- Eligible?
- —
No personal income docs; deal must DSCR.
Hard money
10% down · 12.0% · 12mo
- Down + closing
- —
- Monthly P&I
- —
- Monthly cashflow
- —
- DSCR
- —
- Eligible?
- —
Short-term bridge; refi at stabilization.
Rent comps 9 comps
| Address | Beds | Baths | Sqft | Rent | $/sqft | DOM | Units | Dist |
|---|---|---|---|---|---|---|---|---|
| 14734 S Urbana Ave Bixby, OK | 4.0 | 2.0 | 2020 | $2,500 | $1.24 | 5d | 1 | 0.88mi |
| 14727 S Urbana Ave Bixby, OK | 3.0 | 2.0 | 2145 | $3,000 | $1.40 | 25d | 1 | 0.89mi |
| 14727 S Urbana Ave Bixby, OK | 3.0 | 2.0 | 2145 | $2,500 | $1.17 | 17d | 1 | 0.89mi |
| 2052 E 133rd Ct Bixby, OK | 3.0 | 2.0 | 2158 | $2,300 | $1.07 | 25d | 1 | 0.89mi |
| 1928 E 133rd Ct Bixby, OK | 4.0 | 2.0 | 2151 | $2,200 | $1.02 | 5d | 1 | 1.03mi |
| 13312 S 19th Pl Bixby, OK | 4.0 | 2.0 | 1812 | $2,200 | $1.21 | 25d | 1 | 1.11mi |
| 2025 E 132nd St S Unit NA Bixby, OK | 4.0 | 2.0 | 2143 | $2,400 | $1.12 | 5d | 1 | 1.17mi |
| 13245 S 19th St Bixby, OK | 4.0 | 2.0 | 2024 | $2,300 | $1.14 | 5d | 1 | 1.19mi |
| 5839 E 148th Pl S Bixby, OK | 3.0 | 2.0 | 1256 | $1,850 | $1.47 | 3d | 1 | 1.49mi |
HOA detail
- Monthly dues
- $50 · $600/yr
Listing history 7 events
-
2026-05-07status Pending
-
2026-05-07status Active
-
2026-04-14status Pending
-
2026-03-13price $280,000
-
2025-12-26$285,000 Active
-
2021-07-21soldstatus $220,849 32-char remark
Show marketing remark (32 chars)
Entered for Statistical Purposes
-
2021-07-21$220,849 32-char remark
Show marketing remark (32 chars)
Entered for Statistical Purposes
ⓘ Source: listings_history table (triggers on properties + properties_extension) + one-shot
backfill from property_details.listing_events for pre-trigger history.
Tax reassessment forecast OK · Resets to sale price
- Current annual tax
- $3,400 · $283/mo
- Projected year-2 tax
- $3,400 · $283/mo
- Expected delta
- $0/yr ($0/mo · 0.0%)
ⓘ Screening estimate from a state-policy table — verify with the county assessor before closing.
Climate risk First Street
- Flood 1/10 Low FEMA zone X (unshaded) · 0% chance over 30 yrs
- Wildfire 6/10 Major
- Heat 6/10 Major 7 d/yr ≥112°F today · 18 d/yr by 30 yrs out
- Wind 3/10 Moderate 4% chance of damaging wind over 30 yrs
- Air quality 2/10 Low 1 unhealthy d/yr today · 1 by 30 yrs out
Nearby sold comps map
Loading sold comps map…
Walkable amenities ~0.75 mi
Loading nearby amenities…
Taxation est. · year 1
- Rental income
- $28,730
- − Mortgage interest
- −$15,684
- − Property taxes
- −$3,400
- − Insurance
- −$1,400
- − Repairs & maintenance
- −$2,298
- − Management
- −$2,298
- − HOA
- −$600
- − Depreciation
- −$8,145
- Taxable loss
- −$5,097
- Est. tax savings @ 24.0%
- +$1,223
- After-tax cash flow
- $899/yr
For passive investors: Depreciation is non-cash, so a rental often shows a tax loss while cash-flowing — sheltering income. Rental losses are passive: they offset passive income freely, and up to $25,000/yr can offset ordinary (W-2) income if you actively participate and your MAGI is under $100k (phasing out to $0 by $150k); unused losses carry forward. On sale, claimed depreciation is recaptured at up to 25%, and gains may owe capital-gains tax (a 1031 exchange can defer both). Figures are a year-1 estimate at your 24.0% rate — not tax advice; consult a CPA.
Schools (NCES district)
- District
- Bixby
- NCES district ID
- 4004500
- Math proficiency
- 39% ▼ -13.00%
- Reading proficiency
- 36% ▼ -14.00%
- Median HH income
- $75,727
- Composite
- 34.9/100
- National rank
- #5081
- State rank
- #15 of 270 in OK
Livability — Bixby
- Score
- 72/100
- State rank
- #24
- US rank
- #6029
Category grades
Schools grade is shown separately in the Schools card above.
Census & demographics
- Census place
- Bixby, OK
- County
- Tulsa County · 640,811 people
- City population
- 34,006
- Metro
- Tulsa, OK
- Population (ZIP)
- 34,006
- Household income
- $104,000
- Rent vs Own
- Severe rent burden
- 525.0
Population outlook (Tulsa County) Hauer SSP2
- Today (2025)
- 723,846 people
- By 2030
- 766,033 · +5.8%
- By 2040
- 851,386 · +17.6%
- By 2050
- 938,389 · +29.6%
- By 2075
- 1,166,011 · +61.1%
- By 2100
- 1,350,277 · +86.5%
Race, ethnicity, and origin ACS 2023
- Neighborhood character
- Predominantly White (73%)
- Race & ethnicity
- White 73% Two or more races 15% Hispanic / Latino 9% Native American 5% Asian 2% Black 2%
- Hispanic origin (detail)
- Mexican 5%
- Common ancestry
- Italian 4% Slovak 2% Lithuanian 2%
- Foreign-born
- 5% · Canada
- Languages at home
- 92% English-only · Spanish 5% Other Indo-European 1%
Political lean MEDSL · Tulsa
- 2024 margin
- R (+15.2) · D 41.3% · R 56.5% · Other 2.2%
- 2008→2024 swing
- +9.2pp toward D · 2008: -24.5pp · 2024: -15.2pp
- All cycles
- 2024: R+15.2 2020: R+15.6 2016: R+22.9 2012: R+27.4 2008: R+24.5
Not yet ingested
- Civics
- —
Market trends
- HPI YoY
- ▼ -127.20%
- Current HPI
- 195.2538
- Rent YoY
- ▲ 3.34%
- Metro
- Tulsa, OK
- State GDP YoY
- ▲ 1.55%
- F500 in state
- 6
Industry mix (Fortune 500 HQ in OK)
| Industry | F500 HQs | Revenue |
|---|---|---|
| Energy | 3 | $48B |
|
||
Price history
+26.8% since first listed7 events — show timeline
- 2026-05-07 Pending — MLS Technology, Inc.
- 2026-05-07 Relisted — MLS Technology, Inc.
- 2026-04-14 Pending — MLS Technology, Inc.
- 2026-03-13 Price Changed $280,000 MLS Technology, Inc.
- 2025-12-26 Listed $285,000 MLS Technology, Inc.
- 2021-07-21 Listed $220,849 MLS Technology, Inc.
- 2021-07-21 Sold (MLS) $220,849 MLS Technology, Inc.
Property tax history
+104.1%/yrLatest (2025): $3,400 · +5.0% YoY. Source: county tax records.
Cash-flow waterfall
monthlySold comps — $/sqft
last 12 mo · ≤1 miLoading sold comps…