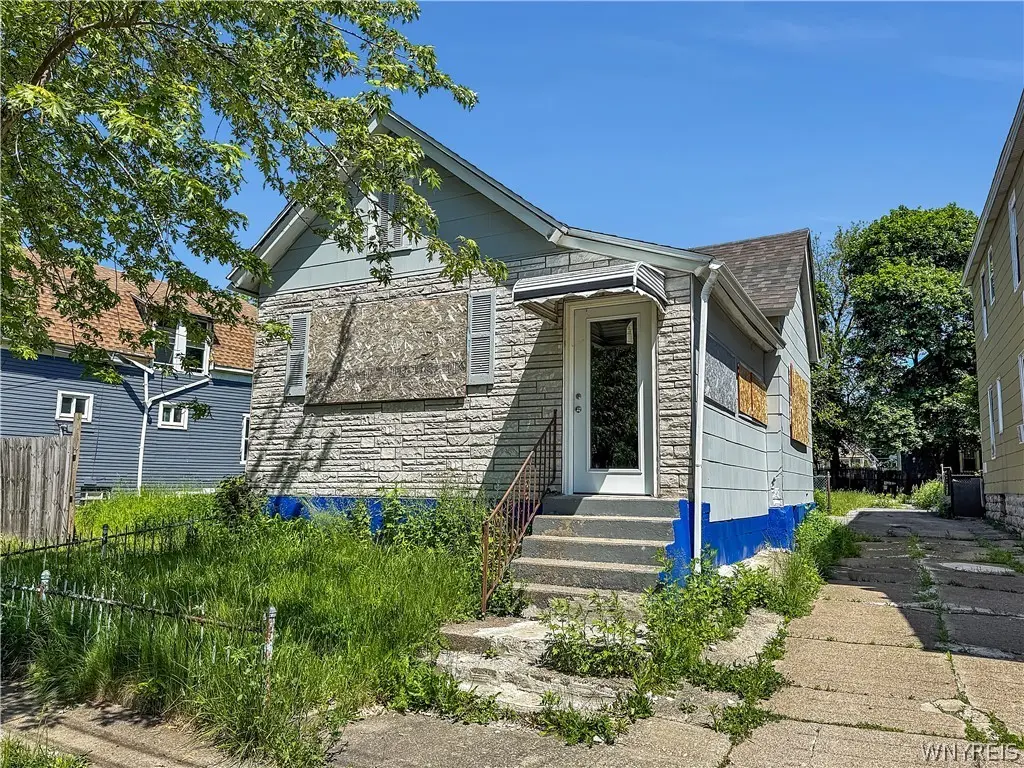
18 Helen St · Buffalo, NY
Flood risk 1/10 · Minimal
- FEMA flood zone
- X (unshaded)
- Chance of flooding over 30 yrs
- 0.0%
- Est. flood insurance / yr
- $473 – $860
Fire risk 1/10 · Minimal
- Est. fire insurance / yr
- $691 – $1,283
Heat risk 3/10 · Minor
- Hot days now (above 92°F)
- 7 days/yr
- Hot days in 30 yrs
- 15 days/yr
Wind risk 1/10 · Minimal
- Chance of severe wind over 30 yrs
- —
Air-quality risk 4/10 · Minor
- Unhealthy air days now
- 4 days/yr
- Unhealthy air days in 30 yrs
- 9 days/yr
Risk factors via First Street. Map © Google.
Why this score? — see what drove the B+ grade
The composite is a weighted blend of 9 inputs, each scored 0–100. Each bar is that input's sub-score; the figure is the points it added to the 100-point composite (weight × sub-score).
- Cash flow +30.0/30.0
- 1% rule +10.0/10.0
- DSCR +10.0/10.0
- Appreciation +8.8/10.0
- ARV discount +7.5/15.0
- Livability +3.9/5.0
- Schools +3.3/10.0
- Condition / age +2.5/5.0
- Rent growth +2.4/5.0
$45,000
🖨 Deal sheet 📄 Offer letter ✓ Due diligence
Listing remarks
West Side single-family residence offering an excellent opportunity for investors, renovators, or buyers looking to build equity. This 2-bedroom, 1-bath home features convenient single-story living and a versatile bonus room that can serve as additional storage, a home office, workshop, or hobby space. Many important updates have already been completed, including updated electrical wiring and panel, new flooring, and a complete kitchen tear-out, creating a blank canvas ready for your vision. The roof and gutters are less than 10 years old and remain in good condition. Outside, you'll find a long concrete driveway providing ample off-street parking and a large backyard with plenty of room fo
Key facts
- New flooring
- Versatile bonus room
- Single story living
Tags
Property features AI
Exterior
- Parking: No garage
- Utilities: Public water available (not connected); Sewer available
- Home design: Single-story home; Entry level: main level; Existing structure
- Construction: Composite siding; Shingle roof; Poured foundation; Described as resale in fixer condition
- Exterior features: Awnings; Concrete driveway; Near public transit; Residential lot; Irregular lot shape; Road frontage on a city street and main thoroughfare
Interior
- Kitchen: Eat-in kitchen
- Bedrooms: 2 bedrooms on the main level
- Flooring: Vinyl; Varied flooring
- Bathrooms: 1 full bathroom on the main level
- Heating & cooling: Gas forced-air heating
- Interior features: Den; Eat-in kitchen; Separate/formal living room; Home office; Storage; Workshop; Main level primary bedroom; Bedroom on main level
- Laundry & utility: Gas water heater
Neighborhood map
What this means for you Summary
Snapshot
- This is a 2-bed/1.0-bath single-family listed at $45k.
Deal economics
- At list price, monthly cash flow is $800 ($10k/yr) — positive.
- The deal already cash-flows at list — no discount required.
- Meets the 1% rule at list price ($1k rent vs $45k).
- Recommended offer: $44k (1.5% below list) — sets the bar for market timing.
- Cap rate 27.6% vs local median 8.0% in Buffalo — top-decile yield for the area; either an underpriced asset or a hidden risk that comps aren't pricing in. Stress-test before assuming the spread holds.
Location & tenants
- Location reads 77/100 on livability (#195 in NY, #3,011 nationally) — a middle-class / working-renter tenant base. Strengths: commute A+, housing A+, health & safety A+; Watch: crime F, employment D-.
- Buffalo City School District (urban): math 41% / reading 40% proficiency, ranked #535 of 590 in NY (top 91%) — families likely to look elsewhere, expect single-tenant / working-renter base with shorter leases; 75% free/reduced lunch — lower-income household profile, screen leases tightly.
- Market conditions: Rents soft (-0.5%/yr); 137 active listings in the ZIP; 40 comparable units currently listed for rent nearby; rentals lingering (median 44d on market — plan ~5-8 weeks vacancy on turnover, expect pricing pressure); 50% of comp listings sitting > 30 days — soft ceiling on asking rent; 1,244 units permitted in Erie County in 2024 (563 in 5+ unit buildings).
- This rent runs 30% of the median local income ($54k/yr) — at the standard rent-burdened threshold; future hikes will face affordability resistance.
Forward outlook
- In year one you build about $4k of equity ($311 loan paydown + $3k appreciation (7.5% local appreciation)).
- At projected returns (7.5% appreciation + 0.0% rent growth), your $13k cash investment doubles in ~1 year — after that, you're playing with house money.
- By year 9, paydown + projected appreciation supports a ~$35k cash-out refi (75% LTV) — recoverable capital for the next deal without selling this one.
Negotiation context
- It's been on market 18 days — a 2% lower offer ($44k) is reasonable based on typical stale-listing flexibility.
Risks & watch-outs
- Watch-outs: built in 1900 — expect roof / HVAC / electrical / plumbing capex.
Questions for the listing agent
- Built in 1900 — when were the roof, HVAC, electrical panel, plumbing, and water heater last replaced?
- Is there a deadline driving the sale (1031 exchange, divorce, estate, relocation)? That informs how much negotiation room exists.
- Crime grade is F in this area — have there been break-ins, vandalism, or insurance claims at this property in the last 3 years? What carrier currently insures it and at what premium?
- What's the average days-on-market for RENTAL listings here right now (not sales)? A rising rental-DOM trend means longer vacancies and softer asking-rent achievability than the comps imply.
- What's the recent tenant-quality profile in this submarket — average credit score on applications, eviction rate, late-payment / NSF rate, and stable-employment percentage? A property-management company in the area should have these aggregated.
- How much new for-sale + rental construction is in the pipeline within 1–3 miles? Heavy new supply typically softens prices + rents 12–24 months out; constrained supply supports both.
Investment metrics
- 1% rule
- 3.04% ✓
- Cap rate
- 27.62%
- Cash-on-cash
- 76.17%
- DSCR
- 4.39
- GRM
- 2.7
CMA / ARV
- ARV (on-the-fly)
- $136,800
- Comps found
- 8
Show comp detail 8 sales within ~0.75 mi
| Address | Dist | Beds/Ba | Sqft | Sold | Price | $/sf | Match |
|---|---|---|---|---|---|---|---|
| 25 Lafayette Ave | 0.18mi | 3/2.0 (+1) | 1,009 (+6%) | 5mo | $110,000 | $109 | 68 |
| 1069 West Ave | 0.17mi | 3/1.0 (+1) | 1,040 (+10%) | 11mo | $150,000 | $144 | 62 |
| 23 Pooley Pl | 0.38mi | 3/1.0 (+1) | 1,044 (+10%) | 0mo | $144,900 | $139 | 60 |
| 153 Garner Ave | 0.37mi | 2/1.0 | 864 (-9%) | 12mo | $70,653 | $82 | 58 |
| 123 Hawley St | 0.73mi | 3/1.0 (+1) | 930 (-2%) | 13mo | $191,000 | $205 | 47 |
| 87 Brayton St | 0.75mi | 2/2.0 | 1,025 (+8%) | 2mo | $250,000 | $244 | 46 |
| 431 Normal Ave | 0.69mi | 2/1.0 | 1,076 (+13%) | 19mo | $39,900 | $37 | 29 |
| 11 S Putnam St | 0.63mi | 2/2.5 | 1,073 (+13%) | 22mo | $277,000 | $258 | 25 |
Match score weights: distance 35% · size 25% · config 20% · recency 20%. Top-matched comps best support the ARV.
Projected returns pro-forma
7.51% appreciation · 0.0% rent growth · sell at horizon
- IRR
- 81.7%
- Equity multiple
- 6.09×
- Total profit
- $64,076
- Equity at exit
- $32,705
- IRR
- 77.0%
- Equity multiple
- 12.17×
- Total profit
- $140,708
- Equity at exit
- $63,553
Cash invested: $12,600 (down + closing). Projections, not guarantees.
Landlord ↔ Tenant lean methodology
- Overall (STATE)
- 15 Strongly Tenant-Friendly
- State New York
- 15 Strongly Tenant-Friendly · D+10
- County
- — inherits STATE
- City
- — inherits STATE
ZIP-level market 14213
- Home prices YoY
- 1.7%
- Rents YoY
- -0.5%
- Active inventory
- 137
- Price-to-rent
- 2.7×
Monthly cashflow live
- Estimated rent
- $1,368 high interval (Pro) →
- Mortgage (P&I)
- −$236
- Tax from tax record
- −$26 /mo · $317/yr
- Insurance
- −$19
- HOA
- −$0
- Vacancy / Maint / Mgmt
- −$287
- Net cashflow
- $800
Break-even live
UW: 25.0% down · 7.5% · 30yr · 1.5% tax · 5.0% vac · 8.0% maint · 8.0% mgmt
Financing live
Cash to close
- Down payment
- $11,250
- Closing costs
- $1,350
- Reserves months
- —
- Total cash needed
- —
Loan-product check · same deal, 3 products live
Conventional
25% down · 7.5% · 30yr
- Down + closing
- —
- Monthly P&I
- —
- Monthly cashflow
- —
- DSCR
- —
- Eligible?
- —
Personal DTI + credit; lowest rate.
DSCR
20% down · 8.5% · 30yr
- Down + closing
- —
- Monthly P&I
- —
- Monthly cashflow
- —
- DSCR
- —
- Eligible?
- —
No personal income docs; deal must DSCR.
Hard money
10% down · 12.0% · 12mo
- Down + closing
- —
- Monthly P&I
- —
- Monthly cashflow
- —
- DSCR
- —
- Eligible?
- —
Short-term bridge; refi at stabilization.
Rent comps 40 comps
| Address | Beds | Baths | Sqft | Rent | $/sqft | DOM | Units | Dist |
|---|---|---|---|---|---|---|---|---|
| 163 W Delavan Ave Buffalo, NY | 3.0 | 1.0 | 1000 | $1,500 | $1.50 | 23d | 1 | 0.06mi |
| 196 Auburn Ave Buffalo, NY | 3.0 | 1.0 | 1000 | $1,300 | $1.30 | 43d | 1 | 0.16mi |
| 257 Lafayette Ave Unit 317 Buffalo, NY | 2.0 | 1.0 | 897 | $1,400 | $1.56 | 23d | 1 | 0.29mi |
| 257 Lafayette Ave Apt 319 Buffalo, NY | 2.0 | 1.0 | 900 | $1,395 | $1.55 | 23d | 1 | 0.29mi |
| 136 Parkdale Ave Unit 1 Buffalo, NY | 1.0 | 1.0 | 900 | $900 | $1.00 | 43d | 1 | 0.32mi |
| 130 Parkdale Ave Buffalo, NY | 1.0 | 1.0 | 650 | $900 | $1.38 | 43d | 1 | 0.32mi |
| 1485 Niagara St Buffalo, NY | 1.0–2.0 | 1.0 | 925 | $2,174 | $2.35 | 1d | 1 | 0.33mi |
| 67 Herkimer St Buffalo, NY | 3.0 | 1.0 | 1000 | $1,300 | $1.30 | 14d | 1 | 0.45mi |
| 309 Bird Ave Unit 1 Buffalo, NY | 3.0 | 1.0 | 1100 | $2,200 | $2.00 | 43d | 1 | 0.47mi |
| 77 California St Unit 1 Buffalo, NY | 2.0 | 1.0 | 800 | $1,100 | $1.38 | 43d | 1 | 0.53mi |
| 100 Forest Ave Buffalo, NY | 2.0–4.0 | 2.0–4.0 | 1304 | $640 | $0.49 | 1d | 14 | 0.53mi |
| 411 W Ferry St Buffalo, NY | 2.0 | 1.0 | 900 | $1,100 | $1.22 | 14d | 1 | 0.56mi |
| 478 Breckenridge St Buffalo, NY | 3.0 | 1.0 | 1100 | $1,575 | $1.43 | 43d | 1 | 0.58mi |
| 46 Hawley St #1 Buffalo, NY | 2.0 | 1.0 | 900 | $1,300 | $1.44 | 43d | 1 | 0.58mi |
| 466 W Delavan Ave Unit 3 Buffalo, NY | 1.0 | 1.0 | 800 | $1,350 | $1.69 | 43d | 1 | 0.60mi |
| 30 Abbottsford Pl Buffalo, NY | 1.0 | 1.0 | 600 | $1,100 | $1.83 | 1d | 1 | 0.66mi |
| 57 Abbottsford Pl Buffalo, NY | 2.0 | 1.0 | 1000 | $1,550 | $1.55 | 23d | 1 | 0.71mi |
| 236 Massachusetts Ave Unit 5 Buffalo, NY | 1.0 | 1.0 | 1000 | $1,050 | $1.05 | 14d | 1 | 0.72mi |
| 236 Massachusetts Ave Unit 5 Buffalo, NY | 1.0 | 1.0 | 1000 | $1,100 | $1.10 | 43d | 1 | 0.72mi |
| 460 Rhode Island St Buffalo, NY | 2.0 | 1.0 | 1089 | $1,500 | $1.38 | 14d | 1 | 0.76mi |
| 484 Ashland Ave Unit 9 Buffalo, NY | 2.0 | 1.0 | 800 | $1,250 | $1.56 | 23d | 1 | 0.79mi |
| 193 Massachusetts Ave Buffalo, NY | 1.0 | 1.0 | 700 | $925 | $1.32 | 43d | 1 | 0.79mi |
| 865 Richmond Ave Unit Rear Buffalo, NY | 2.0 | 1.0 | 850 | $1,100 | $1.29 | 43d | 1 | 0.80mi |
| 116 Bidwell Pkwy Buffalo, NY | 1.0 | 1.0 | 550 | $1,375 | $2.50 | 3d | 3 | 0.81mi |
| 44 Lowell Pl Buffalo, NY | 1.0 | 1.0 | 850 | $1,200 | $1.41 | 11d | 1 | 0.84mi |
| 1015 Elmwood Ave Unit 2 Buffalo, NY | 1.0 | 1.0 | 900 | $1,400 | $1.56 | 43d | 1 | 0.92mi |
| 1015 Elmwood Ave Unit 3 Buffalo, NY | 2.0 | 2.0 | 1000 | $1,400 | $1.40 | 43d | 1 | 0.92mi |
| 664 Auburn Ave Unit 2 Buffalo, NY | 2.0 | 1.0 | 900 | $2,200 | $2.44 | 43d | 1 | 0.92mi |
| 175 Saint James Pl Unit Lower Buffalo, NY | 1.0 | 1.0 | 940 | $1,320 | $1.40 | 43d | 1 | 0.92mi |
| 885 Niagara St Buffalo, NY | 1.0 | 1.0 | 875 | $619 | $0.71 | 43d | 1 | 0.94mi |
| 1116 Elmwood Ave Buffalo, NY | 1.0 | 1.0 | 700 | $995 | $1.42 | 43d | 1 | 0.96mi |
| 102 17th St Buffalo, NY | 2.0 | 1.0 | 1086 | $1,290 | $1.19 | 23d | 1 | 0.98mi |
| 256 14th St Unit 1 Buffalo, NY | 2.0 | 1.0 | 800 | $1,100 | $1.38 | 14d | 1 | 0.98mi |
| 273 Richmond Ave Buffalo, NY | 1.0–2.0 | 1.0–1.5 | 789 | $1,819 | $2.31 | 23d | 1 | 0.99mi |
| 504 Elmwood Ave Unit 202 Buffalo, NY | 1.0 | 1.0 | 602 | $1,250 | $2.08 | 43d | 1 | 1.10mi |
| 346 Bryant St Buffalo, NY | 2.0 | 1.0 | 792 | $1,834 | $2.32 | 2d | 1 | 1.11mi |
| 1920 Niagara St Unit 1 Buffalo, NY | 2.0 | 1.0 | 695 | $999 | $1.44 | 43d | 1 | 1.16mi |
| 246 Bryant St Unit 5A Buffalo, NY | 1.0 | 1.0 | 800 | $1,100 | $1.38 | 23d | 1 | 1.25mi |
| 374 Elmwood Ave Unit 2 Buffalo, NY | 1.0 | 1.0 | 700 | $1,300 | $1.86 | 23d | 1 | 1.27mi |
| 374 Elmwood Ave Apt 4 Buffalo, NY | 1.0 | 1.0 | 700 | $1,100 | $1.57 | 43d | 1 | 1.27mi |
Listing history 15 events
-
2026-06-18days on market $45,000 Active 18 DOM
-
2026-06-17days on market $45,000 Active 17 DOM
-
2026-06-16days on market $45,000 Active 16 DOM
-
2026-06-15days on market $45,000 Active 15 DOM
-
2026-06-13days on market $45,000 Active 13 DOM
-
2026-06-13days on market $45,000 Active 12 DOM
-
2026-06-10days on market $45,000 Active 10 DOM
-
2026-06-09days on market $45,000 Active 9 DOM
-
2026-06-08statusdays on market $45,000 Active 8 DOM
-
2026-06-08status $45,000 Active Under Contract 7 DOM
-
2026-06-07days on market $45,000 Active 7 DOM
-
2026-06-03days on market $45,000 Active 3 DOM
-
2026-06-02days on market $45,000 Active 2 DOM
-
2026-06-01remarks 699-char remark
-
2026-06-01$45,000 Active 1 DOM
ⓘ Source: listings_history table (triggers on properties + properties_extension) + one-shot
backfill from property_details.listing_events for pre-trigger history.
Tax reassessment forecast NY · Partial reset (capped growth)
- Current annual tax
- $317 · $26/mo
- Projected year-2 tax
- $539 · $45/mo
- Expected delta
- +$222/yr (+$18/mo · 69.9%)
ⓘ Screening estimate from a state-policy table — verify with the county assessor before closing.
Climate risk First Street
- Flood 1/10 Low FEMA zone X (unshaded) · 0% chance over 30 yrs
- Wildfire 1/10 Low
- Heat 3/10 Moderate 7 d/yr ≥92°F today · 15 d/yr by 30 yrs out
- Wind 1/10 Low
- Air quality 4/10 Moderate 4 unhealthy d/yr today · 9 by 30 yrs out
Nearby sold comps map
Loading sold comps map…
Walkable amenities ~0.75 mi
Loading nearby amenities…
Taxation est. · year 1
- Rental income
- $16,420
- − Mortgage interest
- −$2,521
- − Property taxes
- −$317
- − Insurance
- −$225
- − Repairs & maintenance
- −$1,314
- − Management
- −$1,314
- − Depreciation
- −$1,309
- Taxable income
- $9,421
- Est. tax owed @ 24.0%
- −$2,261
- After-tax cash flow
- $7,337/yr
For passive investors: Depreciation is non-cash, so a rental often shows a tax loss while cash-flowing — sheltering income. Rental losses are passive: they offset passive income freely, and up to $25,000/yr can offset ordinary (W-2) income if you actively participate and your MAGI is under $100k (phasing out to $0 by $150k); unused losses carry forward. On sale, claimed depreciation is recaptured at up to 25%, and gains may owe capital-gains tax (a 1031 exchange can defer both). Figures are a year-1 estimate at your 24.0% rate — not tax advice; consult a CPA.
Schools (NCES district)
- District
- Buffalo City School District
- NCES district ID
- 3605850
- Math proficiency
- 41% ▲ 11.00%
- Reading proficiency
- 40% ▲ 7.00%
- Median HH income
- $31,665
- Composite
- 33.17/100
- National rank
- #5544
- State rank
- #535 of 590 in NY
Livability — Buffalo
- Score
- 77/100
- State rank
- #195
- US rank
- #3011
Category grades
Schools grade is shown separately in the Schools card above.
Census & demographics
- Census place
- Buffalo, NY
- County
- Erie County · 714,559 people
- City population
- 440,021
- Metro
- Buffalo-Cheektowaga, NY
- Population (ZIP)
- 24,107
- Household income
- $53,870
- Rent vs Own
- Severe rent burden
- 1501.0
Population outlook (Erie County) Hauer SSP2
- Today (2025)
- 933,037 people
- By 2030
- 935,181 · +0.2%
- By 2040
- 928,531 · -0.5%
- By 2050
- 905,725 · -2.9%
- By 2075
- 834,037 · -10.6%
- By 2100
- 708,033 · -24.1%
Race, ethnicity, and origin ACS 2023
- Neighborhood character
- Highly diverse neighborhood (Simpson 0.70)
- Race & ethnicity
- White 46% Hispanic / Latino 20% Black 18% Asian 12% Two or more races 10%
- Hispanic origin (detail)
- Mexican 1% Puerto Rican 16% Dominican 1%
- Common ancestry
- Romanian 6% Slovak 3% Lithuanian 3%
- Foreign-born
- 16% · Philippines, Canada, India
- Languages at home
- 68% English-only · Spanish 12% Other Asian/Pacific 7% Arabic 3%
Political lean MEDSL · Erie
- 2024 margin
- Lean D (+9.7) · D 54.8% · R 45.2%
- 2008→2024 swing
- -7.9pp toward R · 2008: 17.5pp · 2024: 9.7pp
- All cycles
- 2024: D+9.7 2020: D+14.7 2016: D+4.8 2012: D+15.6 2008: D+17.5
Not yet ingested
- Civics
- —
Market trends
- HPI YoY
- ▲ 7.51%
- Current HPI
- 448.4879
- Rent YoY
- ▼ -0.49%
- Metro
- Buffalo-Cheektowaga, NY
- State GDP YoY
- ▲ 2.60%
- F500 in state
- 92
Industry mix (Fortune 500 HQ in NY)
| Industry | F500 HQs | Revenue |
|---|---|---|
| Financial Services | 10 | $950B |
|
||
| Consumer Goods | 9 | $162B |
|
||
| Insurance | 4 | $225B |
|
||
| Telecommunications | 2 | $144B |
|
||
| Pharmaceuticals | 2 | $112B |
|
||
| Media / Entertainment | 2 | $69B |
|
||
Price history
-43.8% since first listed2 events — show timeline
- 2026-05-31 Listed $45,000 WNYREIS
- 2006-06-07 Sold (Public Records) $80,000 Public Records
Property tax history
+10.2%/yrLatest (2025): $317 · +28.6% YoY. Source: county tax records.
Cash-flow waterfall
monthlySold comps — $/sqft
last 12 mo · ≤1 miLoading sold comps…