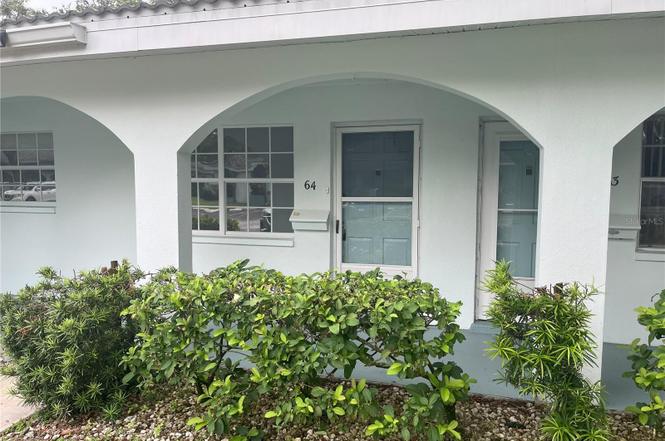
11200 102nd Ave #64 · Seminole, FL
Flood risk 1/10 · Minimal
- FEMA flood zone
- X (unshaded)
- Chance of flooding over 30 yrs
- 0.0%
- Est. flood insurance / yr
- $507 – $1,088
Fire risk 1/10 · Minimal
- Est. fire insurance / yr
- $947 – $1,759
Heat risk 10/10 · Severe
- Hot days now (above 107°F)
- 7 days/yr
- Hot days in 30 yrs
- 25 days/yr
Wind risk 10/10 · Severe
- Chance of severe wind over 30 yrs
- 99.0%
Air-quality risk 3/10 · Minor
- Unhealthy air days now
- 2 days/yr
- Unhealthy air days in 30 yrs
- 3 days/yr
Risk factors via First Street. Map © Google.
Why this score? — see what drove the D grade
The composite is a weighted blend of 9 inputs, each scored 0–100. Each bar is that input's sub-score; the figure is the points it added to the 100-point composite (weight × sub-score).
- Cash flow +9.8/30.0
- 1% rule +9.2/10.0
- ARV discount +7.5/15.0
- Livability +4.4/5.0
- Schools +4.3/10.0
- DSCR +2.8/10.0
- Rent growth +2.8/5.0
- Condition / age +2.5/5.0
- Appreciation +0.0/10.0
$149,900
🖨 Deal sheet (PDF) 📄 Offer letter ✓ Due diligence
Listing remarks
Simple Living, Sunshine, and a Place to Call Your Own Welcome to your next chapter in Twin Oaks, a peaceful 55+ community in the heart of Seminole. This inviting villa offers the perfect blend of comfort and simplicity—ideal for enjoying everything Florida has, without the upkeep. Relax in your bright living space, enjoy quiet mornings, and spend your days just minutes from the Gulf beaches. With a recent price adjustment, this home now presents an incredible opportunity to own in a location where others are still waiting. Come experience it in person—this might be the one that finally feels right.
Key facts
- Ground floor condo
- Corian countertops
- Maple wood cabinetry
Tags
Property features AI
Finance
- Financial info: Total annual association fees: $8,520; Lease restrictions apply
- HOA & community: Monthly condo fee of $595; Total monthly fees $710 (includes condo fee and additional maintenance); Monthly maintenance amount in addition to HOA: $115; Association name: Qualified Property Management (association approval required); Association fee includes cable TV, common area taxes, pool, escrow reserves, insurance, internet, building and grounds maintenance, pest control, sewer, trash and water; Community features include clubhouse, pool, sidewalks, street lights; buyer approval required; Senior community; Pets not allowed
Exterior
- Parking: Assigned parking; Guest parking
- Utilities: Public water; Public sewer; Electricity connected; Cable available and connected; High-speed internet / broadband available; Water connected; Sewer connected
- Home design: Residential condominium; One story; Faces north; First-floor unit
- Construction: Block, concrete and stucco construction; Tile roof; Slab foundation; Building name: TWIN OAKS APT VI; Built as condominium
- Exterior features: Lighting; Private mailbox; Sidewalks; Vinyl fencing; Asphalt road access
Interior
- Kitchen: Dishwasher; Disposal
- Bedrooms: 2 bedrooms
- Flooring: Carpet; Ceramic tile
- Bathrooms: 1 full bathroom
- Heating & cooling: Central heating (electric); Central air conditioning
- Interior features: Eat-in kitchen; Window treatments; 6 total rooms
- Laundry & utility: Inside laundry with washer and dryer hookups; Electric dryer hookup; Laundry closet; Common area laundry access
Neighborhood map
What this means for you Summary
Snapshot
- This is a 2-bed/1.0-bath condo listed at $150k.
Deal economics
- At list price, monthly cash flow is $-96 ($-1k/yr) — negative.
- To cash-flow at today's rent, offer at most $133k (11.3% below list).
- Meets the 1% rule at list price ($2k rent vs $150k).
- Recommended offer: $132k (12.0% below list) — sets the bar for market timing.
- Cap rate 5.5% vs local median 3.6% in Seminole — top-decile yield for the area; either an underpriced asset or a hidden risk that comps aren't pricing in. Stress-test before assuming the spread holds.
Location & tenants
- Location reads 88/100 on livability (#5 in FL, #174 nationally) — a professional / high-income tenant draw. Strengths: commute A+, housing A+, health & safety A+.
- Pinellas (suburban): math 51% / reading 51% proficiency, ranked #31 of 73 in FL (top 42%) — acceptable for families but not a draw, mixed tenant base, ~2y average lease.
- Zoned schools: Seminole Elementary School (math 65% / reading 57%, grade B, #653 of 2,144 statewide, top 31%, 428 students, 59% FRL); Osceola Middle School (math 48% / reading 45%, grade D+, #297 of 571 statewide, top 52%, 1,009 students, 52% FRL); Richard O Jacobson Technical High School At Seminole (math 52% / reading 53%, grade C-, #154 of 667 statewide, top 24%, 578 students, 45% FRL) — zoned schools at 52% FRL track the district average.
- Market conditions: Rents rising (+1.4%/yr); 140 active listings in the ZIP; 30 comparable units currently listed for rent nearby; rentals leasing fast (median 13d on market — plan ~1-2 weeks tenant-placement turnaround); 2,676 units permitted in Pinellas County in 2024 (1,422 in 5+ unit buildings).
- This rent runs 39% of the median local income ($65k/yr) — at the standard rent-burdened threshold; future hikes will face affordability resistance.
Forward outlook
- Local home prices are declining (-3.0%/yr); year-one equity from $1k of loan paydown is wiped out by about $4k of value loss. Plan a longer hold.
- Pinellas County population projected at +14% by 2050 — modest demand growth; plan on rents tracking national, not racing it.
Negotiation context
- It's been on market 341 days — a 12% lower offer ($132k) is reasonable based on typical stale-listing flexibility.
- 3 sale attempts since 2y ago; this cycle's ask has dropped $10k (6%) from the opening price — seller is motivated, your offer sets the floor, not the list.
- Current owner paid $122k; 23% above their basis — modest negotiation headroom, anchor on the comps not their cost.
Risks & watch-outs
- Watch-outs: HOA is 33% of rent.
- Climate carrying-cost: severe wind risk, 99% chance of damaging wind over 30y; extreme-heat days projected 7→25/yr by 2055 (HVAC capex compounding) — expect insurance premiums to compound above CPI over the hold.
Questions for the listing agent
- What do current leases actually rent for vs. the listed asking? Can we see a recent rent roll and the last 12 months of T-12 income?
- It's been on market 341 days. Have you received any prior offers? Is the seller open to a 12% concession, seller financing, or rate buy-down credit?
- Built in 1973 — when were the roof, HVAC, electrical panel, plumbing, and water heater last replaced?
- What does the HOA fee cover, when was the last increase, and are there any pending special assessments or reserve-fund shortfalls?
- Any open or pending special assessments — roof, HVAC, plumbing, elevator, façade? What's the per-unit balance and payoff schedule, and is the seller paying it off at close or rolling it to the buyer?
- Why hasn't it sold? Are there any deal-killer items the seller is aware of (foundation, flood, title, zoning, code violations)?
- Is there a deadline driving the sale (1031 exchange, divorce, estate, relocation)? That informs how much negotiation room exists.
- Schools are B-rated — typically a magnet for longer-tenancy family renters. What's the average tenant stay here, and is there a school-zone premium baked into asking?
- The area grade is low — what's the realistic commute time and amenity access for the typical tenant pool here? Any planned neighborhood developments (good or bad) we should know about?
- What's the average days-on-market for RENTAL listings here right now (not sales)? A rising rental-DOM trend means longer vacancies and softer asking-rent achievability than the comps imply.
- What's the recent tenant-quality profile in this submarket — average credit score on applications, eviction rate, late-payment / NSF rate, and stable-employment percentage? A property-management company in the area should have these aggregated.
- How much new apartment / multifamily construction is in the pipeline within 1–3 miles? Heavy new supply (>2% of stock underway) typically softens rents 12–24 months out; light construction supports rent growth.
Investment metrics
- 1% rule
- 1.42% ✓
- Cap rate
- 5.53%
- Cash-on-cash
- -2.74%
- DSCR
- 0.88
- GRM
- 5.9
CMA / ARV
No comps found within radius.
Projected returns pro-forma
-3.0% appreciation · 1.38% rent growth · sell at horizon
- IRR
- -23.7%
- Equity multiple
- 0.21×
- Total profit
- $-33,311
- Equity at exit
- $22,351
- IRR
- -27.8%
- Equity multiple
- -0.15×
- Total profit
- $-48,416
- Equity at exit
- $12,961
Cash invested: $41,972 (down + closing). Projections, not guarantees.
Landlord ↔ Tenant lean methodology
- Overall (STATE)
- 87 Strongly Landlord-Friendly
- State Florida
- 87 Strongly Landlord-Friendly · R+3
- County
- — inherits STATE
- City
- — inherits STATE
ZIP-level market 33778
- Rents YoY
- 1.4%
- Active inventory
- 140
- Price-to-rent
- 5.9×
Monthly cashflow live
- Estimated rent
- $2,122 high interval (Pro) →
- Mortgage (P&I)
- −$786
- Tax from tax record
- −$214 /mo · $2,565/yr
- Insurance
- −$62
- HOA
- −$710
- Vacancy / Maint / Mgmt
- −$446
- Net cashflow
- $-96
Break-even live
Sensitivity live
| Price | -10% $-11 | -5% $-53 | +0% $-96 | +5% $-138 | +10% $-181 |
|---|---|---|---|---|---|
| Rent | -10% $-263 | -5% $-180 | +0% $-96 | +5% $-12 | +10% $72 |
| Rate | -1.0pp $-20 | -0.5pp $-58 | base $-96 | +0.5pp $-135 | +1.0pp $-174 |
UW: 25.0% down · 7.5% · 30yr · 1.5% tax · 5.0% vac · 8.0% maint · 8.0% mgmt
Financing live
Cash to close
- Down payment
- $37,475
- Closing costs
- $4,497
- Reserves months
- —
- Total cash needed
- —
Loan-product check · same deal, 3 products live
Conventional
25% down · 7.5% · 30yr
- Down + closing
- —
- Monthly P&I
- —
- Monthly cashflow
- —
- DSCR
- —
- Eligible?
- —
Personal DTI + credit; lowest rate.
DSCR
20% down · 8.5% · 30yr
- Down + closing
- —
- Monthly P&I
- —
- Monthly cashflow
- —
- DSCR
- —
- Eligible?
- —
No personal income docs; deal must DSCR.
Hard money
10% down · 12.0% · 12mo
- Down + closing
- —
- Monthly P&I
- —
- Monthly cashflow
- —
- DSCR
- —
- Eligible?
- —
Short-term bridge; refi at stabilization.
Rent comps 30 comps
| Address | Beds | Baths | Sqft | Rent | $/sqft | DOM | Units | Dist |
|---|---|---|---|---|---|---|---|---|
| 11114 101st Ave Seminole, FL | 2.0 | 1.0 | 1135 | $2,300 | $2.03 | 6d | 1 | 0.10mi |
| 9881 113th St #215 Seminole, FL | 2.0 | 2.0 | 1150 | $1,600 | $1.39 | 19d | 1 | 0.12mi |
| 9924 109th St Seminole, FL | 3.0 | 2.0 | 1428 | $2,500 | $1.75 | 6d | 1 | 0.25mi |
| 11013 Temple Ave Seminole, FL | 3.0 | 1.0 | 951 | $2,050 | $2.16 | 6d | 1 | 0.29mi |
| 10932 104th Ave Largo, FL | 2.0 | 1.0 | 962 | $1,950 | $2.03 | 26d | 1 | 0.36mi |
| 10932 104th Ave Largo, FL | 2.0 | 1.0 | 962 | $1,950 | $2.03 | 22d | 1 | 0.36mi |
| 10888 Temple Ave Seminole, FL | 2.0 | 2.0 | 1101 | $2,150 | $1.95 | 6d | 1 | 0.52mi |
| 10659 108th St Largo, FL | 3.0 | 1.5 | 1380 | $2,550 | $1.85 | 26d | 1 | 0.56mi |
| 10887 111th Pl N Largo, FL | 3.0 | 2.0 | 1300 | $2,389 | $1.84 | 23d | 1 | 0.72mi |
| 9209 Seminole Blvd #139 Seminole, FL | 2.0 | 1.5 | 1015 | $1,800 | $1.77 | 26d | 1 | 0.73mi |
| 9209 Seminole Blvd Seminole, FL | 2.0 | 1.5 | 1015 | $1,700 | $1.67 | 5d | 2 | 0.74mi |
| 9209 Seminole Blvd Seminole, FL | 2.0 | 1.5 | 1015 | $1,675 | $1.65 | 6d | 3 | 0.74mi |
| 11290 109th Ln Largo, FL | 2.0 | 1.0 | 988 | $1,995 | $2.02 | 26d | 1 | 0.83mi |
| 10580 112th Ave Largo, FL | 3.0 | 1.0 | 925 | $1,995 | $2.16 | 6d | 1 | 0.90mi |
| 11200 86th Ave #202 Seminole, FL | 2.0 | 1.0 | 836 | $1,700 | $2.03 | 6d | 1 | 0.95mi |
| 11100 86th Ave #101 Seminole, FL | 1.0 | 1.0 | 874 | $1,350 | $1.54 | 19d | 1 | 0.96mi |
| 10560 114th Ter Largo, FL | 3.0 | 1.0 | 1232 | $3,000 | $2.44 | 6d | 1 | 1.00mi |
| 10548 86th Ave Seminole, FL | 2.0 | 2.0 | 1400 | $2,300 | $1.64 | 26d | 1 | 1.10mi |
| 11707 108th St Unit 1018171P Largo, FL | 3.0 | 2.0 | 1259 | $3,050 | $2.42 | 0d | 1 | 1.11mi |
| 10568 117th Dr Largo, FL | 3.0 | 2.0 | 1118 | $2,400 | $2.15 | 0d | 1 | 1.15mi |
| 11525 81st Pl Seminole, FL | 3.0 | 2.0 | 1320 | $2,795 | $2.12 | 0d | 1 | 1.21mi |
| 8080 112th St #108 Seminole, FL | 1.0 | 1.0 | 874 | $1,700 | $1.95 | 26d | 1 | 1.24mi |
| 10495 118th Ave Largo, FL | 3.0 | 2.0 | 1169 | $2,250 | $1.92 | 6d | 1 | 1.25mi |
| 11201 80th Ave #303 Seminole, FL | 2.0 | 2.0 | 1000 | $1,800 | $1.80 | 26d | 1 | 1.26mi |
| 12100 Seminole Blvd Largo, FL | 2.0 | 2.0 | 1050 | $1,750 | $1.67 | 26d | 1 | 1.26mi |
| 11424 79th Ave Seminole, FL | 2.0 | 2.0 | 1344 | $2,650 | $1.97 | 26d | 1 | 1.37mi |
| 8201 120th St Seminole, FL | 3.0 | 2.0 | 1056 | $2,500 | $2.37 | 12d | 1 | 1.39mi |
| 11201 122nd Ave Largo, FL | 1.0–2.0 | 1.0–2.0 | 867 | $2,150 | $2.48 | 0d | 2 | 1.41mi |
| 10160 Sailwinds Blvd S Largo, FL | 2.0 | 2.0 | 901 | $1,950 | $2.16 | 26d | 2 | 1.45mi |
| 10155 Sailwinds Blvd S #204 Largo, FL | 2.0 | 2.0 | 1018 | $1,695 | $1.67 | 0d | 1 | 1.46mi |
HOA detail condo
- Monthly dues
- $710 · $8,520/yr
- Assessments
- None detected in remarks — confirm with the listing agent.
Listing history 26 events
-
2026-06-22days on market $149,900 Active 341 DOM
-
2026-06-18days on market $149,900 Active 338 DOM
-
2026-06-17days on market $149,900 Active 337 DOM
-
2026-06-16days on market $149,900 Active 336 DOM
-
2026-06-15days on market $149,900 Active 335 DOM
-
2026-06-13days on market $149,900 Active 333 DOM
-
2026-06-09days on market $149,900 Active 329 DOM
-
2026-06-08days on market $149,900 Active 328 DOM
-
2026-06-07days on market $149,900 Active 327 DOM
-
2026-06-04days on market $149,900 Active 324 DOM
-
2026-06-03days on market $149,900 Active 323 DOM
-
2026-06-01days on market $149,900 Active 321 DOM
-
2026-05-31days on market $149,900 Active 320 DOM
-
2026-01-14status Active
-
2026-01-07historical
-
2025-10-05price $149,900
-
2025-07-08$159,900 Active
-
2024-12-17historical
-
2024-07-09price $169,000
-
2024-06-20$189,000 Active
-
2006-07-13soldstatus $122,000
-
2002-07-02soldstatus $58,000
-
2001-11-02soldstatus $57,000
-
1999-08-18soldstatus $44,500
-
1990-07-27soldstatus $37,500
-
1990-07-27soldstatus $37,500
ⓘ Source: listings_history table (triggers on properties + properties_extension) + one-shot
backfill from property_details.listing_events for pre-trigger history.
Tax reassessment forecast FL · Resets to sale price
- Current annual tax
- $2,565 · $214/mo
- Projected year-2 tax
- $2,565 · $214/mo
- Expected delta
- $0/yr ($0/mo · 0.0%)
ⓘ Screening estimate from a state-policy table — verify with the county assessor before closing.
Climate risk First Street
- Flood 1/10 Low FEMA zone X (unshaded) · 0% chance over 30 yrs
- Wildfire 1/10 Low
- Heat 10/10 Extreme 7 d/yr ≥107°F today · 25 d/yr by 30 yrs out
- Wind 10/10 Extreme 99% chance of damaging wind over 30 yrs
- Air quality 3/10 Moderate 2 unhealthy d/yr today · 3 by 30 yrs out
Nearby sold comps map
Loading sold comps map…
Walkable amenities ~0.75 mi
Loading nearby amenities…
Taxation est. · year 1
- Rental income
- $25,466
- − Mortgage interest
- −$8,397
- − Property taxes
- −$2,565
- − Insurance
- −$750
- − Repairs & maintenance
- −$2,037
- − Management
- −$2,037
- − HOA
- −$8,520
- − Depreciation
- −$4,361
- Taxable loss
- −$3,201
- Est. tax savings @ 24.0%
- +$768
- After-tax cash flow
- $-381/yr
For passive investors: Depreciation is non-cash, so a rental often shows a tax loss while cash-flowing — sheltering income. Rental losses are passive: they offset passive income freely, and up to $25,000/yr can offset ordinary (W-2) income if you actively participate and your MAGI is under $100k (phasing out to $0 by $150k); unused losses carry forward. On sale, claimed depreciation is recaptured at up to 25%, and gains may owe capital-gains tax (a 1031 exchange can defer both). Figures are a year-1 estimate at your 24.0% rate — not tax advice; consult a CPA.
Schools (NCES district)
- District
- Pinellas
- NCES district ID
- 1201560
- Math proficiency
- 51% ▼ -5.00%
- Reading proficiency
- 51% ▼ -3.00%
- Median HH income
- $46,270
- Composite
- 43.27/100
- National rank
- #3046
- State rank
- #31 of 73 in FL
Livability — Seminole
- Score
- 88/100
- State rank
- #5
- US rank
- #174
Category grades
Schools grade is shown separately in the Schools card above.
Census & demographics
- County
- Pinellas County · 939,478 people
- City population
- 42,315
- Metro
- Tampa-St. Petersburg-Clearwater, FL
- Population (ZIP)
- 16,807
- Household income
- $65,355
- Rent vs Own
- Severe rent burden
- 261.0
Population outlook (Pinellas County) Hauer SSP2
- Today (2025)
- 1,027,532 people
- By 2030
- 1,063,586 · +3.5%
- By 2040
- 1,125,020 · +9.5%
- By 2050
- 1,168,637 · +13.7%
- By 2075
- 1,265,188 · +23.1%
- By 2100
- 1,260,357 · +22.7%
Race, ethnicity, and origin ACS 2023
- Neighborhood character
- Predominantly White (72%)
- Race & ethnicity
- White 72% Hispanic / Latino 15% Two or more races 11% Black 9% Asian 2%
- Hispanic origin (detail)
- Puerto Rican 3% Cuban 6%
- Common ancestry
- Romanian 3% Italian 3% Lithuanian 3%
- Foreign-born
- 13% · Canada, Vietnam, Jamaica
- Languages at home
- 85% English-only · Spanish 10% Vietnamese 1% French/Haitian/Cajun 1%
Political lean MEDSL · Pinellas
- 2024 margin
- Lean R (+5.2) · D 46.9% · R 52.1%
- 2008→2024 swing
- -13.5pp toward R · 2008: 8.3pp · 2024: -5.2pp
- All cycles
- 2024: R+5.2 2020: D+0.2 2016: R+1.1 2012: D+5.6 2008: D+8.3
Not yet ingested
- Civics
- —
Market trends
- HPI YoY
- ▼ -320.64%
- Current HPI
- 369.3008
- Rent YoY
- ▲ 1.38%
- Metro
- Tampa-St. Petersburg-Clearwater, FL
- State GDP YoY
- ▲ 3.28%
- F500 in state
- 36
Industry mix (Fortune 500 HQ in FL)
| Industry | F500 HQs | Revenue |
|---|---|---|
| Industrial Technology | 2 | $29B |
|
||
| Insurance | 2 | $17B |
|
||
| Retail | 1 | $60B |
|
||
| Technology Distribution | 1 | $58B |
|
||
| Homebuilding | 1 | $35B |
|
||
| Technology Manufacturing | 1 | $35B |
|
||
Price history
+299.7% since first listed13 events — show timeline
- 2026-01-14 Relisted — Stellar MLS as Distributed by MLS Grid
- 2026-01-07 Listing Removed — Stellar MLS as Distributed by MLS Grid
- 2025-10-05 Price Changed $149,900 Stellar MLS as Distributed by MLS Grid
- 2025-07-08 Listed $159,900 Stellar MLS as Distributed by MLS Grid
- 2024-12-17 Listing Removed — Stellar MLS as Distributed by MLS Grid
- 2024-07-09 Price Changed $169,000 Stellar MLS as Distributed by MLS Grid
- 2024-06-20 Listed $189,000 Stellar MLS as Distributed by MLS Grid
- 2006-07-13 Sold (Public Records) $122,000 Public Records
- 2002-07-02 Sold (Public Records) $58,000 Public Records
- 2001-11-02 Sold (Public Records) $57,000 Public Records
- 1999-08-18 Sold (Public Records) $44,500 Public Records
- 1990-07-27 Sold (Public Records) $37,500 Public Records
- 1990-07-27 Sold (Public Records) $37,500 Public Records
Property tax history
+10.0%/yrLatest (2025): $2,565 · +0.5% YoY. Source: county tax records.
Cash-flow waterfall
monthlySold comps — $/sqft
last 12 mo · ≤1 miLoading sold comps…