5360 Beaufain Blvd · Virginia Beach, VA
Flood risk 1/10 · Minimal
- FEMA flood zone
- X (unshaded)
- Chance of flooding over 30 yrs
- 0.0%
- Est. flood insurance / yr
- $507 – $1,088
Fire risk 4/10 · Minor
- Est. fire insurance / yr
- $666 – $1,236
Heat risk 9/10 · Severe
- Hot days now (above 105°F)
- 7 days/yr
- Hot days in 30 yrs
- 16 days/yr
Wind risk 8/10 · Major
- Chance of severe wind over 30 yrs
- 80.0%
Air-quality risk 5/10 · Moderate
- Unhealthy air days now
- 7 days/yr
- Unhealthy air days in 30 yrs
- 7 days/yr
Risk factors via First Street. Map © Google.
Why this score? — see what drove the D+ grade
The composite is a weighted blend of 9 inputs, each scored 0–100. Each bar is that input's sub-score; the figure is the points it added to the 100-point composite (weight × sub-score).
- ARV discount +15.0/15.0
- Cash flow +11.8/30.0
- Schools +6.4/10.0
- Livability +4.2/5.0
- Rent growth +4.1/5.0
- DSCR +3.5/10.0
- 1% rule +2.5/10.0
- Condition / age +2.5/5.0
- Appreciation +0.0/10.0
$349,900
🖨 Deal sheet (PDF) 📄 Offer letter ✓ Due diligence
Listing remarks
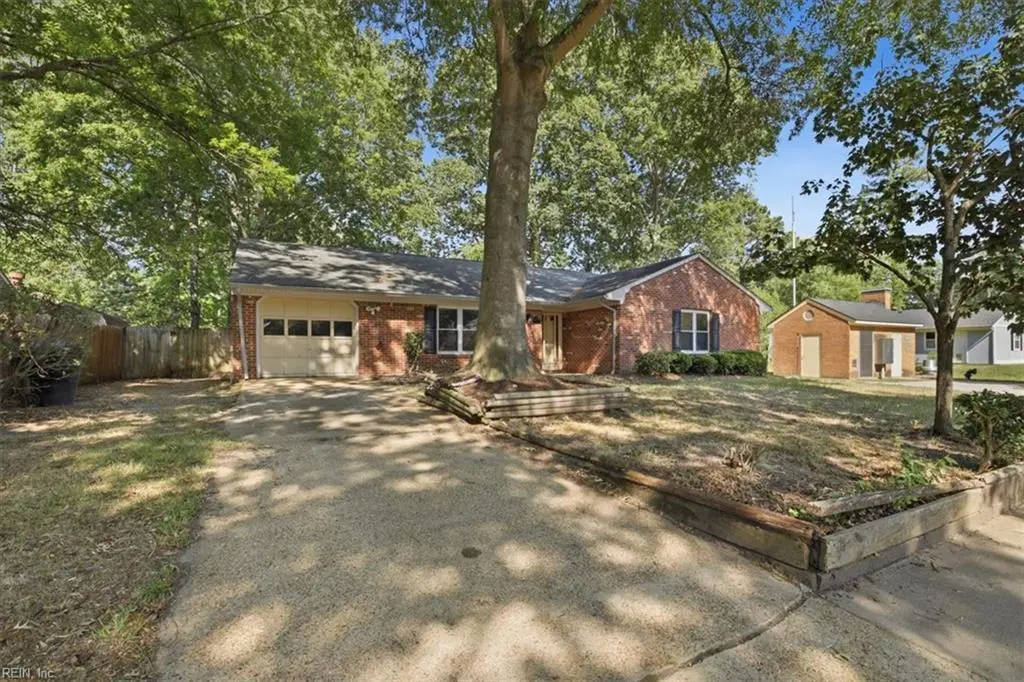
Charming Solid Brick Rambler Situated on a . 20 Acre Lot Featuring a 1-Car Garage. This Home offers a Spacious Kitchen with Plenty of Room for Cooking and Gathering, Along with Generously Sized Bedrooms for Comfortable Living. Updates in Bathrooms, Wood-Burning Stove and Additional Storage Shed for All Your Outdoor Needs. With Solid Bones and Desirable Features Throughout, This Property Presents an Excellent Opportunity for Buyers Looking to add their Personal Touches and Updates. Hurry This Will Not Last! Sold As-Is.
Key facts
- Updates in bathrooms
- Spacious kitchen
- Wood-burning stove
Tags
Property features AI
Finance
- HOA & community: No HOA fees
Exterior
- Parking: Off-street parking; Street parking; Detached garage (approximately 242 sq. ft.)
- Utilities: City/County water; City/County sewer; Electric water heater
- Home design: Detached ranch-style home; Single-story
- Construction: Slab foundation
- Exterior features: Brick siding; Asphalt shingle roof; Approximately 0.20-acre lot
Interior
- Kitchen: Electric range; Refrigerator
- Bedrooms: Bedroom and full bathroom on the first floor; Seven total rooms
- Flooring: Carpet
- Bathrooms: Two full bathrooms
- Heating & cooling: Electric heating; Central air conditioning
- Interior features: Carpet flooring
Neighborhood map
What this means for you Summary
Snapshot
- This is a 3-bed/2.0-bath single-family listed at $350k.
Deal economics
- At list price, monthly cash flow is $-96 ($-1k/yr) — negative.
- To cash-flow at today's rent, offer at most $333k (4.9% below list).
- To meet the 1% rule (rent ≥ 1% of price), the offer needs to be $263k (24.9% below list).
- Recommended offer: $263k (24.9% below list) — sets the bar for 1% rule.
- Cap rate 6.0% vs local median 3.5% in Virginia Beach — top-decile yield for the area; either an underpriced asset or a hidden risk that comps aren't pricing in. Stress-test before assuming the spread holds.
Location & tenants
- Location reads 83/100 on livability (#38 in VA, #880 nationally) — a professional / high-income tenant draw. Strengths: amenities A+, employment A+, housing A+; Watch: cost of living C-, commute F.
- Va Beach City Public School District (urban): math 69% / reading 78% proficiency, ranked #10 of 131 in VA (top 8%) — strong family-tenant draw, lease renewals of 3-5y typical.
- Zoned schools: Centerville Elementary (math 70% / reading 78%, grade A, #248 of 1,108 statewide, top 23%, 628 students, 32% FRL); Brandon Middle (math 54% / reading 68%, grade B+, #151 of 342 statewide, top 45%, 1,055 students, 52% FRL); Tallwood High (math 81% / reading 88%, grade A, #23 of 319 statewide, top 8%, 1,861 students, 44% FRL).
- Market conditions: Rents rising fast (+6.4%/yr); 234 active listings in the ZIP; 24 comparable units currently listed for rent nearby; rentals at typical pace (median 14d on market — plan ~3-4 weeks tenant-placement turnaround); solid renter incomes; 666 units permitted in Virginia Beach city in 2024 (347 in 5+ unit buildings).
- This rent runs 34% of the median local income ($92k/yr) — at the standard rent-burdened threshold; future hikes will face affordability resistance.
Forward outlook
- Local home prices are declining (-3.0%/yr); year-one equity from $2k of loan paydown is wiped out by about $10k of value loss. Plan a longer hold.
- Virginia Beach County population projected at +6% by 2050 — modest demand growth; plan on rents tracking national, not racing it.
Negotiation context
- It's been on market 18 days — a 2% lower offer ($345k) is reasonable based on typical stale-listing flexibility.
- Current owner paid $172k; list at $350k implies a 103% gain — meaningful room to come down on a strong offer.
Risks & watch-outs
- Climate carrying-cost: severe wind risk, 80% chance of damaging wind over 30y; extreme-heat days projected 7→16/yr by 2055 (HVAC capex compounding) — expect insurance premiums to compound above CPI over the hold.
Questions for the listing agent
- What do current leases actually rent for vs. the listed asking? Can we see a recent rent roll and the last 12 months of T-12 income?
- Built in 1977 — when were the roof, HVAC, electrical panel, plumbing, and water heater last replaced?
- Is there a deadline driving the sale (1031 exchange, divorce, estate, relocation)? That informs how much negotiation room exists.
- Schools are A-rated — typically a magnet for longer-tenancy family renters. What's the average tenant stay here, and is there a school-zone premium baked into asking?
- The area grade is low — what's the realistic commute time and amenity access for the typical tenant pool here? Any planned neighborhood developments (good or bad) we should know about?
- What's the average days-on-market for RENTAL listings here right now (not sales)? A rising rental-DOM trend means longer vacancies and softer asking-rent achievability than the comps imply.
- What's the recent tenant-quality profile in this submarket — average credit score on applications, eviction rate, late-payment / NSF rate, and stable-employment percentage? A property-management company in the area should have these aggregated.
- How much new for-sale + rental construction is in the pipeline within 1–3 miles? Heavy new supply typically softens prices + rents 12–24 months out; constrained supply supports both.
Investment metrics
- 1% rule
- 0.75% ✗
- Cap rate
- 5.96%
- Cash-on-cash
- -1.18%
- DSCR
- 0.95
- GRM
- 11.1
CMA / ARV
- ARV (on-the-fly)
- $444,754
- Comps found
- 12
Show comp detail 12 sales within ~0.75 mi
| Address | Dist | Beds/Ba | Sqft | Sold | Price | $/sf | Match |
|---|---|---|---|---|---|---|---|
| 5360 Beaufain Blvd | 0.00mi | 3/2.0 | 1,751 (0%) | 0mo | $345,000 | $197 | 100 |
| 5341 Beaufain Blvd | 0.08mi | 3/2.0 | 1,700 (-3%) | 2mo | $441,000 | $259 | 90 |
| 5485 Beaufain Blvd | 0.35mi | 4/2.0 (+1) | 1,646 (-6%) | 1mo | $436,100 | $265 | 68 |
| 5404 Peggy Cir | 0.54mi | 3/2.0 | 1,839 (+5%) | 0mo | $465,000 | $253 | 66 |
| 1952 Hidden Valley Dr | 0.36mi | 4/2.0 (+1) | 1,623 (-7%) | 1mo | $450,000 | $277 | 65 |
| 1749 Seaton Dr | 0.22mi | 4/2.0 (+1) | 1,953 (+12%) | 1mo | $496,000 | $254 | 65 |
| 5416 Doon St | 0.66mi | 3/2.0 | 1,698 (-3%) | 2mo | $425,000 | $250 | 62 |
| 1780 Joplin Ln | 0.70mi | 3/2.5 | 1,810 (+3%) | 0mo | $400,000 | $221 | 59 |
| 1817 Laplaca Ln | 0.46mi | 3/2.5 | 1,933 (+10%) | 1mo | $535,000 | $277 | 59 |
| 5224 Brockie St | 0.48mi | 4/2.5 (+1) | 1,900 (+8%) | 1mo | $515,000 | $271 | 56 |
| 5205 Perkins Ct | 0.72mi | 3/2.0 | 1,488 (-15%) | 2mo | $360,500 | $242 | 40 |
| 1864 Kempsville Crossing Ln | 0.65mi | 4/2.5 (+1) | 2,002 (+14%) | 2mo | $445,000 | $222 | 37 |
Match score weights: distance 35% · size 25% · config 20% · recency 20%. Top-matched comps best support the ARV.
Projected returns pro-forma
-3.0% appreciation · 6.36% rent growth · sell at horizon
- IRR
- -15.0%
- Equity multiple
- 0.45×
- Total profit
- $-53,759
- Equity at exit
- $52,171
- IRR
- -2.0%
- Equity multiple
- 0.85×
- Total profit
- $-14,767
- Equity at exit
- $30,253
Cash invested: $97,972 (down + closing). Projections, not guarantees.
Landlord ↔ Tenant lean methodology
- Overall (STATE)
- 55 Moderately Landlord-Leaning
- State Virginia
- 55 Moderately Landlord-Leaning · D+2
- County
- — inherits STATE
- City
- — inherits STATE
ZIP-level market 23464
- Rents YoY
- 6.4%
- Active inventory
- 234
- Price-to-rent
- 11.1×
Monthly cashflow live
- Estimated rent
- $2,629 high interval (Pro) →
- Mortgage (P&I)
- −$1,835
- Tax from tax record
- −$193 /mo · $2,311/yr
- Insurance
- −$146
- HOA
- −$0
- Vacancy / Maint / Mgmt
- −$552
- Net cashflow
- $-96
Break-even live
Sensitivity live
| Price | -10% $102 | -5% $3 | +0% $-96 | +5% $-195 | +10% $-294 |
|---|---|---|---|---|---|
| Rent | -10% $-304 | -5% $-200 | +0% $-96 | +5% $7 | +10% $111 |
| Rate | -1.0pp $80 | -0.5pp $-7 | base $-96 | +0.5pp $-187 | +1.0pp $-279 |
UW: 25.0% down · 7.5% · 30yr · 1.5% tax · 5.0% vac · 8.0% maint · 8.0% mgmt
Financing live
Cash to close
- Down payment
- $87,475
- Closing costs
- $10,497
- Reserves months
- —
- Total cash needed
- —
Loan-product check · same deal, 3 products live
Conventional
25% down · 7.5% · 30yr
- Down + closing
- —
- Monthly P&I
- —
- Monthly cashflow
- —
- DSCR
- —
- Eligible?
- —
Personal DTI + credit; lowest rate.
DSCR
20% down · 8.5% · 30yr
- Down + closing
- —
- Monthly P&I
- —
- Monthly cashflow
- —
- DSCR
- —
- Eligible?
- —
No personal income docs; deal must DSCR.
Hard money
10% down · 12.0% · 12mo
- Down + closing
- —
- Monthly P&I
- —
- Monthly cashflow
- —
- DSCR
- —
- Eligible?
- —
Short-term bridge; refi at stabilization.
Rent comps 24 comps
| Address | Beds | Baths | Sqft | Rent | $/sqft | DOM | Units | Dist |
|---|---|---|---|---|---|---|---|---|
| 1816 Blue Knob Rd Virginia Beach, VA | 4.0 | 2.0 | 2414 | $2,995 | $1.24 | 6d | 1 | 0.13mi |
| 5412 Dalrymple St Virginia Beach, VA | 4.0 | 2.5 | 2300 | $2,995 | $1.30 | 23d | 1 | 0.30mi |
| 5697 Magnolia Run Cir Virginia Beach, VA | 2.0–3.0 | 2.0 | 1344 | $2,797 | $2.08 | 3d | 5 | 0.40mi |
| 5533 Society Ct Virginia Beach, VA | 3.0 | 2.0 | 1464 | $2,495 | $1.70 | 6d | 1 | 0.43mi |
| 2229 Bizzone Cir Virginia Beach, VA | 3.0 | 2.5 | 1700 | $2,300 | $1.35 | 9d | 1 | 0.49mi |
| 5657 Infinity Ln Virginia Beach, VA | 1.0–2.0 | 1.0–2.0 | 967 | $2,063 | $2.13 | 3d | 13 | 0.55mi |
| 5465 Stewart Dr Virginia Beach, VA | 4.0 | 2.5 | 2526 | $3,500 | $1.39 | 9d | 1 | 0.66mi |
| 1877 John Brown Ln Virginia Beach, VA | 3.0 | 2.0 | 1348 | $2,400 | $1.78 | 23d | 1 | 0.68mi |
| 1801 Colleen Ct Virginia Beach, VA | 3.0 | 2.0 | 1474 | $2,600 | $1.76 | 25d | 1 | 0.78mi |
| 1548 Beachview Dr Virginia Beach, VA | 4.0 | 2.0 | 1800 | $2,800 | $1.56 | 16d | 1 | 0.80mi |
| 1556 Beachview Dr Virginia Beach, VA | 3.0 | 2.5 | 2208 | $2,900 | $1.31 | 6d | 1 | 0.81mi |
| 2052 Manassas Run Virginia Beach, VA | 4.0 | 2.5 | 1900 | $2,950 | $1.55 | 3d | 1 | 0.88mi |
| 1568 Dylan Dr Virginia Beach, VA | 4.0 | 3.0 | 1880 | $2,450 | $1.30 | 19d | 1 | 0.99mi |
| 1568 Dylan Dr Virginia Beach, VA | 4.0 | 3.0 | 1880 | $2,450 | $1.30 | 14d | 1 | 0.99mi |
| 1728 Rueger St Virginia Beach, VA | 3.0 | 2.0 | 1360 | $1,800 | $1.32 | 16d | 1 | 1.00mi |
| 5742 Simon St Virginia Beach, VA | 3.0 | 2.0 | 1500 | $1,995 | $1.33 | 9d | 1 | 1.08mi |
| 2100 Fort Belvoir Dr Virginia Beach, VA | 4.0 | 3.0 | 2278 | $2,850 | $1.25 | 3d | 1 | 1.08mi |
| 5872 Echingham Dr Virginia Beach, VA | 3.0 | 2.5 | 1633 | $2,595 | $1.59 | 12d | 1 | 1.22mi |
| 5125 Middlebrook Ct Virginia Beach, VA | 4.0 | 2.5 | 2395 | $3,195 | $1.33 | 23d | 1 | 1.26mi |
| 5104 Settlers Park Dr Virginia Beach, VA | 3.0 | 2.5 | 1540 | $2,200 | $1.43 | 16d | 1 | 1.30mi |
| 1547 Heritage Ave Virginia Beach, VA | 3.0 | 2.5 | 1665 | $2,295 | $1.38 | 25d | 1 | 1.33mi |
| 1563 Jameson Dr Virginia Beach, VA | 3.0 | 2.5 | 1334 | $2,200 | $1.65 | 6d | 1 | 1.45mi |
| 1520 Oak Knoll Ln Virginia Beach, VA | 3.0 | 2.5 | 1300 | $2,400 | $1.85 | 25d | 1 | 1.45mi |
| 1521 Jameson Dr Virginia Beach, VA | 3.0 | 2.5 | 1496 | $1,895 | $1.27 | 25d | 1 | 1.49mi |
Listing history 6 events
-
2026-06-03status $349,900 Under Contract 18 DOM
-
2026-06-02days on market $349,900 Active 18 DOM
-
2026-06-01days on market $349,900 Active 17 DOM
-
2026-05-31days on market $349,900 Active 16 DOM
-
2026-04-27$349,900 Active
-
2004-06-24soldstatus $172,000
ⓘ Source: listings_history table (triggers on properties + properties_extension) + one-shot
backfill from property_details.listing_events for pre-trigger history.
Tax reassessment forecast VA · Resets to sale price
- Current annual tax
- $2,311 · $193/mo
- Projected year-2 tax
- $2,869 · $239/mo
- Expected delta
- +$558/yr (+$47/mo · 24.2%)
ⓘ Screening estimate from a state-policy table — verify with the county assessor before closing.
Climate risk First Street
- Flood 1/10 Low FEMA zone X (unshaded) · 0% chance over 30 yrs
- Wildfire 4/10 Moderate
- Heat 9/10 Extreme 7 d/yr ≥105°F today · 16 d/yr by 30 yrs out
- Wind 8/10 Severe 80% chance of damaging wind over 30 yrs
- Air quality 5/10 Major 7 unhealthy d/yr today · 7 by 30 yrs out
Nearby sold comps map
Loading sold comps map…
Walkable amenities ~0.75 mi
Loading nearby amenities…
Taxation est. · year 1
- Rental income
- $31,548
- − Mortgage interest
- −$19,600
- − Property taxes
- −$2,311
- − Insurance
- −$1,750
- − Repairs & maintenance
- −$2,524
- − Management
- −$2,524
- − Depreciation
- −$10,179
- Taxable loss
- −$7,339
- Est. tax savings @ 24.0%
- +$1,761
- After-tax cash flow
- $605/yr
For passive investors: Depreciation is non-cash, so a rental often shows a tax loss while cash-flowing — sheltering income. Rental losses are passive: they offset passive income freely, and up to $25,000/yr can offset ordinary (W-2) income if you actively participate and your MAGI is under $100k (phasing out to $0 by $150k); unused losses carry forward. On sale, claimed depreciation is recaptured at up to 25%, and gains may owe capital-gains tax (a 1031 exchange can defer both). Figures are a year-1 estimate at your 24.0% rate — not tax advice; consult a CPA.
Schools (NCES district)
- District
- Va Beach City Public School District
- NCES district ID
- 5103840
- Math proficiency
- 69% ▼ -19.00%
- Reading proficiency
- 78% ▼ -7.00%
- Median HH income
- $66,452
- Composite
- 63.81/100
- National rank
- #594
- State rank
- #10 of 131 in VA
Livability — Virginia Beach
- Score
- 83/100
- State rank
- #38
- US rank
- #880
Category grades
Schools grade is shown separately in the Schools card above.
Census & demographics
- Census place
- Virginia Beach, VA
- County
- Virginia Beach City · 448,227 people
- City population
- 448,227
- Metro
- Virginia Beach-Norfolk-Newport News, VA-NC
- Population (ZIP)
- 75,061
- Household income
- $92,468
- Rent vs Own
- Severe rent burden
- 1929.0
Population outlook (Virginia Beach County) Hauer SSP2
- Today (2025)
- 480,401 people
- By 2030
- 491,221 · +2.3%
- By 2040
- 504,882 · +5.1%
- By 2050
- 508,847 · +5.9%
- By 2075
- 504,831 · +5.1%
- By 2100
- 465,867 · -3.0%
Race, ethnicity, and origin ACS 2023
- Neighborhood character
- Diverse neighborhood (Simpson 0.68)
- Race & ethnicity
- White 50% Black 23% Asian 10% Two or more races 9% Hispanic / Latino 9%
- Hispanic origin (detail)
- Mexican 2% Puerto Rican 3%
- Common ancestry
- Slovak 2% Lithuanian 2% Italian 2%
- Foreign-born
- 11% · Canada, Vietnam, China
- Languages at home
- 85% English-only · Tagalog/Filipino 5% Spanish 5% Other Asian/Pacific 1%
Political lean MEDSL · Virginia Beach
- 2024 margin
- Toss-up / Even · D 50.7% · R 48.0% · Other 1.3%
- 2008→2024 swing
- +3.4pp toward D · 2008: -0.7pp · 2024: 2.6pp
- All cycles
- 2024: D+2.6 2020: D+5.4 2016: R+4.5 2012: R+2.5 2008: R+0.7
Not yet ingested
- Civics
- —
Market trends
- HPI YoY
- ▼ -271.27%
- Current HPI
- 324.1854
- Rent YoY
- ▲ 6.36%
- Metro
- Virginia Beach-Norfolk-Newport News, VA-NC
- State GDP YoY
- ▲ 2.40%
- F500 in state
- 50
Industry mix (Fortune 500 HQ in VA)
| Industry | F500 HQs | Revenue |
|---|---|---|
| Aerospace / Defense | 4 | $236B |
|
||
| Technology / Defense | 3 | $32B |
|
||
| Financial Services | 2 | $176B |
|
||
| Utilities | 2 | $27B |
|
||
| Insurance | 2 | $25B |
|
||
| Technology | 2 | $15B |
|
||
Price history
+103.4% since first listed2 events — show timeline
- 2026-04-27 Listed $349,900 REINMLS
- 2004-06-24 Sold (Public Records) $172,000 Public Records
Property tax history
+2.0%/yrLatest (2018): $2,311 · +4.0% YoY. Source: county tax records.
Cash-flow waterfall
monthlySold comps — $/sqft
last 12 mo · ≤1 miLoading sold comps…