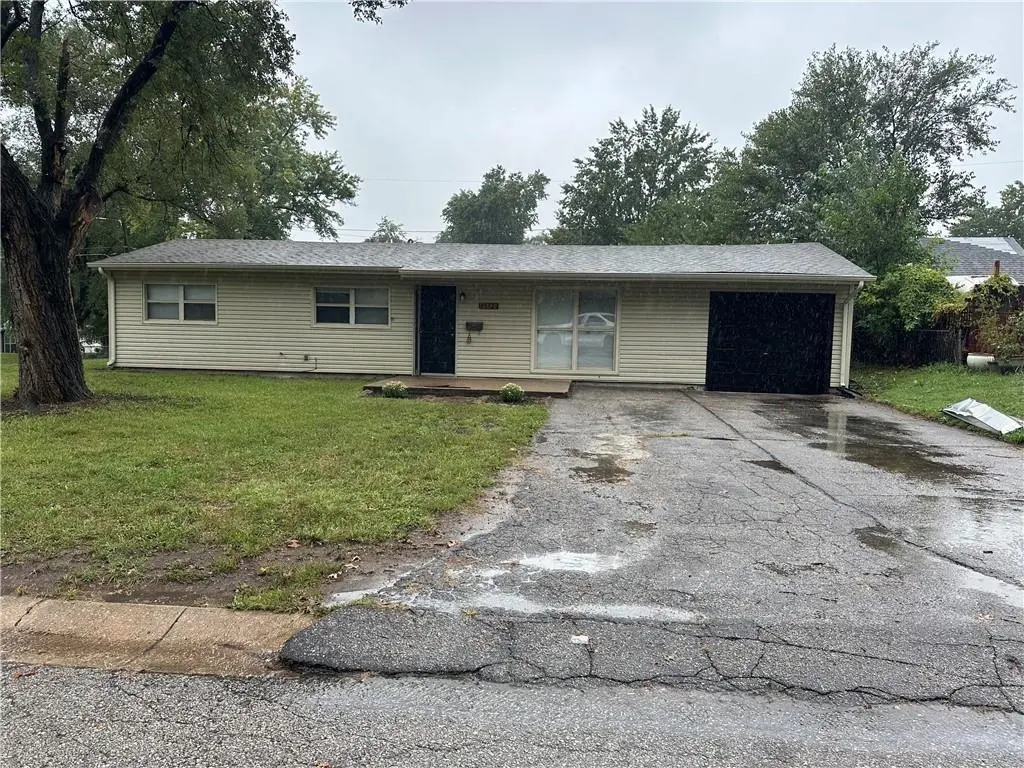
2532 S 51st Ter · Kansas City, KS
Flood risk 1/10 · Minimal
- FEMA flood zone
- X (unshaded)
- Chance of flooding over 30 yrs
- 0.0%
- Est. flood insurance / yr
- $507 – $1,088
Fire risk 1/10 · Minimal
- Est. fire insurance / yr
- $1,154 – $2,142
Heat risk 4/10 · Minor
- Hot days now (above 107°F)
- 7 days/yr
- Hot days in 30 yrs
- 16 days/yr
Wind risk 2/10 · Minimal
- Chance of severe wind over 30 yrs
- —
Air-quality risk 2/10 · Minimal
- Unhealthy air days now
- 2 days/yr
- Unhealthy air days in 30 yrs
- 2 days/yr
Risk factors via First Street. Map © Google.
Why this score? — see what drove the D+ grade
The composite is a weighted blend of 9 inputs, each scored 0–100. Each bar is that input's sub-score; the figure is the points it added to the 100-point composite (weight × sub-score).
- ARV discount +15.0/15.0
- Cash flow +14.4/30.0
- 1% rule +4.5/10.0
- DSCR +4.4/10.0
- Livability +3.6/5.0
- Rent growth +2.5/5.0
- Condition / age +2.5/5.0
- Schools +1.6/10.0
- Appreciation +0.0/10.0
$205,900
🖨 Deal sheet 📄 Offer letter ✓ Due diligence
Listing remarks
PRICE IMPROVEMENT! To $205K Sellers consider all reasonable offers. Great opportunity to own this 4 bedroom /1 bath in the Award Winning Turner School District. Corner lot with fenced yard. Many new updates. .. .flooring, granite, cabinets, garage door opener, roof and newer hot water tank. Bring your friends and family over to entertain in your bonus family room right off the kitchen next to your fenced in patio. We welcome all offers!
Key facts
- 7,405 sq ft lot
- Garage
- Built 1953
Property features AI
Finance
- HOA & community: Association fee billed annually (if applicable)
Exterior
- Parking: Attached garage (1 car)
- Utilities: Public water; Public sewer
- Home design: Single-family residence; Ranch-style; One-story
- Construction: Vinyl siding; Composition roof; Slab foundation; Home age approximately 51–75 years
- Exterior features: Yard on a 7,405 sq ft lot; Not in a flood plain
Interior
- Bedrooms: 4 bedrooms (main level for at least two bedrooms)
- Flooring: Carpet in multiple bedrooms; Ceramic tile in bathroom(s)
- Bathrooms: 1 full bathroom with ceramic tile
- Heating & cooling: Floor furnace heating; Heat pump cooling
- Interior features: Ranch floor plan
Neighborhood map
What this means for you Summary
Snapshot
- This is a 4-bed/1.0-bath single-family listed at $206k.
Deal economics
- At list price, monthly cash flow is $40 ($481/yr) — positive.
- The deal already cash-flows at list — no discount required.
- To meet the 1% rule (rent ≥ 1% of price), the offer needs to be $195k (5.4% below list).
- Recommended offer: $194k (6.0% below list) — sets the bar for market timing.
- Cap rate 6.5% vs local median 4.8% in Kansas City — top-decile yield for the area; either an underpriced asset or a hidden risk that comps aren't pricing in. Stress-test before assuming the spread holds.
Location & tenants
- Location reads 72/100 on livability (#103 in KS) — a middle-class / working-renter tenant base. Strengths: commute A+, cost of living A+, housing A+; Watch: schools F, crime F, employment D-.
- Turner-Kansas City (urban): math 15% / reading 22% proficiency, ranked #161 of 169 in KS (top 95%) — low school quality limits family demand, transient renter base, plan for 1-2y turnover; 64% free/reduced lunch — lower-income household profile, screen leases tightly.
- Market conditions: 94 active listings in the ZIP; 1 comparable units currently listed for rent nearby; 369 units permitted in Wyandotte County in 2024 (236 in 5+ unit buildings).
- This rent runs 38% of the median local income ($61k/yr) — at the standard rent-burdened threshold; future hikes will face affordability resistance.
Forward outlook
- Local home prices are declining (-3.0%/yr); year-one equity from $1k of loan paydown is wiped out by about $6k of value loss. Plan a longer hold.
- Wyandotte County population projected at +17% by 2050 — long-run rental-demand tailwind backs the buy-and-hold thesis.
Negotiation context
- It's been on market 62 days — a 6% lower offer ($194k) is reasonable based on typical stale-listing flexibility.
- 4 sale attempts; this cycle's ask has dropped $33k (14%) from the opening price — seller is motivated, your offer sets the floor, not the list.
Risks & watch-outs
- Watch-outs: built in 1953 — expect roof / HVAC / electrical / plumbing capex.
Questions for the listing agent
- It's been on market 62 days. Have you received any prior offers? Is the seller open to a 6% concession, seller financing, or rate buy-down credit?
- Built in 1953 — when were the roof, HVAC, electrical panel, plumbing, and water heater last replaced?
- Why hasn't it sold? Are there any deal-killer items the seller is aware of (foundation, flood, title, zoning, code violations)?
- Is there a deadline driving the sale (1031 exchange, divorce, estate, relocation)? That informs how much negotiation room exists.
- Schools are F-rated, which usually means shorter tenancies and higher turnover. Who's the typical renter profile here, and what's been the actual vacancy rate?
- Crime grade is F in this area — have there been break-ins, vandalism, or insurance claims at this property in the last 3 years? What carrier currently insures it and at what premium?
- The area grade is low — what's the realistic commute time and amenity access for the typical tenant pool here? Any planned neighborhood developments (good or bad) we should know about?
- What's the average days-on-market for RENTAL listings here right now (not sales)? A rising rental-DOM trend means longer vacancies and softer asking-rent achievability than the comps imply.
- What's the recent tenant-quality profile in this submarket — average credit score on applications, eviction rate, late-payment / NSF rate, and stable-employment percentage? A property-management company in the area should have these aggregated.
- How much new for-sale + rental construction is in the pipeline within 1–3 miles? Heavy new supply typically softens prices + rents 12–24 months out; constrained supply supports both.
Investment metrics
- 1% rule
- 0.95% ✗
- Cap rate
- 6.53%
- Cash-on-cash
- 0.83%
- DSCR
- 1.04
- GRM
- 8.8
CMA / ARV
- ARV (on-the-fly)
- $321,024
- Comps found
- 12
Show comp detail 12 sales within ~0.75 mi
| Address | Dist | Beds/Ba | Sqft | Sold | Price | $/sf | Match |
|---|---|---|---|---|---|---|---|
| 2640 S 53rd St | 0.28mi | 4/2.0 | 1,944 (+7%) | 11mo | $324,900 | $167 | 63 |
| 2716 S 46th St | 0.67mi | 4/3.0 | 1,874 (+3%) | 3mo | $350,000 | $187 | 54 |
| 4606 Ottawa Ave | 0.66mi | 3/2.5 (-1) | 1,740 (-5%) | 5mo | $306,000 | $176 | 47 |
| 2818 S 54 St | 0.48mi | 3/2.5 (-1) | 1,677 (-8%) | 10mo | $270,000 | $161 | 45 |
| 4881 Shawnee Dr | 0.69mi | 4/2.5 | 1,759 (-4%) | 13mo | $198,000 | $113 | 44 |
| 2138 S 48th St | 0.54mi | 3/1.5 (-1) | 1,638 (-10%) | 8mo | $190,000 | $116 | 44 |
| 5112 Douglas Ave | 0.72mi | 4/2.5 | 1,676 (-8%) | 7mo | $295,000 | $176 | 41 |
| 5421 Crest Dr | 0.61mi | 3/2.0 (-1) | 1,584 (-13%) | 0mo | $300,000 | $189 | 40 |
| 2138 S 48th Ter | 0.49mi | 3/2.0 (-1) | 1,557 (-15%) | 4mo | $260,000 | $167 | 40 |
| 2848 S 53rd Ter | 0.50mi | 3/2.0 (-1) | 1,558 (-15%) | 5mo | $280,000 | $180 | 39 |
| 5416 Locust Ln | 0.71mi | 3/1.5 (-1) | 1,682 (-8%) | 11mo | $270,000 | $161 | 38 |
| 5403 Hazen Ave | 0.71mi | 3/2.0 (-1) | 1,616 (-11%) | 2mo | $285,000 | $176 | 37 |
Match score weights: distance 35% · size 25% · config 20% · recency 20%. Top-matched comps best support the ARV.
Projected returns pro-forma
-3.0% appreciation · 3.0% rent growth · sell at horizon
- IRR
- -14.9%
- Equity multiple
- 0.47×
- Total profit
- $-30,734
- Equity at exit
- $30,700
- IRR
- -6.2%
- Equity multiple
- 0.60×
- Total profit
- $-23,164
- Equity at exit
- $17,802
Cash invested: $57,652 (down + closing). Projections, not guarantees.
Landlord ↔ Tenant lean methodology
- Overall (STATE)
- 83 Strongly Landlord-Friendly
- State Kansas
- 83 Strongly Landlord-Friendly · R+10
- County
- — inherits STATE
- City
- — inherits STATE
ZIP-level market 66106
- Active inventory
- 94
- Price-to-rent
- 8.8×
Monthly cashflow live
- Estimated rent
- $1,948 medium interval (Pro) →
- Mortgage (P&I)
- −$1,080
- Tax from tax record
- −$333 /mo · $4,002/yr
- Insurance
- −$86
- HOA
- −$0
- Vacancy / Maint / Mgmt
- −$409
- Net cashflow
- $40
Break-even live
UW: 25.0% down · 7.5% · 30yr · 1.5% tax · 5.0% vac · 8.0% maint · 8.0% mgmt
Financing live
Cash to close
- Down payment
- $51,475
- Closing costs
- $6,177
- Reserves months
- —
- Total cash needed
- —
Loan-product check · same deal, 3 products live
Conventional
25% down · 7.5% · 30yr
- Down + closing
- —
- Monthly P&I
- —
- Monthly cashflow
- —
- DSCR
- —
- Eligible?
- —
Personal DTI + credit; lowest rate.
DSCR
20% down · 8.5% · 30yr
- Down + closing
- —
- Monthly P&I
- —
- Monthly cashflow
- —
- DSCR
- —
- Eligible?
- —
No personal income docs; deal must DSCR.
Hard money
10% down · 12.0% · 12mo
- Down + closing
- —
- Monthly P&I
- —
- Monthly cashflow
- —
- DSCR
- —
- Eligible?
- —
Short-term bridge; refi at stabilization.
Rent comps 1 comps
| Address | Beds | Baths | Sqft | Rent | $/sqft | DOM | Units | Dist |
|---|---|---|---|---|---|---|---|---|
| 5012 Powell Ave Kansas City, KS | 3.0 | 2.0 | 1452 | $1,895 | $1.31 | 14d | 1 | 1.43mi |
Listing history 25 events
-
2026-06-18days on market $205,900 Active 62 DOM
-
2026-06-17days on market $205,900 Active 61 DOM
-
2026-06-16days on market $205,900 Active 60 DOM
-
2026-06-15days on market $205,900 Active 59 DOM
-
2026-06-13days on market $205,900 Active 57 DOM
-
2026-06-13days on market $205,900 Active 56 DOM
-
2026-06-09days on market $205,900 Active 53 DOM
-
2026-06-08remarks 440-char remark
-
2026-06-08pricedays on market $205,900 Active 52 DOM
-
2026-06-07days on market $214,900 Active 51 DOM
-
2026-06-03days on market $214,900 Active 47 DOM
-
2026-06-02days on market $214,900 Active 46 DOM
-
2026-06-01days on market $214,900 Active 45 DOM
-
2026-05-31days on market $214,900 Active 44 DOM
-
2026-05-15price $219,000
-
2026-05-15status Active
-
2026-05-07status Pending
-
2026-04-11$239,000 Active
-
2026-04-10historical $239,000
-
2025-11-21historical
-
2025-10-24price $219,000
-
2025-10-01price $229,000
-
2025-09-25status Active
-
2025-09-15historical
-
2025-09-10$239,000 Active
ⓘ Source: listings_history table (triggers on properties + properties_extension) + one-shot
backfill from property_details.listing_events for pre-trigger history.
Tax reassessment forecast KS · Resets to sale price
- Current annual tax
- $4,002 · $333/mo
- Projected year-2 tax
- $4,002 · $333/mo
- Expected delta
- $0/yr ($0/mo · -0.0%)
ⓘ Screening estimate from a state-policy table — verify with the county assessor before closing.
Climate risk First Street
- Flood 1/10 Low FEMA zone X (unshaded) · 0% chance over 30 yrs
- Wildfire 1/10 Low
- Heat 4/10 Moderate 7 d/yr ≥107°F today · 16 d/yr by 30 yrs out
- Wind 2/10 Low
- Air quality 2/10 Low 2 unhealthy d/yr today · 2 by 30 yrs out
Nearby sold comps map
Loading sold comps map…
Walkable amenities ~0.75 mi
Loading nearby amenities…
Taxation est. · year 1
- Rental income
- $23,379
- − Mortgage interest
- −$11,534
- − Property taxes
- −$4,002
- − Insurance
- −$1,030
- − Repairs & maintenance
- −$1,870
- − Management
- −$1,870
- − Depreciation
- −$5,990
- Taxable loss
- −$2,916
- Est. tax savings @ 24.0%
- +$700
- After-tax cash flow
- $1,181/yr
For passive investors: Depreciation is non-cash, so a rental often shows a tax loss while cash-flowing — sheltering income. Rental losses are passive: they offset passive income freely, and up to $25,000/yr can offset ordinary (W-2) income if you actively participate and your MAGI is under $100k (phasing out to $0 by $150k); unused losses carry forward. On sale, claimed depreciation is recaptured at up to 25%, and gains may owe capital-gains tax (a 1031 exchange can defer both). Figures are a year-1 estimate at your 24.0% rate — not tax advice; consult a CPA.
Schools (NCES district)
- District
- Turner-Kansas City
- NCES district ID
- 2012360
- Math proficiency
- 15% ▼ -5.00%
- Reading proficiency
- 22% ▼ -1.00%
- Median HH income
- $45,753
- Composite
- 16.24/100
- National rank
- #9222
- State rank
- #161 of 169 in KS
Livability — Kansas City
- Score
- 72/100
- State rank
- #103
- US rank
- #6054
Category grades
Schools grade is shown separately in the Schools card above.
Census & demographics
- Census place
- Kansas City, KS
- County
- Wyandotte County · 130,206 people
- City population
- 130,206
- Metro
- Kansas City, MO-KS
- Population (ZIP)
- 24,245
- Household income
- $61,331
- Rent vs Own
- Severe rent burden
- 583.0
Population outlook (Wyandotte County) Hauer SSP2
- Today (2025)
- 177,063 people
- By 2030
- 183,212 · +3.5%
- By 2040
- 195,697 · +10.5%
- By 2050
- 207,897 · +17.4%
- By 2075
- 236,169 · +33.4%
- By 2100
- 255,790 · +44.5%
Race, ethnicity, and origin ACS 2023
- Neighborhood character
- Diverse neighborhood (Simpson 0.63)
- Race & ethnicity
- White 47% Hispanic / Latino 38% Two or more races 12% Black 8% Asian 3% Native American 1%
- Hispanic origin (detail)
- Mexican 34%
- Common ancestry
- Lithuanian 2% Italian 1% Slovak 1%
- Foreign-born
- 14% · Canada
- Languages at home
- 68% English-only · Spanish 29% Other Asian/Pacific 2%
Political lean MEDSL · Wyandotte
- 2024 margin
- Strong D (+23.9) · D 61.1% · R 37.3% · Other 1.6%
- 2008→2024 swing
- -17.0pp toward R · 2008: 40.9pp · 2024: 23.9pp
- All cycles
- 2024: D+23.9 2020: D+30.9 2016: D+29.1 2012: D+36.4 2008: D+40.9
Not yet ingested
- Civics
- —
Market trends
- HPI YoY
- ▼ -253.32%
- Current HPI
- 239.6957
- Rent YoY
- —
- Metro
- Kansas City, MO-KS
- State GDP YoY
- —
- F500 in state
- 0
Price history
-8.4% since first listed11 events — show timeline
- 2026-05-15 Price Changed $219,000 Heartland MLS as Distributed by MLS Grid
- 2026-05-15 Relisted — Heartland MLS as Distributed by MLS Grid
- 2026-05-07 Pending — Heartland MLS as Distributed by MLS Grid
- 2026-04-11 Listed $239,000 Heartland MLS as Distributed by MLS Grid
- 2026-04-10 Coming Soon $239,000 Heartland MLS as Distributed by MLS Grid
- 2025-11-21 Listing Removed — Heartland MLS as Distributed by MLS Grid
- 2025-10-24 Price Changed $219,000 Heartland MLS as Distributed by MLS Grid
- 2025-10-01 Price Changed $229,000 Heartland MLS as Distributed by MLS Grid
- 2025-09-25 Relisted — Heartland MLS as Distributed by MLS Grid
- 2025-09-15 Listing Removed — Heartland MLS as Distributed by MLS Grid
- 2025-09-10 Listed $239,000 Heartland MLS as Distributed by MLS Grid
Property tax history
+6.5%/yrLatest (2025): $4,002 · +11.0% YoY. Source: county tax records.
Cash-flow waterfall
monthlySold comps — $/sqft
last 12 mo · ≤1 miLoading sold comps…