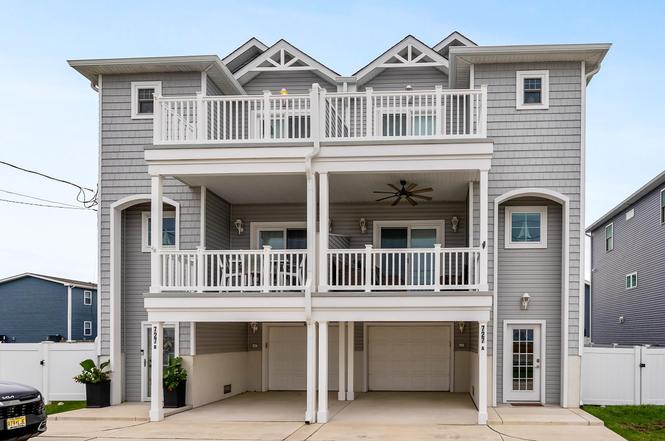
727 Spruce Ave Unit B · North Wildwood, NJ
Flood risk No data
- FEMA flood zone
- —
- Chance of flooding over 30 yrs
- —
- Est. flood insurance / yr
- —
Fire risk No data
- Est. fire insurance / yr
- —
Heat risk No data
- Hot days now (above threshold)
- —
- Hot days in 30 yrs
- —
Wind risk No data
- Chance of severe wind over 30 yrs
- —
Air-quality risk No data
- Unhealthy air days now
- —
- Unhealthy air days in 30 yrs
- —
Risk factors via First Street. Map © Google.
Why this score? — see what drove the D+ grade
The composite is a weighted blend of 9 inputs, each scored 0–100. Each bar is that input's sub-score; the figure is the points it added to the 100-point composite (weight × sub-score).
- Cash flow +18.6/30.0
- ARV discount +7.5/15.0
- DSCR +5.9/10.0
- Schools +4.4/10.0
- 1% rule +4.0/10.0
- Livability +3.4/5.0
- Rent growth +2.5/5.0
- Condition / age +2.5/5.0
- Appreciation +0.0/10.0
$1,099,000
🖨 Deal sheet 📄 Offer letter ✓ Due diligence
Listing remarks
REDUCED! Welcome home to your coastal retreat! This spacious and sunfilled 4-bedroom, 3 bath townhouse combines relaxed beach living with bayside sunsets. The open- concept layout features a custom kitchen with large island, perfect for family meals and gathering with friends. A versitile bonus room provides extra space for a playroom, home office, or possible 5th bedroom, giving you room to grow and make it your own. Step outside and enjoy unobstructed water views and breathtaking sunsets that make every evening feel special. The large patio and fully fenced yard offer the perfect spot for outdoordining or relaxing after a day at the beach, and the outdoor shower adds an extra touch of con
Key facts
- Custom kitchen
- Generous patio
- Private garage
Tags
Property features AI
Finance
- Other: Cable TV available
- HOA & community: Condo fee: split ins
Exterior
- Parking: Garage; Parking pad; Space for 2 cars; Concrete driveway; Additional parking (see remarks)
- Utilities: Public water; Public sewer; Electric hot water
- Home design: Unit B; Year-round use; Owners allowed pets; For sale
- Exterior features: Patio; Deck/porch; Fenced yard; Outside shower; Storage facilities; Water view; Corner location; Proximity to the bay: 1 block
Interior
- Kitchen: Microwave; Refrigerator; Kitchen island
- Bedrooms: 4 bedrooms
- Flooring: Hardwood floors; Wall-to-wall carpet
- Bathrooms: 3 full bathrooms
- Heating & cooling: Natural gas forced-air heating; Central air conditioning
- Interior features: Eat-in kitchen; Dining area; Laundry/utility room; Storage space; Fireplace; Kitchen center island; Cathedral ceiling; Foyer; Blinds; Smoke/Fire detector; Other features listed in remarks
- Laundry & utility: Washer; Dryer; Laundry/utility room
Neighborhood map
What this means for you Summary
Snapshot
- This is a 4-bed/3.0-bath condo listed at $1.10M.
Deal economics
- At list price, monthly cash flow is $1k ($13k/yr) — positive.
- The deal already cash-flows at list — no discount required.
- To meet the 1% rule (rent ≥ 1% of price), the offer needs to be $990k (9.9% below list).
- Recommended offer: $967k (12.0% below list) — sets the bar for market timing.
- Cap rate 7.5% vs local median 3.6% in North Wildwood — top-decile yield for the area; either an underpriced asset or a hidden risk that comps aren't pricing in. Stress-test before assuming the spread holds.
Location & tenants
- Location reads 68/100 on livability (#318 in NJ) — a middle-class / working-renter tenant base. Strengths: health & safety A+; Watch: amenities C-, crime D-, commute F.
- North Wildwood School District (suburban): math 55% / reading 45% proficiency, ranked #396 of 612 in NJ (top 65%) — acceptable for families but not a draw, mixed tenant base, ~2y average lease.
- Market conditions: 431 active listings in the ZIP; 1 comparable units currently listed for rent nearby; 877 units permitted in Cape May County in 2024 (35 in 5+ unit buildings).
Forward outlook
- Local home prices are declining (-3.0%/yr); year-one equity from $8k of loan paydown is wiped out by about $33k of value loss. Plan a longer hold.
- Cape May County population projected at -24% by 2050 — secular population decline; favor cash flow + early exit over multi-decade hold.
Negotiation context
- It's been on market 222 days — a 12% lower offer ($967k) is reasonable based on typical stale-listing flexibility.
Questions for the listing agent
- It's been on market 222 days. Have you received any prior offers? Is the seller open to a 12% concession, seller financing, or rate buy-down credit?
- Any open or pending special assessments — roof, HVAC, plumbing, elevator, façade? What's the per-unit balance and payoff schedule, and is the seller paying it off at close or rolling it to the buyer?
- Why hasn't it sold? Are there any deal-killer items the seller is aware of (foundation, flood, title, zoning, code violations)?
- Is there a deadline driving the sale (1031 exchange, divorce, estate, relocation)? That informs how much negotiation room exists.
- Crime grade is D in this area — have there been break-ins, vandalism, or insurance claims at this property in the last 3 years? What carrier currently insures it and at what premium?
- The area grade is low — what's the realistic commute time and amenity access for the typical tenant pool here? Any planned neighborhood developments (good or bad) we should know about?
- What's the average days-on-market for RENTAL listings here right now (not sales)? A rising rental-DOM trend means longer vacancies and softer asking-rent achievability than the comps imply.
- What's the recent tenant-quality profile in this submarket — average credit score on applications, eviction rate, late-payment / NSF rate, and stable-employment percentage? A property-management company in the area should have these aggregated.
- How much new apartment / multifamily construction is in the pipeline within 1–3 miles? Heavy new supply (>2% of stock underway) typically softens rents 12–24 months out; light construction supports rent growth.
Investment metrics
- 1% rule
- 0.90% ✗
- Cap rate
- 7.46%
- Cash-on-cash
- 4.18%
- DSCR
- 1.19
- GRM
- 9.3
CMA / ARV
No comps found within radius.
Projected returns pro-forma
-3.0% appreciation · 3.0% rent growth · sell at horizon
- IRR
- -9.8%
- Equity multiple
- 0.64×
- Total profit
- $-110,154
- Equity at exit
- $163,864
- IRR
- -0.4%
- Equity multiple
- 0.97×
- Total profit
- $-9,477
- Equity at exit
- $95,021
Cash invested: $307,720 (down + closing). Projections, not guarantees.
Landlord ↔ Tenant lean methodology
- Overall (STATE)
- 21 Tenant-Leaning
- State New Jersey
- 21 Tenant-Leaning · D+6
- County
- — inherits STATE
- City
- — inherits STATE
ZIP-level market 08260
- Home prices YoY
- -30.7%
- Active inventory
- 431
- Price-to-rent
- 9.3×
Monthly cashflow live
- Estimated rent
- $9,900 medium interval (Pro) →
- Mortgage (P&I)
- −$5,763
- Tax from tax record
- −$527 /mo · $6,329/yr
- Insurance
- −$458
- HOA
- −$0
- Vacancy / Maint / Mgmt
- −$2,079
- Net cashflow
- $1,072
Break-even live
UW: 25.0% down · 7.5% · 30yr · 1.5% tax · 5.0% vac · 8.0% maint · 8.0% mgmt
Financing live
Cash to close
- Down payment
- $274,750
- Closing costs
- $32,970
- Reserves months
- —
- Total cash needed
- —
Loan-product check · same deal, 3 products live
Conventional
25% down · 7.5% · 30yr
- Down + closing
- —
- Monthly P&I
- —
- Monthly cashflow
- —
- DSCR
- —
- Eligible?
- —
Personal DTI + credit; lowest rate.
DSCR
20% down · 8.5% · 30yr
- Down + closing
- —
- Monthly P&I
- —
- Monthly cashflow
- —
- DSCR
- —
- Eligible?
- —
No personal income docs; deal must DSCR.
Hard money
10% down · 12.0% · 12mo
- Down + closing
- —
- Monthly P&I
- —
- Monthly cashflow
- —
- DSCR
- —
- Eligible?
- —
Short-term bridge; refi at stabilization.
Rent comps 1 comps
| Address | Beds | Baths | Sqft | Rent | $/sqft | DOM | Units | Dist |
|---|---|---|---|---|---|---|---|---|
| 96 Seaspray Ct Wildwood, NJ | 3.0 | 2.5 | 1650 | $9,900 | $6.00 | 43d | 1 | 0.15mi |
HOA detail condo
- Monthly dues
- $0 · $0/yr
- Likely covers
- water
- Assessments
- None detected in remarks — confirm with the listing agent.
Listing history 20 events
-
2026-06-15days on market $1,099,000 Active 222 DOM
-
2026-06-13days on market $1,099,000 Active 220 DOM
-
2026-06-12days on market $1,099,000 Active 219 DOM
-
2026-06-09days on market $1,099,000 Active 216 DOM
-
2026-06-08days on market $1,099,000 Active 215 DOM
-
2026-06-07days on market $1,099,000 Active 214 DOM
-
2026-06-07days on market $1,099,000 Active 213 DOM
-
2026-06-04days on market $1,099,000 Active 210 DOM
-
2026-06-02days on market $1,099,000 Active 209 DOM
-
2026-06-01days on market $1,099,000 Active 208 DOM
-
2026-05-31pricedays on market $1,099,000 Active 207 DOM
-
2026-05-05price $1,124,999
-
2026-04-11price $1,149,999
-
2026-02-26price $1,199,999
-
2026-02-17price $1,220,000
-
2025-12-31price $1,230,000
-
2025-12-05price $1,250,000
-
2025-11-19price $1,285,000
-
2025-11-15price $1,325,000
-
2025-11-02$1,375,000 Active
ⓘ Source: listings_history table (triggers on properties + properties_extension) + one-shot
backfill from property_details.listing_events for pre-trigger history.
Tax reassessment forecast NJ · Partial reset (capped growth)
- Current annual tax
- $6,329 · $527/mo
- Projected year-2 tax
- $16,847 · $1,404/mo
- Expected delta
- +$10,518/yr (+$877/mo · 166.2%)
ⓘ Screening estimate from a state-policy table — verify with the county assessor before closing.
Nearby sold comps map
Loading sold comps map…
Walkable amenities ~0.75 mi
Loading nearby amenities…
Taxation est. · year 1
- Rental income
- $118,800
- − Mortgage interest
- −$61,561
- − Property taxes
- −$6,329
- − Insurance
- −$5,495
- − Repairs & maintenance
- −$9,504
- − Management
- −$9,504
- − Depreciation
- −$31,971
- Taxable loss
- −$5,564
- Est. tax savings @ 24.0%
- +$1,335
- After-tax cash flow
- $14,204/yr
For passive investors: Depreciation is non-cash, so a rental often shows a tax loss while cash-flowing — sheltering income. Rental losses are passive: they offset passive income freely, and up to $25,000/yr can offset ordinary (W-2) income if you actively participate and your MAGI is under $100k (phasing out to $0 by $150k); unused losses carry forward. On sale, claimed depreciation is recaptured at up to 25%, and gains may owe capital-gains tax (a 1031 exchange can defer both). Figures are a year-1 estimate at your 24.0% rate — not tax advice; consult a CPA.
Schools (NCES district)
- District
- North Wildwood School District
- NCES district ID
- 3411670
- Math proficiency
- 55% ▲ 5.00%
- Reading proficiency
- 45% ▬ 0.00%
- Median HH income
- $45,310
- Composite
- 44.38/100
- National rank
- #6123
- State rank
- #396 of 612 in NJ
Livability — North Wildwood
- Score
- 68/100
- State rank
- #318
- US rank
- #9827
Category grades
Schools grade is shown separately in the Schools card above.
Census & demographics
- Census place
- North Wildwood, NJ
- Population (ZIP)
- 12,913
Population outlook (Cape May County) Hauer SSP2
- Today (2025)
- 88,234 people
- By 2030
- 84,144 · -4.6%
- By 2040
- 75,146 · -14.8%
- By 2050
- 67,389 · -23.6%
- By 2075
- 55,732 · -36.8%
- By 2100
- 44,972 · -49.0%
Race, ethnicity, and origin ACS 2023
- Neighborhood character
- Predominantly White (78%)
- Race & ethnicity
- White 78% Hispanic / Latino 14% Two or more races 7% Black 3% Native American 1%
- Hispanic origin (detail)
- Mexican 10% Puerto Rican 3%
- Common ancestry
- Romanian 7% Slovak 2% Lithuanian 1%
- Foreign-born
- 9% · Canada
- Languages at home
- 84% English-only · Spanish 12% Other Indo-European 3% French/Haitian/Cajun 1%
Political lean MEDSL · Cape May
- 2024 margin
- R (+19.2) · D 39.7% · R 58.9% · Other 1.4%
- 2008→2024 swing
- -10.6pp toward R · 2008: -8.7pp · 2024: -19.2pp
- All cycles
- 2024: R+19.2 2020: R+15.9 2016: R+19.9 2012: R+8.9 2008: R+8.7
Not yet ingested
- Civics
- —
Market trends
- HPI YoY
- ▼ -243.83%
- Current HPI
- 551.3393
- Rent YoY
- —
- Metro
- —
- State GDP YoY
- ▲ 2.05%
- F500 in state
- 34
Industry mix (Fortune 500 HQ in NJ)
| Industry | F500 HQs | Revenue |
|---|---|---|
| Consumer Goods | 3 | $31B |
|
||
| Pharmaceuticals | 2 | $153B |
|
||
| Technology | 2 | $21B |
|
||
| Insurance | 2 | $20B |
|
||
| Healthcare | 2 | $19B |
|
||
| Financial Services | 1 | $70B |
|
||
Price history
-18.2% since first listed9 events — show timeline
- 2026-05-05 Price Changed $1,124,999 CMCMLS
- 2026-04-11 Price Changed $1,149,999 CMCMLS
- 2026-02-26 Price Changed $1,199,999 CMCMLS
- 2026-02-17 Price Changed $1,220,000 CMCMLS
- 2025-12-31 Price Changed $1,230,000 CMCMLS
- 2025-12-05 Price Changed $1,250,000 CMCMLS
- 2025-11-19 Price Changed $1,285,000 CMCMLS
- 2025-11-15 Price Changed $1,325,000 CMCMLS
- 2025-11-02 Listed $1,375,000 CMCMLS
Property tax history
+2.1%/yrLatest (2025): $6,329 · +2.1% YoY. Source: county tax records.
Cash-flow waterfall
monthlySold comps — $/sqft
last 12 mo · ≤1 miLoading sold comps…