 🏗️ New Construction
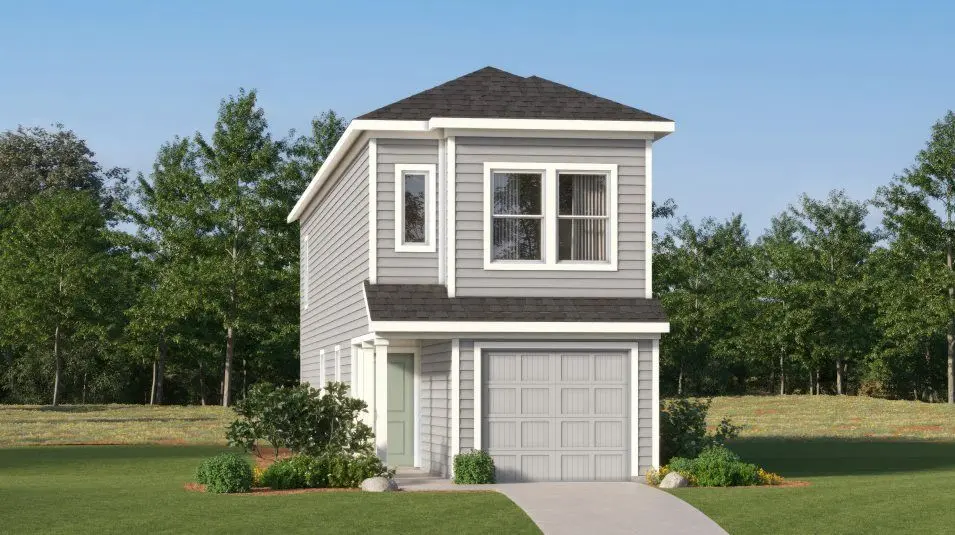
20151 Green Mallard St · Houston, TX
Flood risk No data
- FEMA flood zone
- —
- Chance of flooding over 30 yrs
- —
- Est. flood insurance / yr
- —
Fire risk No data
- Est. fire insurance / yr
- —
Heat risk No data
- Hot days now (above threshold)
- —
- Hot days in 30 yrs
- —
Wind risk No data
- Chance of severe wind over 30 yrs
- —
Air-quality risk No data
- Unhealthy air days now
- —
- Unhealthy air days in 30 yrs
- —
Risk factors via First Street. Map © Google.
Why this score? — see what drove the C+ grade
The composite is a weighted blend of 9 inputs, each scored 0–100. Each bar is that input's sub-score; the figure is the points it added to the 100-point composite (weight × sub-score).
- Cash flow +23.8/30.0
- DSCR +7.7/10.0
- ARV discount +7.5/15.0
- 1% rule +7.0/10.0
- Condition / age +4.0/5.0
- Livability +3.7/5.0
- Schools +3.5/10.0
- Rent growth +2.9/5.0
- Appreciation +0.0/10.0
$183,990
🖨 Deal sheet 📄 Offer letter ✓ Due diligence
Listing remarks
The Cibola Floor Plan - The first floor of this two-story home is host to an open floorplan that combines a fully-equipped kitchen with the living and dining areas to maximize the footprint of the home. There are four bedrooms located upstairs, including the luxe owner’s suite, which is positioned at the back of the home for enhanced privacy and comfort. The completion date, prices and features may vary and are subject to change. Please verify with Lennar directly. Photos are for illustrative purposes only.
Key facts
- Open floorplan
- Enhanced privacy
- Luxe owner suite
Tags
Property features AI
Finance
- HOA & community: Community managed by Southern Property Management Grou; HOA fee of $125 per month
Exterior
- Parking: Attached 2-car garage
- Utilities: Public water; Public sewer
- Home design: Residential property; New construction (under construction); Slab foundation
- Construction: Built in 2026; Cement siding; Composition roof
- Exterior features: Back yard fence
Interior
- Kitchen: Dishwasher; Electric oven and electric range; Gas oven and gas range
- Bedrooms: Primary bedroom on second floor (approx. 14 x 10); Three additional bedrooms on second floor (each approx. 10 x 9)
- Flooring: Carpet; Vinyl
- Bathrooms: 2 full bathrooms; 1 half bathroom
- Heating & cooling: Central heating (electric and gas); Central air conditioning (electric and gas)
- Interior features: Breakfast bar; Kitchen and family room combo; Primary bedroom with bath; Separate shower; Tub/shower combo; 7 total rooms
- Laundry & utility: Washer hookup; Electric dryer hookup; Gas dryer hookup
Neighborhood map
What this means for you Summary
Snapshot
- This is a 4-bed/2.5-bath single-family listed at $184k. Condition is rated good.
Deal economics
- At list price, monthly cash flow is $389 ($5k/yr) — positive.
- The deal already cash-flows at list — no discount required.
- Meets the 1% rule at list price ($2k rent vs $184k).
- Recommended offer: $181k (1.5% below list) — sets the bar for market timing.
- Cap rate 8.6% vs local median 3.2% in Houston — top-decile yield for the area; either an underpriced asset or a hidden risk that comps aren't pricing in. Stress-test before assuming the spread holds.
Location & tenants
- Location reads 74/100 on livability (#184 in TX, #4,771 nationally) — a middle-class / working-renter tenant base. Strengths: amenities A+, cost of living A+, housing A+; Watch: crime F.
- Crosby ISD (rural): math 39% / reading 40% proficiency, ranked #369 of 826 in TX (top 45%) — families likely to look elsewhere, expect single-tenant / working-renter base with shorter leases.
- Zoned schools: Crosby Middle (math 36% / reading 37%, grade F, #786 of 1,662 statewide, top 48%, 1,549 students, 60% FRL); Highpoint School East (Crosby) (20 students, 80% FRL) — zoned schools average 70% FRL vs 50% district-wide (20 pts higher); higher-poverty schools than district average — tighter screening recommended.
- Market conditions: Rents rising (+1.5%/yr); 1172 active listings in the ZIP; 2 comparable units currently listed for rent nearby; solid renter incomes; 29,883 units permitted in Harris County in 2024 (8,621 in 5+ unit buildings).
- This rent runs 31% of the median local income ($92k/yr) — at the standard rent-burdened threshold; future hikes will face affordability resistance.
Forward outlook
- Local home prices are declining (-3.0%/yr); year-one equity from $1k of loan paydown is wiped out by about $6k of value loss. Plan a longer hold.
- Harris County population projected at +47% by 2050 — long-run rental-demand tailwind backs the buy-and-hold thesis.
Negotiation context
- It's been on market 28 days — a 2% lower offer ($181k) is reasonable based on typical stale-listing flexibility.
Questions for the listing agent
- What does the HOA fee cover, when was the last increase, and are there any pending special assessments or reserve-fund shortfalls?
- Is there a deadline driving the sale (1031 exchange, divorce, estate, relocation)? That informs how much negotiation room exists.
- Schools are D-rated, which usually means shorter tenancies and higher turnover. Who's the typical renter profile here, and what's been the actual vacancy rate?
- Crime grade is F in this area — have there been break-ins, vandalism, or insurance claims at this property in the last 3 years? What carrier currently insures it and at what premium?
- What's the average days-on-market for RENTAL listings here right now (not sales)? A rising rental-DOM trend means longer vacancies and softer asking-rent achievability than the comps imply.
- What's the recent tenant-quality profile in this submarket — average credit score on applications, eviction rate, late-payment / NSF rate, and stable-employment percentage? A property-management company in the area should have these aggregated.
- How much new for-sale + rental construction is in the pipeline within 1–3 miles? Heavy new supply typically softens prices + rents 12–24 months out; constrained supply supports both.
Investment metrics
- 1% rule
- 1.20% ✓
- Cap rate
- 8.60%
- Cash-on-cash
- 8.26%
- DSCR
- 1.37
- GRM
- 7.0
CMA / ARV
- ARV (median comp)
- $201,990
- List price
- $183,990
- Delta
- -8.91%
- Verdict
- FAIR
- Comps
- 20 within 1.0 mi
Show comp detail 12 sales within ~0.75 mi
| Address | Dist | Beds/Ba | Sqft | Sold | Price | $/sf | Match |
|---|---|---|---|---|---|---|---|
| 20158 Green Mallard St | 0.02mi | 4/2.5 | 1,535 (0%) | 1mo | $211,990 | $138 | 98 |
| 20066 White Dove Trl | 0.08mi | 4/2.0 | 1,607 (+5%) | 1mo | $199,990 | $124 | 86 |
| 20035 White Dove Trl | 0.14mi | 4/2.0 | 1,607 (+5%) | 1mo | $265,990 | $166 | 83 |
| 20023 White Dove Trl | 0.16mi | 4/2.0 | 1,607 (+5%) | 1mo | $268,990 | $167 | 82 |
| 1714 Serenity Moon Dr | 0.36mi | 3/2.0 (-1) | 1,539 (+0%) | 1mo | $244,990 | $159 | 75 |
| 20127 Green Mallard St | 0.03mi | 3/2.5 (-1) | 1,360 (-11%) | 0mo | $181,990 | $134 | 74 |
| 20159 Green Mallard St | 0.01mi | 3/2.5 (-1) | 1,360 (-11%) | 1mo | $201,990 | $149 | 74 |
| 20166 Green Mallard St | 0.02mi | 3/2.5 (-1) | 1,360 (-11%) | 1mo | $201,990 | $149 | 74 |
| 20031 White Dove Trl | 0.15mi | 3/2.0 (-1) | 1,418 (-8%) | 1mo | $254,990 | $180 | 73 |
| 20022 White Dove Trl | 0.16mi | 3/2.0 (-1) | 1,409 (-8%) | 1mo | $250,990 | $178 | 71 |
| 1738 West Stroker Rd | 0.30mi | 3/2.0 (-1) | 1,451 (-6%) | 1mo | $224,990 | $155 | 69 |
| 20011 White Dove Trl | 0.24mi | 3/2.0 (-1) | 1,409 (-8%) | 1mo | $252,990 | $180 | 67 |
Match score weights: distance 35% · size 25% · config 20% · recency 20%. Top-matched comps best support the ARV.
Projected returns pro-forma
-3.0% appreciation · 1.48% rent growth · sell at horizon
- IRR
- -5.5%
- Equity multiple
- 0.80×
- Total profit
- $-11,478
- Equity at exit
- $30,117
- IRR
- 2.1%
- Equity multiple
- 1.14×
- Total profit
- $7,880
- Equity at exit
- $17,464
Cash invested: $56,557 (down + closing). Projections, not guarantees.
Landlord ↔ Tenant lean methodology
- Overall (STATE)
- 87 Strongly Landlord-Friendly
- State Texas
- 87 Strongly Landlord-Friendly · R+5
- County
- — inherits STATE
- City
- — inherits STATE
ZIP-level market 77532
- Home prices YoY
- -28.6%
- Rents YoY
- 1.5%
- Active inventory
- 1172
- Price-to-rent
- 6.3×
Monthly cashflow live
- Estimated rent
- $2,418 medium interval (Pro) →
- Mortgage (P&I)
- −$1,059
- Tax est. 1.5%
- −$252 /mo · $3,030/yr
- Insurance
- −$84
- HOA
- −$125
- Vacancy / Maint / Mgmt
- −$508
- Net cashflow
- $389
Break-even live
UW: 25.0% down · 7.5% · 30yr · 1.5% tax · 5.0% vac · 8.0% maint · 8.0% mgmt
Financing live
Cash to close
- Down payment
- $50,498
- Closing costs
- $6,060
- Reserves months
- —
- Total cash needed
- —
Loan-product check · same deal, 3 products live
Conventional
25% down · 7.5% · 30yr
- Down + closing
- —
- Monthly P&I
- —
- Monthly cashflow
- —
- DSCR
- —
- Eligible?
- —
Personal DTI + credit; lowest rate.
DSCR
20% down · 8.5% · 30yr
- Down + closing
- —
- Monthly P&I
- —
- Monthly cashflow
- —
- DSCR
- —
- Eligible?
- —
No personal income docs; deal must DSCR.
Hard money
10% down · 12.0% · 12mo
- Down + closing
- —
- Monthly P&I
- —
- Monthly cashflow
- —
- DSCR
- —
- Eligible?
- —
Short-term bridge; refi at stabilization.
Rent comps 2 comps
| Address | Beds | Baths | Sqft | Rent | $/sqft | DOM | Units | Dist |
|---|---|---|---|---|---|---|---|---|
| 20034 White Dove Dr Crosby, TX | 3.0 | 2.0 | 1273 | $1,850 | $1.45 | 12d | 1 | 0.16mi |
| 20119 Iron Winds St Crosby, TX | 3.0 | 2.0 | 1418 | $1,875 | $1.32 | 12d | 1 | 0.17mi |
HOA detail
- Monthly dues
- $125 · $1,500/yr
Listing history 8 events
-
2026-06-07status $183,990 Pending 28 DOM
-
2026-06-04days on market $183,990 Active 28 DOM
-
2026-06-03days on market $183,990 Active 27 DOM
-
2026-06-02days on market $183,990 Active 26 DOM
-
2026-06-01days on market $183,990 Active 25 DOM
-
2026-05-31days on market $183,990 Active 24 DOM
-
2026-05-08$183,990 Active 332-char remark
-
2026-05-07$183,990 Active 518-char remark
ⓘ Source: listings_history table (triggers on properties + properties_extension) + one-shot
backfill from property_details.listing_events for pre-trigger history.
Nearby sold comps map
Loading sold comps map…
Walkable amenities ~0.75 mi
Loading nearby amenities…
Taxation est. · year 1
- Rental income
- $29,013
- − Mortgage interest
- −$11,315
- − Property taxes
- −$3,030
- − Insurance
- −$1,010
- − Repairs & maintenance
- −$2,321
- − Management
- −$2,321
- − HOA
- −$1,500
- − Depreciation
- −$5,876
- Taxable income
- $1,640
- Est. tax owed @ 24.0%
- −$394
- After-tax cash flow
- $4,276/yr
For passive investors: Depreciation is non-cash, so a rental often shows a tax loss while cash-flowing — sheltering income. Rental losses are passive: they offset passive income freely, and up to $25,000/yr can offset ordinary (W-2) income if you actively participate and your MAGI is under $100k (phasing out to $0 by $150k); unused losses carry forward. On sale, claimed depreciation is recaptured at up to 25%, and gains may owe capital-gains tax (a 1031 exchange can defer both). Figures are a year-1 estimate at your 24.0% rate — not tax advice; consult a CPA.
Condition & rehab AI · 22 photos
This home is in good condition with a good condition score of 80. It has a cosmetic rehab level and is move-in ready. The highest-ROI updates that would raise its resale or rental value include painting the exterior and interior walls, updating the flooring, upgrading the kitchen appliances, and adding smart home features.
Value-add opportunities
- Both Painting the exterior and interior walls — Fresh paint can enhance curb appeal and interior aesthetics
- Both Updating the flooring — New flooring can improve the overall look and feel of the home
- Both Upgrading the kitchen appliances — Modern appliances can increase the home's appeal and functionality
- Both Adding smart home features — Smart home features can increase the home's value and appeal to tech-savvy buyers
Renovation cost estimate screening
Value-add ROI direction
- Both Painting the exterior and interior walls — Fresh paint can enhance curb appeal and interior aesthetics ↑
- Both Updating the flooring — New flooring can improve the overall look and feel of the home ↑
- Both Upgrading the kitchen appliances — Modern appliances can increase the home's appeal and functionality ↑
- Both Adding smart home features — Smart home features can increase the home's value and appeal to tech-savvy buyers ↑
ⓘ Cost ranges are severity-bucket heuristics (US national rule-of-thumb). Get contractor quotes + a written scope before underwriting a rehab budget.
Schools (NCES district)
- District
- Crosby ISD
- NCES district ID
- 4815750
- Math proficiency
- 39% ▼ -13.00%
- Reading proficiency
- 40% ▼ -5.00%
- Median HH income
- $61,079
- Composite
- 35.14/100
- National rank
- #5012
- State rank
- #369 of 826 in TX
Livability — Houston
- Score
- 74/100
- State rank
- #184
- US rank
- #4771
Category grades
Schools grade is shown separately in the Schools card above.
Census & demographics
- County
- Harris County · 4,702,590 people
- City population
- 3,226,434
- Metro
- Houston-The Woodlands-Sugar Land, TX
- Population (ZIP)
- 33,780
- Household income
- $92,201
- Rent vs Own
- Severe rent burden
- 382.0
Population outlook (Harris County) Hauer SSP2
- Today (2025)
- 5,571,493 people
- By 2030
- 6,089,821 · +9.3%
- By 2040
- 7,142,806 · +28.2%
- By 2050
- 8,185,864 · +46.9%
- By 2075
- 10,574,329 · +89.8%
- By 2100
- 12,109,958 · +117.4%
Race, ethnicity, and origin ACS 2023
- Neighborhood character
- Diverse neighborhood (Simpson 0.60)
- Race & ethnicity
- White 54% Hispanic / Latino 31% Two or more races 16% Black 9%
- Hispanic origin (detail)
- Mexican 24%
- Common ancestry
- Lithuanian 4% Romanian 3% Italian 2%
- Foreign-born
- 10% · Canada
- Languages at home
- 78% English-only · Spanish 21%
Political lean MEDSL · Harris
- 2024 margin
- Lean D (+5.5) · D 52.0% · R 46.4% · Other 1.6%
- 2008→2024 swing
- +3.9pp toward D · 2008: 1.6pp · 2024: 5.5pp
- All cycles
- 2024: D+5.5 2020: D+13.3 2016: D+12.4 2012: D+0.1 2008: D+1.6
Not yet ingested
- Civics
- —
Market trends
- HPI YoY
- ▼ -105.63%
- Current HPI
- 264.0126
- Rent YoY
- ▲ 1.48%
- Metro
- Houston-The Woodlands-Sugar Land, TX
- State GDP YoY
- ▲ 3.95%
- F500 in state
- 110
Industry mix (Fortune 500 HQ in TX)
| Industry | F500 HQs | Revenue |
|---|---|---|
| Energy | 16 | $1,198B |
|
||
| Technology | 5 | $198B |
|
||
| Engineering / Construction | 4 | $72B |
|
||
| Energy Services | 3 | $60B |
|
||
| Utilities | 3 | $41B |
|
||
| Healthcare | 2 | $330B |
|
||
Price history
2 events — show timeline
- 2026-06-04 Pending — HARMLS
- 2026-05-07 Listed $183,990 HARMLS
Cash-flow waterfall
monthlySold comps — $/sqft
last 12 mo · ≤1 miLoading sold comps…