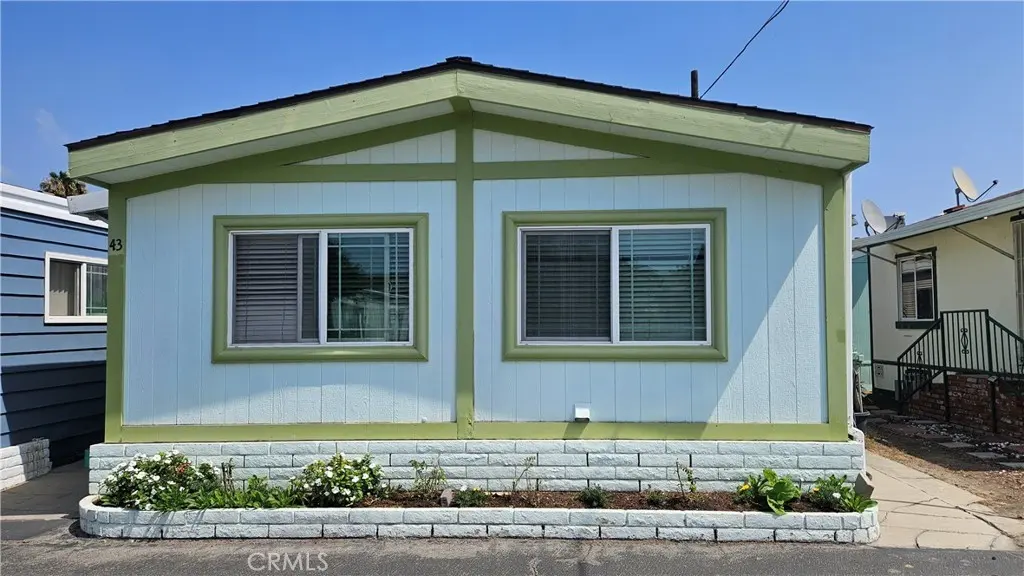
15141 Beach Blvd #43 · Midway City, CA
Flood risk 1/10 · Minimal
- FEMA flood zone
- X (shaded)
- Chance of flooding over 30 yrs
- 0.0%
- Est. flood insurance / yr
- $507 – $1,088
Fire risk 1/10 · Minimal
- Est. fire insurance / yr
- $659 – $1,223
Heat risk 5/10 · Moderate
- Hot days now (above 87°F)
- 7 days/yr
- Hot days in 30 yrs
- 23 days/yr
Wind risk 1/10 · Minimal
- Chance of severe wind over 30 yrs
- —
Air-quality risk 4/10 · Minor
- Unhealthy air days now
- 5 days/yr
- Unhealthy air days in 30 yrs
- 7 days/yr
Risk factors via First Street. Map © Google.
Why this score? — see what drove the A- grade
The composite is a weighted blend of 9 inputs, each scored 0–100. Each bar is that input's sub-score; the figure is the points it added to the 100-point composite (weight × sub-score).
- Cash flow +30.0/30.0
- 1% rule +10.0/10.0
- DSCR +10.0/10.0
- Appreciation +10.0/10.0
- ARV discount +7.6/15.0
- Schools +6.5/10.0
- Livability +3.0/5.0
- Rent growth +2.5/5.0
- Condition / age +2.5/5.0
$90,000
🖨 Deal sheet 📄 Offer letter ✓ Due diligence
Listing remarks
* 2 Bedrooms/ 1 Bathrooms * Approximately 640 sqft. * Spacious living room w/ high ceiling * Granite kitchen countertops & newer cabinets & SS appliances * Central heating * Laminate flooring throughout * New exterior paint * Double pane windows * Washer, dryer, & refrigerator included
Key facts
- Parking
- Built 1978
- Listed 26 days
Property features AI
Finance
- Other: Access via paved city streets; Subdivision listed as Other (Le Chateau Estates)
- Financial info: Land lease applies ($2,100 monthly)
- HOA & community: Located in Le Chateau Estates mobile home park; Community features include street lighting; Park may require manager approval; Pets allowed with restrictions (call; breed restrictions)
Exterior
- Parking: Assigned paved parking; One uncovered parking space
- Security: Carbon monoxide detector(s); Smoke detector
- Utilities: Public/district water; Public sewer; Electricity available and connected; Natural gas available and connected; Water, sewer, and electricity connected
- Home design: Mobile home remains on site (20' x 32'); Single-story; Turnkey, updated/remodeled condition; Entry located at side door; Entry level: 1
- Construction: Masonite and brick veneer exterior; Pillar/post/pier foundation with pier jacks; Year built per public records
- Exterior features: Shingle roof; Rain gutters; One shed on property; No fencing; Skirt finished with brick and masonite; Lot is level/flat
Interior
- Kitchen: Remodeled kitchen with granite counters; Gas range and gas oven; Range/stove hood; Refrigerator; Garbage disposal; Gas water heater
- Bedrooms: Primary suite (on main level)
- Flooring: Laminated flooring
- Bathrooms: Remodeled bathroom with bathtub and shower-in-tub; Quartz counters
- Heating & cooling: Central cooling; Central furnace heating (natural gas)
- Interior features: Recessed lighting; Cathedral/vaulted ceilings; Sliding glass doors; Panel doors; Granite counters; Double-pane windows with blinds; Carbon monoxide and smoke detectors; Exhaust fan(s)
- Laundry & utility: Inside laundry; Washer included; Dryer included
Neighborhood map
What this means for you Summary
Snapshot
- This is a 2-bed/1.0-bath manufactured listed at $90k.
Deal economics
- At list price, monthly cash flow is $1k ($17k/yr) — positive.
- The deal already cash-flows at list — no discount required.
- Meets the 1% rule at list price ($3k rent vs $90k).
- Recommended offer: $89k (1.5% below list) — sets the bar for market timing.
Location & tenants
- Location reads 59/100 on livability (#624 in CA) — a working-class tenant base; expect higher turnover. Strengths: commute A+; Watch: crime D+, amenities D, employment F.
- Huntington Beach Union High (suburban): math 65% / reading 82% proficiency, ranked #39 of 517 in CA (top 8%) — strong family-tenant draw, lease renewals of 3-5y typical.
- Market conditions: 15 active listings in the ZIP; 22 comparable units currently listed for rent nearby; rentals leasing fast (median 1d on market — plan ~1-2 weeks tenant-placement turnaround); 6,974 units permitted in Orange County in 2024 (3,839 in 5+ unit buildings).
Forward outlook
- In year one you build about $10k of equity ($622 loan paydown + $9k appreciation (10.0% local appreciation)).
- Orange County population projected at +14% by 2050 — modest demand growth; plan on rents tracking national, not racing it.
- At projected returns (10.0% appreciation + 3.0% rent growth), your $25k cash investment doubles in ~1 year — after that, you're playing with house money.
- By year 4, paydown + projected appreciation supports a ~$34k cash-out refi (75% LTV) — recoverable capital for the next deal without selling this one.
Negotiation context
- It's been on market 26 days — a 2% lower offer ($89k) is reasonable based on typical stale-listing flexibility.
Risks & watch-outs
- Climate carrying-cost: extreme-heat days projected 7→23/yr by 2055 (HVAC capex compounding) — expect insurance premiums to compound above CPI over the hold.
Questions for the listing agent
- Built in 1978 — when were the roof, HVAC, electrical panel, plumbing, and water heater last replaced?
- Is there a deadline driving the sale (1031 exchange, divorce, estate, relocation)? That informs how much negotiation room exists.
- Crime grade is D in this area — have there been break-ins, vandalism, or insurance claims at this property in the last 3 years? What carrier currently insures it and at what premium?
- What's the average days-on-market for RENTAL listings here right now (not sales)? A rising rental-DOM trend means longer vacancies and softer asking-rent achievability than the comps imply.
- What's the recent tenant-quality profile in this submarket — average credit score on applications, eviction rate, late-payment / NSF rate, and stable-employment percentage? A property-management company in the area should have these aggregated.
- How much new for-sale + rental construction is in the pipeline within 1–3 miles? Heavy new supply typically softens prices + rents 12–24 months out; constrained supply supports both.
Investment metrics
- 1% rule
- 2.82% ✓
- Cap rate
- 24.70%
- Cash-on-cash
- 65.75%
- DSCR
- 3.93
- GRM
- 3.0
CMA / ARV
- ARV (on-the-fly)
- $90,240
- Comps found
- 2
Show comp detail 2 sales within ~0.75 mi
| Address | Dist | Beds/Ba | Sqft | Sold | Price | $/sf | Match |
|---|---|---|---|---|---|---|---|
| 15141 Beach Blvd Spc 28 | 0.00mi | 2/1.0 | 640 (0%) | 13mo | $90,000 | $141 | 89 |
| 15141 Beach Blvd, Space 40 | 0.00mi | 2/1.0 | 640 (0%) | 16mo | $72,000 | $113 | 86 |
Match score weights: distance 35% · size 25% · config 20% · recency 20%. Top-matched comps best support the ARV.
Projected returns pro-forma
10.0% appreciation · 3.0% rent growth · sell at horizon
- IRR
- 77.2%
- Equity multiple
- 6.44×
- Total profit
- $136,991
- Equity at exit
- $81,079
- IRR
- 71.3%
- Equity multiple
- 14.27×
- Total profit
- $334,339
- Equity at exit
- $174,850
Cash invested: $25,200 (down + closing). Projections, not guarantees.
Landlord ↔ Tenant lean methodology
- Overall (STATE)
- 18 Strongly Tenant-Friendly
- State California
- 18 Strongly Tenant-Friendly · D+13
- County
- — inherits STATE
- City
- — inherits STATE
ZIP-level market 92655
- Home prices YoY
- 11.1%
- Active inventory
- 15
- Price-to-rent
- 3.0×
Monthly cashflow live
- Estimated rent
- $2,535 high interval (Pro) →
- Mortgage (P&I)
- −$472
- Tax est. 1.5%
- −$112 /mo · $1,350/yr
- Insurance
- −$38
- HOA
- −$0
- Vacancy / Maint / Mgmt
- −$532
- Net cashflow
- $1,381
Break-even live
UW: 25.0% down · 7.5% · 30yr · 1.5% tax · 5.0% vac · 8.0% maint · 8.0% mgmt
Financing live
Cash to close
- Down payment
- $22,500
- Closing costs
- $2,700
- Reserves months
- —
- Total cash needed
- —
Loan-product check · same deal, 3 products live
Conventional
25% down · 7.5% · 30yr
- Down + closing
- —
- Monthly P&I
- —
- Monthly cashflow
- —
- DSCR
- —
- Eligible?
- —
Personal DTI + credit; lowest rate.
DSCR
20% down · 8.5% · 30yr
- Down + closing
- —
- Monthly P&I
- —
- Monthly cashflow
- —
- DSCR
- —
- Eligible?
- —
No personal income docs; deal must DSCR.
Hard money
10% down · 12.0% · 12mo
- Down + closing
- —
- Monthly P&I
- —
- Monthly cashflow
- —
- DSCR
- —
- Eligible?
- —
Short-term bridge; refi at stabilization.
Rent comps 22 comps
| Address | Beds | Baths | Sqft | Rent | $/sqft | DOM | Units | Dist |
|---|---|---|---|---|---|---|---|---|
| 7780 Bolsa Ave Midway City, CA | 1.0 | 1.0 | 576 | $2,450 | $4.25 | 1d | 1 | 0.21mi |
| 15421 Van Buren St Midway City, CA | 1.0 | 1.0 | 600 | $2,300 | $3.83 | 1d | 3 | 0.35mi |
| 15421 Van Buren St Midway City, CA | 1.0 | 1.0 | 600 | $2,300 | $3.83 | 16d | 1 | 0.35mi |
| 7400 Center Ave Huntington Beach, CA | 2.0 | 1.0–2.0 | 990 | $4,119 | $4.16 | 1d | 1 | 0.79mi |
| 7521 Edinger Ave Huntington Beach, CA | 3.0 | 1.0–2.0 | 1035 | $3,703 | $3.58 | 1d | 23 | 0.82mi |
| 8131 San Angelo Dr Huntington Beach, CA | 1.0 | 1.0 | 725 | $2,150 | $2.97 | 1d | 1 | 0.89mi |
| 7461 Edinger Ave Huntington Beach, CA | 2.0 | 1.0–2.0 | 1031 | $4,325 | $4.19 | 1d | 26 | 0.90mi |
| 16162 Sher Ln Huntington Beach, CA | 1.0–3.0 | 1.0–1.5 | 1090 | $2,522 | $2.31 | 1d | 9 | 0.99mi |
| 8400 Edinger Ave Huntington Beach, CA | 2.0 | 1.0–2.0 | 778 | $3,007 | $3.87 | 1d | 13 | 1.05mi |
| 8142 La Paz Dr Unit 8 Huntington Beach, CA | 1.0 | 1.0 | 725 | $1,950 | $2.69 | 19d | 1 | 1.06mi |
| 8142 La Paz Dr Unit 7 Huntington Beach, CA | 1.0 | 1.0 | 725 | $1,950 | $2.69 | 10d | 1 | 1.06mi |
| 8211 San Angelo Dr Huntington Beach, CA | 1.0 | 1.0 | 612 | $2,455 | $4.01 | 1d | 5 | 1.06mi |
| 7290 Edinger Ave Huntington Beach, CA | 1.0–2.0 | 1.0–2.0 | 941 | $3,824 | $4.06 | 1d | 19 | 1.09mi |
| 15200 Magnolia St Westminster, CA | 1.0–2.0 | 1.0 | 762 | $2,675 | $3.51 | 2d | 2 | 1.15mi |
| 7661 Baylor Dr Westminster, CA | 1.0–2.0 | 1.0 | 787 | $2,400 | $3.05 | 1d | 2 | 1.15mi |
| 15611 Highcliff St Westminster, CA | 1.0 | 1.0 | 550 | $1,995 | $3.63 | 43d | 1 | 1.18mi |
| 7012 Main St Westminster, CA | 1.0–2.0 | 1.0 | 812 | $2,395 | $2.95 | 11d | 5 | 1.26mi |
| 8402 Westminster Blvd Westminster, CA | 1.0 | 1.0 | 625 | $1,695 | $2.71 | 1d | 1 | 1.27mi |
| 7012 Main St Unit 7042-04 Westminster, CA | 1.0 | 1.0 | 725 | $1,995 | $2.75 | 1d | 1 | 1.27mi |
| 7012 Main St Unit 7032-02 Westminster, CA | 1.0 | 1.0 | 725 | $1,995 | $2.75 | 7d | 1 | 1.27mi |
| 13920 Hoover St Westminster, CA | 2.0 | 1.0–2.0 | 645 | $3,031 | $4.70 | 1d | 11 | 1.30mi |
| 8631 Westminster Ave Garden Grove, CA | 1.0–2.0 | 1.0 | 660 | $2,489 | $3.77 | 1d | 9 | 1.41mi |
Listing history 16 events
-
2026-06-18days on market $90,000 Active 26 DOM
-
2026-06-17days on market $90,000 Active 25 DOM
-
2026-06-16days on market $90,000 Active 24 DOM
-
2026-06-15days on market $90,000 Active 23 DOM
-
2026-06-13days on market $90,000 Active 21 DOM
-
2026-06-13days on market $90,000 Active 20 DOM
-
2026-06-09days on market $90,000 Active 17 DOM
-
2026-06-08days on market $90,000 Active 16 DOM
-
2026-06-07days on market $90,000 Active 15 DOM
-
2026-06-04days on market $90,000 Active 12 DOM
-
2026-06-03days on market $90,000 Active 11 DOM
-
2026-06-02days on market $90,000 Active 10 DOM
-
2026-06-01days on market $90,000 Active 9 DOM
-
2026-05-31days on market $90,000 Active 8 DOM
-
2026-05-23$90,000 Active
-
2026-05-19historical $90,000
ⓘ Source: listings_history table (triggers on properties + properties_extension) + one-shot
backfill from property_details.listing_events for pre-trigger history.
Climate risk First Street
- Flood 1/10 Low FEMA zone X (shaded) · 0% chance over 30 yrs
- Wildfire 1/10 Low
- Heat 5/10 Major 7 d/yr ≥87°F today · 23 d/yr by 30 yrs out
- Wind 1/10 Low
- Air quality 4/10 Moderate 5 unhealthy d/yr today · 7 by 30 yrs out
Nearby sold comps map
Loading sold comps map…
Walkable amenities ~0.75 mi
Loading nearby amenities…
Taxation est. · year 1
- Rental income
- $30,420
- − Mortgage interest
- −$5,041
- − Property taxes
- −$1,350
- − Insurance
- −$450
- − Repairs & maintenance
- −$2,434
- − Management
- −$2,434
- − Depreciation
- −$2,618
- Taxable income
- $16,093
- Est. tax owed @ 24.0%
- −$3,862
- After-tax cash flow
- $12,706/yr
For passive investors: Depreciation is non-cash, so a rental often shows a tax loss while cash-flowing — sheltering income. Rental losses are passive: they offset passive income freely, and up to $25,000/yr can offset ordinary (W-2) income if you actively participate and your MAGI is under $100k (phasing out to $0 by $150k); unused losses carry forward. On sale, claimed depreciation is recaptured at up to 25%, and gains may owe capital-gains tax (a 1031 exchange can defer both). Figures are a year-1 estimate at your 24.0% rate — not tax advice; consult a CPA.
Schools (NCES district)
- District
- Huntington Beach Union High
- NCES district ID
- 0618060
- Math proficiency
- 65% ▲ 17.00%
- Reading proficiency
- 82% ▲ 8.00%
- Median HH income
- $78,159
- Composite
- 64.9/100
- National rank
- #511
- State rank
- #39 of 517 in CA
Livability — Midway City
- Score
- 59/100
- State rank
- #624
- US rank
- #19816
Category grades
Schools grade is shown separately in the Schools card above.
Census & demographics
- Census place
- Midway City, CA
- City population
- 8,101
- Population (ZIP)
- 8,101
Population outlook (Orange County) Hauer SSP2
- Today (2025)
- 3,477,456 people
- By 2030
- 3,613,117 · +3.9%
- By 2040
- 3,835,945 · +10.3%
- By 2050
- 3,968,736 · +14.1%
- By 2075
- 4,097,053 · +17.8%
- By 2100
- 3,903,633 · +12.3%
Race, ethnicity, and origin ACS 2023
- Neighborhood character
- Diverse neighborhood (Simpson 0.66)
- Race & ethnicity
- Asian 44% Hispanic / Latino 35% White 16% Two or more races 9% Native American 2%
- Hispanic origin (detail)
- Mexican 35%
- Common ancestry
- Lithuanian 1% Iranian 1%
- Foreign-born
- 49% · Vietnam, Canada, China
- Languages at home
- 28% English-only · Vietnamese 39% Spanish 26% Chinese 2%
Political lean MEDSL · Orange
- 2024 margin
- Toss-up / Even · D 49.7% · R 47.1% · Other 3.2%
- 2008→2024 swing
- +5.2pp toward D · 2008: -2.6pp · 2024: 2.6pp
- All cycles
- 2024: D+2.6 2020: D+9.0 2016: D+7.7 2012: R+8.3 2008: R+2.6
Not yet ingested
- Civics
- —
Market trends
- HPI YoY
- ▲ 97.88%
- Current HPI
- 980.41
- Rent YoY
- —
- Metro
- —
- State GDP YoY
- ▲ 3.21%
- F500 in state
- 116
Industry mix (Fortune 500 HQ in CA)
| Industry | F500 HQs | Revenue |
|---|---|---|
| Technology | 27 | $1,492B |
|
||
| Financial Services | 3 | $174B |
|
||
| Retail | 3 | $44B |
|
||
| Insurance | 3 | $26B |
|
||
| Media / Entertainment | 2 | $115B |
|
||
| Pharmaceuticals / Biotech | 2 | $62B |
|
||
Price history
+0.0% since first listed2 events — show timeline
- 2026-05-23 Listed $90,000 CRMLS
- 2026-05-19 Coming Soon $90,000 CRMLS
Cash-flow waterfall
monthlySold comps — $/sqft
last 12 mo · ≤1 miLoading sold comps…