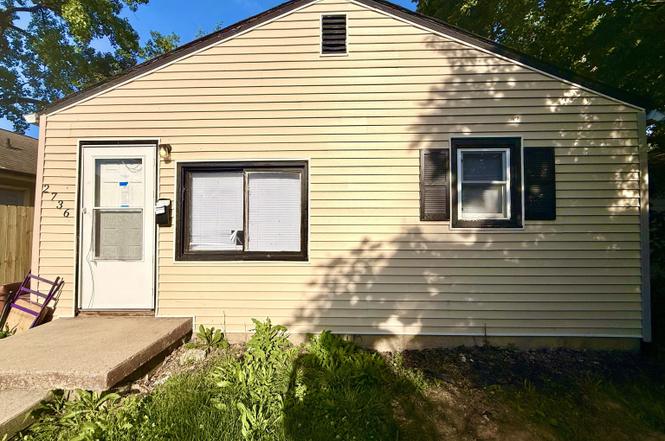
2736 N Dearborn St · Indianapolis city (balance), IN
Flood risk 1/10 · Minimal
- FEMA flood zone
- X (unshaded)
- Chance of flooding over 30 yrs
- 0.0%
- Est. flood insurance / yr
- $507 – $1,088
Fire risk 1/10 · Minimal
- Est. fire insurance / yr
- $717 – $1,331
Heat risk 3/10 · Minor
- Hot days now (above 102°F)
- 7 days/yr
- Hot days in 30 yrs
- 18 days/yr
Wind risk 2/10 · Minimal
- Chance of severe wind over 30 yrs
- 0.0%
Air-quality risk 4/10 · Minor
- Unhealthy air days now
- 5 days/yr
- Unhealthy air days in 30 yrs
- 7 days/yr
Risk factors via First Street. Map © Google.
Why this score? — see what drove the C- grade
The composite is a weighted blend of 9 inputs, each scored 0–100. Each bar is that input's sub-score; the figure is the points it added to the 100-point composite (weight × sub-score).
- Cash flow +19.3/30.0
- ARV discount +8.6/15.0
- 1% rule +7.9/10.0
- DSCR +6.1/10.0
- Rent growth +2.7/5.0
- Livability +2.5/5.0
- Condition / age +2.5/5.0
- Schools +1.4/10.0
- Appreciation +0.0/10.0
$73,000
🖨 Deal sheet 📄 Offer letter ✓ Due diligence
Listing remarks MLS
This is an amazing opportunity for any investor. You can come into a nearly rent ready home and build immediate equity.
Key facts
- Ample natural light
- Eat-in kitchen
- 5,053 sq ft lot
Tags
Property features AI
Finance
- Other: Lot under 1/4 acre (0.12 acre); 720 total living area
Exterior
- Parking: On-street parking
- Utilities: Public water; Municipal sewer; Solid waste service
- Home design: Single-family residence; One story
- Construction: Vinyl siding; Crawl space foundation
- Exterior features: Front porch
Interior
- Kitchen: Electric oven; Refrigerator
- Bedrooms: Two main-level bedrooms (10x13 and 11x11)
- Bathrooms: One full bathroom (main level)
- Heating & cooling: Forced air heating (natural gas); No cooling
- Interior features: Eat-in kitchen; 5 total main-level rooms
Neighborhood map
What this means for you Summary
Snapshot
- This is a 2-bed/1.0-bath single-family listed at $73k.
Deal economics
- At list price, monthly cash flow is $80 ($963/yr) — positive.
- The deal already cash-flows at list — no discount required.
- Meets the 1% rule at list price ($942 rent vs $73k).
- Cap rate 7.6% vs local median 4.4% in Indianapolis city (balance) — top-decile yield for the area; either an underpriced asset or a hidden risk that comps aren't pricing in. Stress-test before assuming the spread holds.
Location & tenants
- Location reads: area grade C — affects rentability + tenant quality, not the cash-flow math above.
- Indianapolis Public Schools (urban): math 14% / reading 20% proficiency, ranked #286 of 301 in IN (top 95%) — low school quality limits family demand, transient renter base, plan for 1-2y turnover; 77% free/reduced lunch — lower-income household profile, screen leases tightly.
- Market conditions: Rents flat; 334 active listings in the ZIP; 36 comparable units currently listed for rent nearby; rentals at typical pace (median 24d on market — plan ~3-4 weeks tenant-placement turnaround); lower-income renter base — watch delinquency; 1,906 units permitted in Marion County in 2024 (621 in 5+ unit buildings).
Forward outlook
- Local home prices are declining (-3.0%/yr); year-one equity from $505 of loan paydown is wiped out by about $2k of value loss. Plan a longer hold.
- Marion County population projected at +18% by 2050 — long-run rental-demand tailwind backs the buy-and-hold thesis.
Negotiation context
- Only 1 days on market — expect competitive offers; lowballing is unlikely to land.
- 3 sale attempts since 6y ago with the ask held roughly flat each time — persistent listings suggest the price (not the market) is what's stuck; bring a comps-based counter.
- Current owner paid $20k; list at $73k implies a 265% gain — meaningful room to come down on a strong offer.
Risks & watch-outs
- Watch-outs: property tax is 4.1% of price; built in 1920 — expect roof / HVAC / electrical / plumbing capex.
Questions for the listing agent
- Built in 1920 — when were the roof, HVAC, electrical panel, plumbing, and water heater last replaced?
- Property tax is high relative to price — has the assessment been appealed recently, and will the sale trigger a re-assessment?
- Is there a deadline driving the sale (1031 exchange, divorce, estate, relocation)? That informs how much negotiation room exists.
- What's the average days-on-market for RENTAL listings here right now (not sales)? A rising rental-DOM trend means longer vacancies and softer asking-rent achievability than the comps imply.
- What's the recent tenant-quality profile in this submarket — average credit score on applications, eviction rate, late-payment / NSF rate, and stable-employment percentage? A property-management company in the area should have these aggregated.
- How much new for-sale + rental construction is in the pipeline within 1–3 miles? Heavy new supply typically softens prices + rents 12–24 months out; constrained supply supports both.
Investment metrics
- 1% rule
- 1.29% ✓
- Cap rate
- 7.61%
- Cash-on-cash
- 4.71%
- DSCR
- 1.21
- GRM
- 6.5
CMA / ARV
- ARV (on-the-fly)
- $74,880
- Comps found
- 12
Show comp detail 12 sales within ~0.75 mi
| Address | Dist | Beds/Ba | Sqft | Sold | Price | $/sf | Match |
|---|---|---|---|---|---|---|---|
| 2724 N Dearborn St | 0.04mi | 2/1.0 | 720 (0%) | 10mo | $95,000 | $132 | 90 |
| 2839 N Lasalle St | 0.13mi | 2/1.0 | 768 (+7%) | 5mo | $55,000 | $72 | 79 |
| 2959 N Lasalle St | 0.28mi | 2/1.0 | 720 (0%) | 11mo | $59,900 | $83 | 78 |
| 3114 Adams St | 0.47mi | 2/1.0 | 725 (+1%) | 3mo | $63,000 | $87 | 74 |
| 2801 Brouse Ave | 0.55mi | 2/1.0 | 720 (0%) | 13mo | $74,900 | $104 | 63 |
| 3135 N Temple Ave | 0.62mi | 1/1.0 (-1) | 725 (+1%) | 4mo | $78,000 | $108 | 62 |
| 2942 N Dearborn St | 0.25mi | 2/1.0 | 825 (+15%) | 7mo | $70,000 | $85 | 58 |
| 3105 N Tacoma Ave | 0.62mi | 2/1.0 | 696 (-3%) | 10mo | $137,500 | $198 | 57 |
| 3061 N Tacoma Ave | 0.60mi | 2/1.0 | 672 (-7%) | 6mo | $43,000 | $64 | 56 |
| 3015 Adams St | 0.36mi | 2/1.0 | 819 (+14%) | 9mo | $155,000 | $189 | 53 |
| 3111 Station St | 0.62mi | 2/1.0 | 776 (+8%) | 11mo | $100,000 | $129 | 49 |
| 2919 N Denny St | 0.64mi | 2/1.0 | 816 (+13%) | 6mo | $52,500 | $64 | 42 |
Match score weights: distance 35% · size 25% · config 20% · recency 20%. Top-matched comps best support the ARV.
Projected returns pro-forma
-3.0% appreciation · 0.81% rent growth · sell at horizon
- IRR
- -12.0%
- Equity multiple
- 0.58×
- Total profit
- $-8,635
- Equity at exit
- $10,885
- IRR
- -7.4%
- Equity multiple
- 0.59×
- Total profit
- $-8,459
- Equity at exit
- $6,312
Cash invested: $20,440 (down + closing). Projections, not guarantees.
Landlord ↔ Tenant lean methodology
- Overall (STATE)
- 90 Strongly Landlord-Friendly
- State Indiana
- 90 Strongly Landlord-Friendly · R+11
- County
- — inherits STATE
- City
- — inherits STATE
ZIP-level market 46218
- Home prices YoY
- -17.1%
- Rents YoY
- 0.8%
- Active inventory
- 334
- Price-to-rent
- 6.5×
Monthly cashflow live
- Estimated rent
- $942 high interval (Pro) →
- Mortgage (P&I)
- −$383
- Tax from tax record
- −$251 /mo · $3,011/yr
- Insurance
- −$30
- HOA
- −$0
- Vacancy / Maint / Mgmt
- −$198
- Net cashflow
- $80
Break-even live
UW: 25.0% down · 7.5% · 30yr · 1.5% tax · 5.0% vac · 8.0% maint · 8.0% mgmt
Financing live
Cash to close
- Down payment
- $18,250
- Closing costs
- $2,190
- Reserves months
- —
- Total cash needed
- —
Loan-product check · same deal, 3 products live
Conventional
25% down · 7.5% · 30yr
- Down + closing
- —
- Monthly P&I
- —
- Monthly cashflow
- —
- DSCR
- —
- Eligible?
- —
Personal DTI + credit; lowest rate.
DSCR
20% down · 8.5% · 30yr
- Down + closing
- —
- Monthly P&I
- —
- Monthly cashflow
- —
- DSCR
- —
- Eligible?
- —
No personal income docs; deal must DSCR.
Hard money
10% down · 12.0% · 12mo
- Down + closing
- —
- Monthly P&I
- —
- Monthly cashflow
- —
- DSCR
- —
- Eligible?
- —
Short-term bridge; refi at stabilization.
Rent comps 36 comps
| Address | Beds | Baths | Sqft | Rent | $/sqft | DOM | Units | Dist |
|---|---|---|---|---|---|---|---|---|
| 3011 Oxford Ln Indianapolis, IN | 1.0 | 1.0 | 640 | $800 | $1.25 | 44d | 1 | 0.20mi |
| 2449 Wheeler St Indianapolis, IN | 1.0 | 1.0 | 600 | $950 | $1.58 | 23d | 1 | 0.21mi |
| 2722 N Olney St Indianapolis, IN | 2.0 | 1.0 | 650 | $795 | $1.22 | 44d | 1 | 0.24mi |
| 2422 Adams St Unit 2 Indianapolis, IN | 1.0 | 1.0 | 700 | $850 | $1.21 | 44d | 1 | 0.26mi |
| 2930 N Dearborn St Indianapolis, IN | 1.0 | 1.0 | 536 | $599 | $1.12 | 23d | 1 | 0.26mi |
| 2821 Oxford Ln Indianapolis, IN | 1.0 | 1.0 | 640 | $825 | $1.29 | 44d | 1 | 0.29mi |
| 2530 N Temple Ave Indianapolis, IN | 1.0 | 1.0 | 720 | $750 | $1.04 | 20d | 1 | 0.41mi |
| 2519 Baltimore Ave Unit B Indianapolis, IN | 2.0 | 1.0 | 482 | $775 | $1.61 | 23d | 1 | 0.76mi |
| 2372 Beckwith Dr Indianapolis, IN | 4.0 | 1.0–1.5 | 779 | $1,064 | $1.36 | 1d | 32 | 0.84mi |
| 1931 N Oxford St Indianapolis, IN | 1.0 | 1.0 | 616 | $875 | $1.42 | 4d | 1 | 0.88mi |
| 3383 Station St Indianapolis, IN | 3.0 | 1.0 | 744 | $1,250 | $1.68 | 23d | 1 | 0.90mi |
| 3421 N Olney St Indianapolis, IN | 2.0 | 1.0 | 720 | $1,195 | $1.66 | 16d | 1 | 0.93mi |
| 2827 E 18th St Indianapolis, IN | 2.0 | 1.0 | 726 | $1,300 | $1.79 | 23d | 1 | 1.05mi |
| 3058 Brookside Parkway North Dr Indianapolis, IN | 1.0 | 1.0 | 700 | $875 | $1.25 | 12d | 1 | 1.08mi |
| 3363 Nicholas Ave Indianapolis, IN | 2.0 | 1.0 | 720 | $1,000 | $1.39 | 4d | 1 | 1.11mi |
| 4615 E 30th St Indianapolis, IN | 2.0 | 1.0 | 660 | $1,100 | $1.67 | 23d | 1 | 1.13mi |
| 2030 N Colorado Ave Indianapolis, IN | 2.0 | 1.0 | 728 | $1,150 | $1.58 | 23d | 1 | 1.13mi |
| 2846 Doctor Andrew J Brown Ave Indianapolis, IN | 1.0 | 1.0 | 420 | $700 | $1.67 | 44d | 1 | 1.28mi |
| 3709 Brookside Parkway South Dr Indianapolis, IN | 1.0 | 1.0 | 742 | $825 | $1.11 | 23d | 1 | 1.29mi |
| 3725 N Sherman Dr #7 Indianapolis, IN | 2.0 | 1.0 | 729 | $845 | $1.16 | 4d | 1 | 1.35mi |
| 3719 Hillside Ave Indianapolis, IN | 1.0 | 1.0 | 644 | $725 | $1.13 | 23d | 1 | 1.36mi |
| 3132 Dr Andrew J Brown Ave Indianapolis, IN | 2.0 | 1.0–2.0 | 791 | $2,120 | $2.68 | 2d | 46 | 1.38mi |
| 1358 N Gale St Indianapolis, IN | 1.0 | 1.0 | 550 | $890 | $1.62 | 16d | 1 | 1.40mi |
| 1518 N Chester Ave Indianapolis, IN | 2.0 | 1.0 | 672 | $700 | $1.04 | 7d | 1 | 1.40mi |
| 1538 N Grant Ave Indianapolis, IN | 1.0 | 1.0 | 375 | $700 | $1.87 | 44d | 1 | 1.41mi |
| 1951 N Bosart Ave Indianapolis, IN | 2.0 | 1.0 | 728 | $1,000 | $1.37 | 4d | 1 | 1.42mi |
| 1531 N Grant Ave Indianapolis, IN | 1.0 | 1.0 | 611 | $875 | $1.43 | 23d | 1 | 1.43mi |
| 3763 Baltimore Ave Unit 3765 Indianapolis, IN | 1.0 | 1.0 | 750 | $750 | $1.00 | 44d | 1 | 1.44mi |
| 3709 Kinnear Ave Indianapolis, IN | 2.0 | 1.0 | 650 | $1,000 | $1.54 | 44d | 1 | 1.44mi |
| 1315 N Rural St Indianapolis, IN | 1.0 | 1.0 | 700 | $1,000 | $1.43 | 4d | 1 | 1.45mi |
| 4726 E 34th St Indianapolis, IN | 1.0 | 1.0 | 643 | $800 | $1.24 | 23d | 1 | 1.46mi |
| 3615 Sherman Forest Dr Indianapolis, IN | 4.0 | 1.0–2.5 | 1057 | $1,288 | $1.22 | 4d | 1 | 1.47mi |
| 1512 N Gladstone Ave Unit 1510 1510 Indianapolis, IN | 1.0 | 1.0 | 570 | $830 | $1.46 | 14d | 1 | 1.48mi |
| 1510 N Gladstone Ave Indianapolis, IN | 1.0 | 1.0 | 570 | $765 | $1.34 | 44d | 1 | 1.48mi |
| 1301 N Olney St Unit 1303 Indianapolis, IN | 2.0 | 1.0 | 750 | $1,100 | $1.47 | 44d | 1 | 1.50mi |
| 3723 Orchard Ave Unit 3723 Indianapolis, IN | 1.0 | 1.5 | 700 | $1,300 | $1.86 | 23d | 1 | 1.50mi |
Listing history 2 events
-
2026-06-19remarks 699-char remark
-
2026-06-19$73,000 Active 1 DOM
ⓘ Source: listings_history table (triggers on properties + properties_extension) + one-shot
backfill from property_details.listing_events for pre-trigger history.
Tax reassessment forecast IN · Partial reset (capped growth)
- Current annual tax
- $3,011 · $251/mo
- Projected year-2 tax
- $3,011 · $251/mo
- Expected delta
- $0/yr ($0/mo · 0.0%)
ⓘ Screening estimate from a state-policy table — verify with the county assessor before closing.
Climate risk First Street
- Flood 1/10 Low FEMA zone X (unshaded) · 0% chance over 30 yrs
- Wildfire 1/10 Low
- Heat 3/10 Moderate 7 d/yr ≥102°F today · 18 d/yr by 30 yrs out
- Wind 2/10 Low 0% chance of damaging wind over 30 yrs
- Air quality 4/10 Moderate 5 unhealthy d/yr today · 7 by 30 yrs out
Nearby sold comps map
Loading sold comps map…
Walkable amenities ~0.75 mi
Loading nearby amenities…
Taxation est. · year 1
- Rental income
- $11,308
- − Mortgage interest
- −$4,089
- − Property taxes
- −$3,011
- − Insurance
- −$365
- − Repairs & maintenance
- −$905
- − Management
- −$905
- − Depreciation
- −$2,124
- Taxable loss
- −$90
- Est. tax savings @ 24.0%
- +$22
- After-tax cash flow
- $985/yr
For passive investors: Depreciation is non-cash, so a rental often shows a tax loss while cash-flowing — sheltering income. Rental losses are passive: they offset passive income freely, and up to $25,000/yr can offset ordinary (W-2) income if you actively participate and your MAGI is under $100k (phasing out to $0 by $150k); unused losses carry forward. On sale, claimed depreciation is recaptured at up to 25%, and gains may owe capital-gains tax (a 1031 exchange can defer both). Figures are a year-1 estimate at your 24.0% rate — not tax advice; consult a CPA.
Schools (NCES district)
- District
- Indianapolis Public Schools
- NCES district ID
- 1804770
- Math proficiency
- 14% ▼ -7.00%
- Reading proficiency
- 20% ▼ -3.00%
- Median HH income
- $32,034
- Composite
- 13.69/100
- National rank
- #9499
- State rank
- #286 of 301 in IN
Livability — Indianapolis city (balance)
No livability data for this city. (Only ~50 U.S. cities are tracked.)
Census & demographics
- Census place
- Indianapolis city (balance), IN
- County
- Marion County · 998,460 people
- City population
- 881,119
- Metro
- Indianapolis-Carmel-Anderson, IN
- Population (ZIP)
- 29,360
- Household income
- $38,063
- Rent vs Own
- Severe rent burden
- 2340.0
Population outlook (Marion County) Hauer SSP2
- Today (2025)
- 1,025,572 people
- By 2030
- 1,065,727 · +3.9%
- By 2040
- 1,141,577 · +11.3%
- By 2050
- 1,208,920 · +17.9%
- By 2075
- 1,367,288 · +33.3%
- By 2100
- 1,438,201 · +40.2%
Race, ethnicity, and origin ACS 2023
- Neighborhood character
- Predominantly Black (68%)
- Race & ethnicity
- Black 68% White 18% Hispanic / Latino 9% Two or more races 6%
- Hispanic origin (detail)
- Mexican 6%
- Common ancestry
- Romanian 1%
- Foreign-born
- 5% · Canada, Philippines
- Languages at home
- 92% English-only · Spanish 7%
Political lean MEDSL · Marion
- 2024 margin
- Strong D (+27.7) · D 63.0% · R 35.3% · Other 1.7%
- 2008→2024 swing
- -0.7pp no change · 2008: 28.4pp · 2024: 27.7pp
- All cycles
- 2024: D+27.7 2020: D+29.1 2016: D+22.8 2012: D+22.2 2008: D+28.4
Not yet ingested
- Civics
- —
Market trends
- HPI YoY
- ▼ -81.57%
- Current HPI
- 395.7071
- Rent YoY
- ▲ 0.81%
- Metro
- Indianapolis-Carmel-Anderson, IN
- State GDP YoY
- ▲ 2.90%
- F500 in state
- 18
Industry mix (Fortune 500 HQ in IN)
| Industry | F500 HQs | Revenue |
|---|---|---|
| Industrial Machinery | 2 | $37B |
|
||
| Healthcare | 1 | $177B |
|
||
| Pharmaceuticals | 1 | $45B |
|
||
| Metals / Steel | 1 | $18B |
|
||
| Agriculture | 1 | $17B |
|
||
| Packaging | 1 | $12B |
|
||
Price history
+128.1% since first listed7 events — show timeline
- 2026-06-18 Listed $73,000 MIBOR as Distributed by MLS Grid
- 2026-03-27 Rental Removed $725 SHOWMOJO
- 2026-03-12 Price Changed $725 SHOWMOJO
- 2026-02-13 Price Changed $750 SHOWMOJO
- 2025-12-04 Listed for Rent $775 SHOWMOJO
- 2020-05-26 Sold (MLS) $20,000 MIBOR as Distributed by MLS Grid
- 2020-03-12 Listed $32,000 MIBOR as Distributed by MLS Grid
Property tax history
+32.9%/yrLatest (2025): $3,011 · +6.4% YoY. Source: county tax records.
Cash-flow waterfall
monthlySold comps — $/sqft
last 12 mo · ≤1 miLoading sold comps…