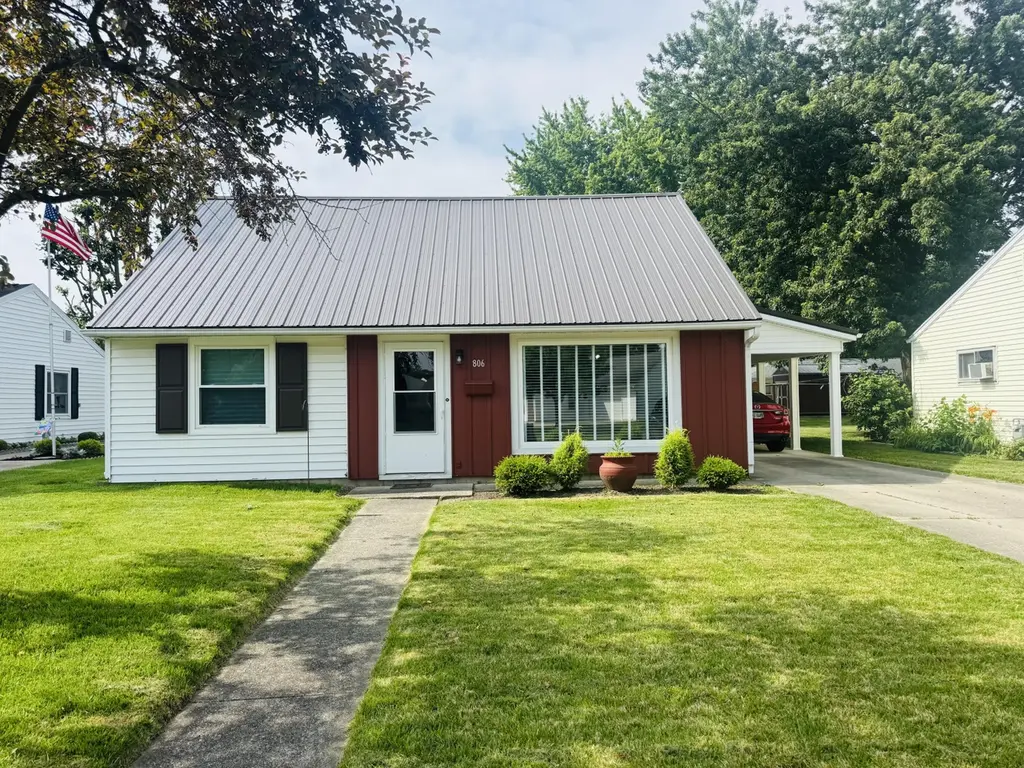
806 Hemlock St · Celina, OH
Flood risk 1/10 · Minimal
- FEMA flood zone
- X (unshaded)
- Chance of flooding over 30 yrs
- 0.0%
- Est. flood insurance / yr
- $507 – $1,088
Fire risk 1/10 · Minimal
- Est. fire insurance / yr
- $713 – $1,323
Heat risk 3/10 · Minor
- Hot days now (above 100°F)
- 7 days/yr
- Hot days in 30 yrs
- 18 days/yr
Wind risk 2/10 · Minimal
- Chance of severe wind over 30 yrs
- —
Air-quality risk 2/10 · Minimal
- Unhealthy air days now
- 1 days/yr
- Unhealthy air days in 30 yrs
- 2 days/yr
Risk factors via First Street. Map © Google.
Why this score? — see what drove the F grade
The composite is a weighted blend of 9 inputs, each scored 0–100. Each bar is that input's sub-score; the figure is the points it added to the 100-point composite (weight × sub-score).
- Cash flow +13.5/30.0
- Schools +5.0/10.0
- DSCR +4.1/10.0
- Livability +3.6/5.0
- 1% rule +3.2/10.0
- Rent growth +2.5/5.0
- Condition / age +2.5/5.0
- ARV discount +0.0/15.0
- Appreciation +0.0/10.0
$189,900
🖨 Deal sheet 📄 Offer letter ✓ Due diligence
Listing remarks MLS
Welcome to this beautifully updated 3-bedroom, 1-bathroom home, nestled in a peaceful and friendly neighborhood. Located within walking distance to schools, this home is ideal for families or anyone seeking a prime spot with access to amenities. The updated kitchen is chef's delight, while the upstairs boasts brand-new carpeting & fresh paint. The fully updated interior blends modern touches with classic charm, offering a move-in-ready experience for its next owners. Outside, you'll find two spacious storage units, perfect for your extra belongings. Don't miss this opportunity to own a perfect blend of comfort and convenience! Schedule your showing today and make this house your home
Key facts
- Metal roof
- Updated kitchen
- 6,534 sq ft lot
Tags
Property features AI
Exterior
- Parking: Carport
- Utilities: Supplied water; Public sewer; Natural gas connected
- Home design: Single family residence; House; Built in 1955; Lot dimensions approx. 58 x 110
- Construction: Vinyl siding; Slab foundation
- Exterior features: Patio; Shed(s); Residential lot
Interior
- Kitchen: Dishwasher; Microwave; Refrigerator; Gas water heater
- Bedrooms: Master bedroom (12 x 11); Bedroom 2 (11 x 10); Bedroom 3 (15 x 11)
- Bathrooms: 1 full bathroom
- Heating & cooling: Central air conditioning; Forced air heating (natural gas)
- Interior features: Attic; Window coverings
- Laundry & utility: Washer/dryer location not specified
Neighborhood map
What this means for you Summary
Snapshot
- This is a 3-bed/1.0-bath single-family listed at $190k.
Deal economics
- At list price, monthly cash flow is $7 ($88/yr) — positive.
- The deal already cash-flows at list — no discount required.
- To meet the 1% rule (rent ≥ 1% of price), the offer needs to be $155k (18.4% below list).
- Recommended offer: $155k (18.4% below list) — sets the bar for 1% rule.
- Cap rate 6.3% vs local median 4.9% in Celina — top-decile yield for the area; either an underpriced asset or a hidden risk that comps aren't pricing in. Stress-test before assuming the spread holds.
Location & tenants
- Location reads 71/100 on livability (#397 in OH) — a middle-class / working-renter tenant base. Strengths: crime A+, cost of living A+, housing A+; Watch: amenities F, commute F, health & safety F.
- Celina City (town): math 64% / reading 55% proficiency, ranked #299 of 656 in OH (top 46%) — acceptable for families but not a draw, mixed tenant base, ~2y average lease.
- Market conditions: 67 active listings in the ZIP; 1 comparable units currently listed for rent nearby; 92 units permitted in Mercer County in 2024 (0 in 5+ unit buildings).
Forward outlook
- Local home prices are declining (-3.0%/yr); year-one equity from $1k of loan paydown is wiped out by about $6k of value loss. Plan a longer hold.
- Mercer County population projected at -13% by 2050 — secular population decline; favor cash flow + early exit over multi-decade hold.
Negotiation context
- Only 10 days on market — expect competitive offers; lowballing is unlikely to land.
- 3 sale attempts since 10y ago with the ask held roughly flat each time — persistent listings suggest the price (not the market) is what's stuck; bring a comps-based counter.
Risks & watch-outs
- Watch-outs: built in 1955 — expect roof / HVAC / electrical / plumbing capex.
Questions for the listing agent
- Built in 1955 — when were the roof, HVAC, electrical panel, plumbing, and water heater last replaced?
- Is there a deadline driving the sale (1031 exchange, divorce, estate, relocation)? That informs how much negotiation room exists.
- Schools are A-rated — typically a magnet for longer-tenancy family renters. What's the average tenant stay here, and is there a school-zone premium baked into asking?
- The area grade is low — what's the realistic commute time and amenity access for the typical tenant pool here? Any planned neighborhood developments (good or bad) we should know about?
- What's the average days-on-market for RENTAL listings here right now (not sales)? A rising rental-DOM trend means longer vacancies and softer asking-rent achievability than the comps imply.
- What's the recent tenant-quality profile in this submarket — average credit score on applications, eviction rate, late-payment / NSF rate, and stable-employment percentage? A property-management company in the area should have these aggregated.
- How much new for-sale + rental construction is in the pipeline within 1–3 miles? Heavy new supply typically softens prices + rents 12–24 months out; constrained supply supports both.
Investment metrics
- 1% rule
- 0.82% ✗
- Cap rate
- 6.34%
- Cash-on-cash
- 0.17%
- DSCR
- 1.01
- GRM
- 10.2
CMA / ARV
- ARV (on-the-fly)
- $162,240
- Comps found
- 12
Show comp detail 12 sales within ~0.75 mi
| Address | Dist | Beds/Ba | Sqft | Sold | Price | $/sf | Match |
|---|---|---|---|---|---|---|---|
| 836 Hemlock St | 0.14mi | 3/1.0 | 936 (-10%) | 7mo | $164,000 | $175 | 71 |
| 120 E Blake St | 0.48mi | 2/1.0 (-1) | 1,056 (+2%) | 2mo | $160,000 | $152 | 68 |
| 834 Hemlock St | 0.13mi | 3/1.0 | 936 (-10%) | 13mo | $177,000 | $189 | 66 |
| 619 N Sugar St | 0.67mi | 3/1.0 | 1,026 (-1%) | 7mo | $128,500 | $125 | 61 |
| 906 Greenbriar Ct | 0.40mi | 2/1.0 (-1) | 1,026 (-1%) | 18mo | $160,000 | $156 | 59 |
| 627 N Sugar St | 0.67mi | 2/1.5 (-1) | 1,044 (+0%) | 6mo | $135,000 | $129 | 56 |
| 1001 N Sugar St | 0.66mi | 3/2.0 | 1,106 (+6%) | 2mo | $169,900 | $154 | 53 |
| 1006 Meadowview Dr | 0.38mi | 3/2.5 | 1,134 (+9%) | 11mo | $240,900 | $212 | 52 |
| 209 E Forest St | 0.41mi | 3/1.0 | 936 (-10%) | 15mo | $157,500 | $168 | 52 |
| 313 E Fulton St | 0.51mi | 2/1.0 (-1) | 1,118 (+8%) | 16mo | $85,000 | $76 | 46 |
| 7261 State Route 197 | 0.74mi | 4/1.0 (+1) | 1,105 (+6%) | 13mo | $195,900 | $177 | 39 |
| 601 E Market St | 0.56mi | 2/1.0 (-1) | 908 (-13%) | 15mo | $140,000 | $154 | 35 |
Match score weights: distance 35% · size 25% · config 20% · recency 20%. Top-matched comps best support the ARV.
Projected returns pro-forma
-3.0% appreciation · 3.0% rent growth · sell at horizon
- IRR
- -16.1%
- Equity multiple
- 0.43×
- Total profit
- $-30,338
- Equity at exit
- $28,315
- IRR
- -7.7%
- Equity multiple
- 0.51×
- Total profit
- $-25,956
- Equity at exit
- $16,419
Cash invested: $53,172 (down + closing). Projections, not guarantees.
Landlord ↔ Tenant lean methodology
- Overall (STATE)
- 73 Landlord-Friendly
- State Ohio
- 73 Landlord-Friendly · R+6
- County
- — inherits STATE
- City
- — inherits STATE
ZIP-level market 45822
- Active inventory
- 67
- Price-to-rent
- 10.2×
Monthly cashflow live
- Estimated rent
- $1,550 medium interval (Pro) →
- Mortgage (P&I)
- −$996
- Tax from tax record
- −$142 /mo · $1,706/yr
- Insurance
- −$79
- HOA
- −$0
- Vacancy / Maint / Mgmt
- −$326
- Net cashflow
- $7
Break-even live
UW: 25.0% down · 7.5% · 30yr · 1.5% tax · 5.0% vac · 8.0% maint · 8.0% mgmt
Financing live
Cash to close
- Down payment
- $47,475
- Closing costs
- $5,697
- Reserves months
- —
- Total cash needed
- —
Loan-product check · same deal, 3 products live
Conventional
25% down · 7.5% · 30yr
- Down + closing
- —
- Monthly P&I
- —
- Monthly cashflow
- —
- DSCR
- —
- Eligible?
- —
Personal DTI + credit; lowest rate.
DSCR
20% down · 8.5% · 30yr
- Down + closing
- —
- Monthly P&I
- —
- Monthly cashflow
- —
- DSCR
- —
- Eligible?
- —
No personal income docs; deal must DSCR.
Hard money
10% down · 12.0% · 12mo
- Down + closing
- —
- Monthly P&I
- —
- Monthly cashflow
- —
- DSCR
- —
- Eligible?
- —
Short-term bridge; refi at stabilization.
Rent comps 1 comps
| Address | Beds | Baths | Sqft | Rent | $/sqft | DOM | Units | Dist |
|---|---|---|---|---|---|---|---|---|
| 2006 Legacy LN Unit 2010-303 Celina, OH | 2.0 | 2.0 | 1007 | $1,550 | $1.54 | 43d | 1 | 1.29mi |
Listing history 8 events
-
2026-06-18days on market $189,900 Active 10 DOM
-
2026-06-17days on market $189,900 Active 9 DOM
-
2026-06-16days on market $189,900 Active 8 DOM
-
2026-06-15days on market $189,900 Active 7 DOM
-
2026-06-13days on market $189,900 Active 5 DOM
-
2026-06-12days on market $189,900 Active 4 DOM
-
2026-06-09remarks 695-char remark
-
2026-06-09$189,900 Active 1 DOM
ⓘ Source: listings_history table (triggers on properties + properties_extension) + one-shot
backfill from property_details.listing_events for pre-trigger history.
Tax reassessment forecast OH · Partial reset (capped growth)
- Current annual tax
- $1,706 · $142/mo
- Projected year-2 tax
- $2,334 · $195/mo
- Expected delta
- +$628/yr (+$52/mo · 36.8%)
ⓘ Screening estimate from a state-policy table — verify with the county assessor before closing.
Climate risk First Street
- Flood 1/10 Low FEMA zone X (unshaded) · 0% chance over 30 yrs
- Wildfire 1/10 Low
- Heat 3/10 Moderate 7 d/yr ≥100°F today · 18 d/yr by 30 yrs out
- Wind 2/10 Low
- Air quality 2/10 Low 1 unhealthy d/yr today · 2 by 30 yrs out
Nearby sold comps map
Loading sold comps map…
Walkable amenities ~0.75 mi
Loading nearby amenities…
Taxation est. · year 1
- Rental income
- $18,600
- − Mortgage interest
- −$10,637
- − Property taxes
- −$1,706
- − Insurance
- −$950
- − Repairs & maintenance
- −$1,488
- − Management
- −$1,488
- − Depreciation
- −$5,524
- Taxable loss
- −$3,193
- Est. tax savings @ 24.0%
- +$766
- After-tax cash flow
- $855/yr
For passive investors: Depreciation is non-cash, so a rental often shows a tax loss while cash-flowing — sheltering income. Rental losses are passive: they offset passive income freely, and up to $25,000/yr can offset ordinary (W-2) income if you actively participate and your MAGI is under $100k (phasing out to $0 by $150k); unused losses carry forward. On sale, claimed depreciation is recaptured at up to 25%, and gains may owe capital-gains tax (a 1031 exchange can defer both). Figures are a year-1 estimate at your 24.0% rate — not tax advice; consult a CPA.
Schools (NCES district)
- District
- Celina City
- NCES district ID
- 3910030
- Math proficiency
- 64% ▼ -9.00%
- Reading proficiency
- 55% ▼ -9.00%
- Median HH income
- $47,168
- Composite
- 50.44/100
- National rank
- #1864
- State rank
- #299 of 656 in OH
Livability — Celina
- Score
- 71/100
- State rank
- #397
- US rank
- #6556
Category grades
Schools grade is shown separately in the Schools card above.
Census & demographics
- Census place
- Celina, OH
- County
- Mercer · 42,068 people
- Population (ZIP)
- 20,170
- Household income
- $72,106
- Rent vs Own
- Severe rent burden
- 15.9
Population outlook (Mercer County) Hauer SSP2
- Today (2025)
- 40,163 people
- By 2030
- 39,367 · -2.0%
- By 2040
- 37,406 · -6.9%
- By 2050
- 34,917 · -13.1%
- By 2075
- 28,969 · -27.9%
- By 2100
- 21,338 · -46.9%
Race, ethnicity, and origin ACS 2023
- Neighborhood character
- Predominantly White (93%)
- Race & ethnicity
- White 93% Two or more races 4% Hispanic / Latino 2% Black 1%
- Common ancestry
- Lithuanian 3% Slovak 1% Iranian 1%
- Foreign-born
- 1% · Canada, Vietnam
- Languages at home
- 98% English-only · German/W. Germanic 1%
Political lean MEDSL · Mercer
- 2024 margin
- Solid R (+66.7) · D 16.3% · R 83.0%
- 2008→2024 swing
- -23.2pp toward R · 2008: -43.5pp · 2024: -66.7pp
- All cycles
- 2024: R+66.7 2020: R+64.9 2016: R+65.0 2012: R+54.8 2008: R+43.5
Not yet ingested
- Civics
- —
Market trends
- HPI YoY
- ▼ -211.25%
- Current HPI
- 204.0486
- Rent YoY
- —
- Metro
- —
- State GDP YoY
- ▲ 1.98%
- F500 in state
- 48
Industry mix (Fortune 500 HQ in OH)
| Industry | F500 HQs | Revenue |
|---|---|---|
| Insurance | 3 | $145B |
|
||
| Industrial Machinery | 3 | $49B |
|
||
| Financial Services | 3 | $24B |
|
||
| Consumer Goods | 2 | $93B |
|
||
| Aerospace / Defense | 2 | $47B |
|
||
| Utilities | 2 | $33B |
|
||
Price history
+153.5% since first listed8 events — show timeline
- 2026-06-08 Listed $189,900 WRIST
- 2025-02-24 Sold (MLS) $172,000 WRIST
- 2025-02-10 Pending — WRIST
- 2025-01-25 Contingent — WRIST
- 2024-12-02 Listed $181,500 WRIST
- 2016-04-05 Sold (Public Records) $68,000 Public Records
- 2016-04-05 Sold (MLS) $68,000 WRIST
- 2016-02-22 Listed $74,900 WRIST
Property tax history
+13.4%/yrLatest (2024): $1,706 · -0.1% YoY. Source: county tax records.
Cash-flow waterfall
monthlySold comps — $/sqft
last 12 mo · ≤1 miLoading sold comps…