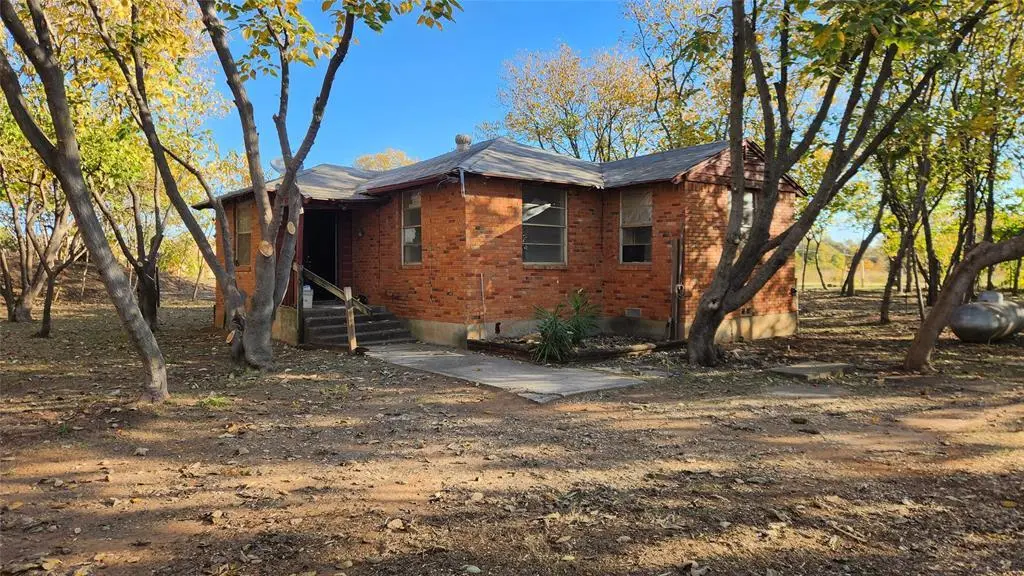
2518 Laney Rd · Denton, TX
Flood risk 1/10 · Minimal
- FEMA flood zone
- X (unshaded)
- Chance of flooding over 30 yrs
- 0.0%
- Est. flood insurance / yr
- $507 – $1,088
Fire risk 4/10 · Minor
- Est. fire insurance / yr
- $1,222 – $2,270
Heat risk 7/10 · Major
- Hot days now (above 110°F)
- 7 days/yr
- Hot days in 30 yrs
- 23 days/yr
Wind risk 6/10 · Moderate
- Chance of severe wind over 30 yrs
- 27.0%
Air-quality risk 4/10 · Minor
- Unhealthy air days now
- 4 days/yr
- Unhealthy air days in 30 yrs
- 5 days/yr
Risk factors via First Street. Map © Google.
Why this score? — see what drove the B- grade
The composite is a weighted blend of 9 inputs, each scored 0–100. Each bar is that input's sub-score; the figure is the points it added to the 100-point composite (weight × sub-score).
- Cash flow +30.0/30.0
- DSCR +10.0/10.0
- 1% rule +8.1/10.0
- ARV discount +7.5/15.0
- Livability +4.4/5.0
- Schools +3.5/10.0
- Rent growth +2.6/5.0
- Condition / age +2.5/5.0
- Appreciation +0.0/10.0
$145,000
🖨 Deal sheet 📄 Offer letter ✓ Due diligence
Listing remarks
Own WATER-WELL. Investor Opportunity 0.70-Acre Lot in Denton outside of city limits. Existing structure is in poor condition and may require a full renovation or possible teardown, offering flexibility for redevelopment, new construction, or a value-add project. Property will have a new water well before closing. Recent survey, and prior appraisal are attached for reference. All information provided is for convenience only; buyer to independently verify utilities, costs, feasibility, zoning, and development plans. Based on prior valuation, property appraised around $300,000 if remodeled (buyer to perform own due diligence).
Key facts
- Possible teardown
- 0.70-acre lot
- New construction
Tags
Property features AI
Finance
- Other: Parcel ID: R37871; Subdivision: Th Living; County: Denton
- Financial info: Treat as clear loan type; No second mortgage
- HOA & community: No homeowners association
Exterior
- Parking: No covered or carport spaces; Gravel parking
- Utilities: Well water; Aerobic septic (sewer)
- Home design: Single-family residence; Residential property; Built in 1959; One story
- Construction: Pillar/post/pier foundation
- Exterior features: Gravel parking area; Approximately 0.7-acre lot
Interior
- Kitchen: Other appliances included
- Bedrooms: Primary bedroom (13 x 12) — on main level; Total of 3 bedrooms
- Bathrooms: 1 full bathroom
- Interior features: One-level layout; One living area; One dining area; Other interior features
- Laundry & utility: No specific laundry details provided
Neighborhood map
What this means for you Summary
Snapshot
- This is a 3-bed/1.0-bath single-family listed at $145k.
Deal economics
- At list price, monthly cash flow is $568 ($7k/yr) — positive.
- The deal already cash-flows at list — no discount required.
- Meets the 1% rule at list price ($2k rent vs $145k).
- Recommended offer: $143k (1.5% below list) — sets the bar for market timing.
- Cap rate 11.0% vs local median 3.4% in Denton — top-decile yield for the area; either an underpriced asset or a hidden risk that comps aren't pricing in. Stress-test before assuming the spread holds.
Location & tenants
- Location reads 88/100 on livability (#2 in TX, #210 nationally) — a professional / high-income tenant draw. Strengths: amenities A+, commute A+, housing A+.
- Denton ISD (urban): math 36% / reading 43% proficiency, ranked #383 of 826 in TX (top 46%) — families likely to look elsewhere, expect single-tenant / working-renter base with shorter leases.
- Zoned schools: Hodge El (math 30% / reading 33%, grade F, #2,396 of 4,322 statewide, top 56%, 634 students, 80% FRL) — zoned schools average 80% FRL vs 38% district-wide (42 pts higher); higher-poverty schools than district average — tighter screening recommended.
- Market conditions: Rents flat; 279 active listings in the ZIP; 2 comparable units currently listed for rent nearby; solid renter incomes; 10,531 units permitted in Denton County in 2024 (2,713 in 5+ unit buildings).
Forward outlook
- Local home prices are declining (-3.0%/yr); year-one equity from $1k of loan paydown is wiped out by about $4k of value loss. Plan a longer hold.
- Denton County population projected at +66% by 2050 — long-run rental-demand tailwind backs the buy-and-hold thesis.
- At projected returns (-3.0% appreciation + 0.3% rent growth), your $41k cash investment doubles in ~10 years — after that, you're playing with house money.
Negotiation context
- It's been on market 22 days — a 2% lower offer ($143k) is reasonable based on typical stale-listing flexibility.
- 4 sale attempts with the ask held roughly flat each time — persistent listings suggest the price (not the market) is what's stuck; bring a comps-based counter.
Risks & watch-outs
- Watch-outs: built in 1959 — expect roof / HVAC / electrical / plumbing capex.
- Climate carrying-cost: major wind risk, 27% chance of damaging wind over 30y; extreme-heat days projected 7→23/yr by 2055 (HVAC capex compounding) — expect insurance premiums to compound above CPI over the hold.
Questions for the listing agent
- Built in 1959 — when were the roof, HVAC, electrical panel, plumbing, and water heater last replaced?
- Is there a deadline driving the sale (1031 exchange, divorce, estate, relocation)? That informs how much negotiation room exists.
- Schools are B-rated — typically a magnet for longer-tenancy family renters. What's the average tenant stay here, and is there a school-zone premium baked into asking?
- What's the average days-on-market for RENTAL listings here right now (not sales)? A rising rental-DOM trend means longer vacancies and softer asking-rent achievability than the comps imply.
- What's the recent tenant-quality profile in this submarket — average credit score on applications, eviction rate, late-payment / NSF rate, and stable-employment percentage? A property-management company in the area should have these aggregated.
- How much new for-sale + rental construction is in the pipeline within 1–3 miles? Heavy new supply typically softens prices + rents 12–24 months out; constrained supply supports both.
Investment metrics
- 1% rule
- 1.31% ✓
- Cap rate
- 10.99%
- Cash-on-cash
- 16.78%
- DSCR
- 1.75
- GRM
- 6.4
CMA / ARV
No comps found within radius.
Projected returns pro-forma
-3.0% appreciation · 0.31% rent growth · sell at horizon
- IRR
- 5.0%
- Equity multiple
- 1.19×
- Total profit
- $7,659
- Equity at exit
- $21,620
- IRR
- 12.0%
- Equity multiple
- 1.83×
- Total profit
- $33,756
- Equity at exit
- $12,537
Cash invested: $40,600 (down + closing). Projections, not guarantees.
Landlord ↔ Tenant lean methodology
- Overall (STATE)
- 87 Strongly Landlord-Friendly
- State Texas
- 87 Strongly Landlord-Friendly · R+5
- County
- — inherits STATE
- City
- — inherits STATE
ZIP-level market 76208
- Home prices YoY
- -20.9%
- Rents YoY
- 0.3%
- Active inventory
- 279
- Price-to-rent
- 6.4×
Monthly cashflow live
- Estimated rent
- $1,894 medium interval (Pro) →
- Mortgage (P&I)
- −$760
- Tax from tax record
- −$108 /mo · $1,294/yr
- Insurance
- −$60
- HOA
- −$0
- Vacancy / Maint / Mgmt
- −$398
- Net cashflow
- $568
Break-even live
UW: 25.0% down · 7.5% · 30yr · 1.5% tax · 5.0% vac · 8.0% maint · 8.0% mgmt
Financing live
Cash to close
- Down payment
- $36,250
- Closing costs
- $4,350
- Reserves months
- —
- Total cash needed
- —
Loan-product check · same deal, 3 products live
Conventional
25% down · 7.5% · 30yr
- Down + closing
- —
- Monthly P&I
- —
- Monthly cashflow
- —
- DSCR
- —
- Eligible?
- —
Personal DTI + credit; lowest rate.
DSCR
20% down · 8.5% · 30yr
- Down + closing
- —
- Monthly P&I
- —
- Monthly cashflow
- —
- DSCR
- —
- Eligible?
- —
No personal income docs; deal must DSCR.
Hard money
10% down · 12.0% · 12mo
- Down + closing
- —
- Monthly P&I
- —
- Monthly cashflow
- —
- DSCR
- —
- Eligible?
- —
Short-term bridge; refi at stabilization.
Rent comps 2 comps
| Address | Beds | Baths | Sqft | Rent | $/sqft | DOM | Units | Dist |
|---|---|---|---|---|---|---|---|---|
| 2286 Collins Rd Denton, TX | 3.0 | 2.0 | 1288 | $1,850 | $1.44 | 43d | 1 | 0.71mi |
| 2908 Mistywood Ln Denton, TX | 3.0 | 2.0 | 1304 | $1,850 | $1.42 | 12d | 1 | 1.49mi |
Listing history 26 events
-
2026-06-18days on market $145,000 Active 22 DOM
-
2026-06-17days on market $145,000 Active 21 DOM
-
2026-06-16days on market $145,000 Active 20 DOM
-
2026-06-15days on market $145,000 Active 19 DOM
-
2026-06-13days on market $145,000 Active 17 DOM
-
2026-06-09days on market $145,000 Active 13 DOM
-
2026-06-08days on market $145,000 Active 12 DOM
-
2026-06-07days on market $145,000 Active 11 DOM
-
2026-06-04days on market $145,000 Active 8 DOM
-
2026-06-03days on market $145,000 Active 7 DOM
-
2026-06-02days on market $145,000 Active 6 DOM
-
2026-06-01days on market $145,000 Active 5 DOM
-
2026-05-31days on market $145,000 Active 4 DOM
-
2026-05-27$145,000 Active
-
2026-04-30historical
-
2026-03-29price $109,900
-
2026-01-31price $119,900
-
2026-01-29price $129,900
-
2026-01-15price $139,900
-
2026-01-15price $1,399,000
-
2026-01-10$149,000 Active
-
2025-12-31historical
-
2025-11-09status Active
-
2025-10-30price $150,000
-
2025-10-30$125,000 Active
-
2025-09-26soldstatus
ⓘ Source: listings_history table (triggers on properties + properties_extension) + one-shot
backfill from property_details.listing_events for pre-trigger history.
Tax reassessment forecast TX · Resets to sale price
- Current annual tax
- $1,294 · $108/mo
- Projected year-2 tax
- $2,654 · $221/mo
- Expected delta
- +$1,359/yr (+$113/mo · 105.0%)
ⓘ Screening estimate from a state-policy table — verify with the county assessor before closing.
Climate risk First Street
- Flood 1/10 Low FEMA zone X (unshaded) · 0% chance over 30 yrs
- Wildfire 4/10 Moderate
- Heat 7/10 Severe 7 d/yr ≥110°F today · 23 d/yr by 30 yrs out
- Wind 6/10 Major 27% chance of damaging wind over 30 yrs
- Air quality 4/10 Moderate 4 unhealthy d/yr today · 5 by 30 yrs out
Nearby sold comps map
Loading sold comps map…
Walkable amenities ~0.75 mi
Loading nearby amenities…
Taxation est. · year 1
- Rental income
- $22,731
- − Mortgage interest
- −$8,122
- − Property taxes
- −$1,294
- − Insurance
- −$725
- − Repairs & maintenance
- −$1,819
- − Management
- −$1,819
- − Depreciation
- −$4,218
- Taxable income
- $4,735
- Est. tax owed @ 24.0%
- −$1,136
- After-tax cash flow
- $5,677/yr
For passive investors: Depreciation is non-cash, so a rental often shows a tax loss while cash-flowing — sheltering income. Rental losses are passive: they offset passive income freely, and up to $25,000/yr can offset ordinary (W-2) income if you actively participate and your MAGI is under $100k (phasing out to $0 by $150k); unused losses carry forward. On sale, claimed depreciation is recaptured at up to 25%, and gains may owe capital-gains tax (a 1031 exchange can defer both). Figures are a year-1 estimate at your 24.0% rate — not tax advice; consult a CPA.
Schools (NCES district)
- District
- Denton ISD
- NCES district ID
- 4816740
- Math proficiency
- 36% ▼ -18.00%
- Reading proficiency
- 43% ▼ -9.00%
- Median HH income
- $58,913
- Composite
- 34.91/100
- National rank
- #5075
- State rank
- #383 of 826 in TX
Livability — Denton
- Score
- 88/100
- State rank
- #2
- US rank
- #210
Category grades
Schools grade is shown separately in the Schools card above.
Census & demographics
- County
- Denton County · 901,654 people
- City population
- 127,990
- Metro
- Dallas-Fort Worth-Arlington, TX
- Population (ZIP)
- 30,025
- Household income
- $88,967
- Rent vs Own
- Severe rent burden
- 1072.0
Population outlook (Denton County) Hauer SSP2
- Today (2025)
- 1,053,010 people
- By 2030
- 1,192,269 · +13.2%
- By 2040
- 1,472,920 · +39.9%
- By 2050
- 1,746,506 · +65.9%
- By 2075
- 2,358,497 · +124.0%
- By 2100
- 2,779,183 · +163.9%
Race, ethnicity, and origin ACS 2023
- Neighborhood character
- Diverse neighborhood (Simpson 0.64)
- Race & ethnicity
- White 51% Hispanic / Latino 29% Two or more races 15% Black 12% Asian 4% Native American 2%
- Hispanic origin (detail)
- Mexican 22% Puerto Rican 2%
- Common ancestry
- Romanian 2% Portuguese 2% Slovak 2%
- Foreign-born
- 13% · Canada, China, South Korea
- Languages at home
- 76% English-only · Spanish 18% Chinese 1% Other Asian/Pacific 1%
Political lean MEDSL · Denton
- 2024 margin
- R (+13.2) · D 42.7% · R 55.8% · Other 1.5%
- 2008→2024 swing
- +11.0pp toward D · 2008: -24.2pp · 2024: -13.2pp
- All cycles
- 2024: R+13.2 2020: R+8.1 2016: R+20.2 2012: R+31.7 2008: R+24.2
Not yet ingested
- Civics
- —
Market trends
- HPI YoY
- ▼ -64.64%
- Current HPI
- 244.3487
- Rent YoY
- ▲ 0.31%
- Metro
- Dallas-Fort Worth-Arlington, TX
- State GDP YoY
- ▲ 3.95%
- F500 in state
- 110
Industry mix (Fortune 500 HQ in TX)
| Industry | F500 HQs | Revenue |
|---|---|---|
| Energy | 16 | $1,198B |
|
||
| Technology | 5 | $198B |
|
||
| Engineering / Construction | 4 | $72B |
|
||
| Energy Services | 3 | $60B |
|
||
| Utilities | 3 | $41B |
|
||
| Healthcare | 2 | $330B |
|
||
Price history
+16.0% since first listed13 events — show timeline
- 2026-05-27 Listed $145,000 NTREIS
- 2026-04-30 Listing Removed — NTREIS
- 2026-03-29 Price Changed $109,900 NTREIS
- 2026-01-31 Price Changed $119,900 NTREIS
- 2026-01-29 Price Changed $129,900 NTREIS
- 2026-01-15 Price Changed $139,900 NTREIS
- 2026-01-15 Price Changed $1,399,000 NTREIS
- 2026-01-10 Listed $149,000 NTREIS
- 2025-12-31 Listing Removed — NTREIS
- 2025-11-09 Relisted — NTREIS
- 2025-10-30 Price Changed $150,000 NTREIS
- 2025-10-30 Listed $125,000 NTREIS
- 2025-09-26 Sold (Public Records) — Public Records
Property tax history
+5.6%/yrLatest (2025): $1,294 · +3.1% YoY. Source: county tax records.
Cash-flow waterfall
monthlySold comps — $/sqft
last 12 mo · ≤1 miLoading sold comps…