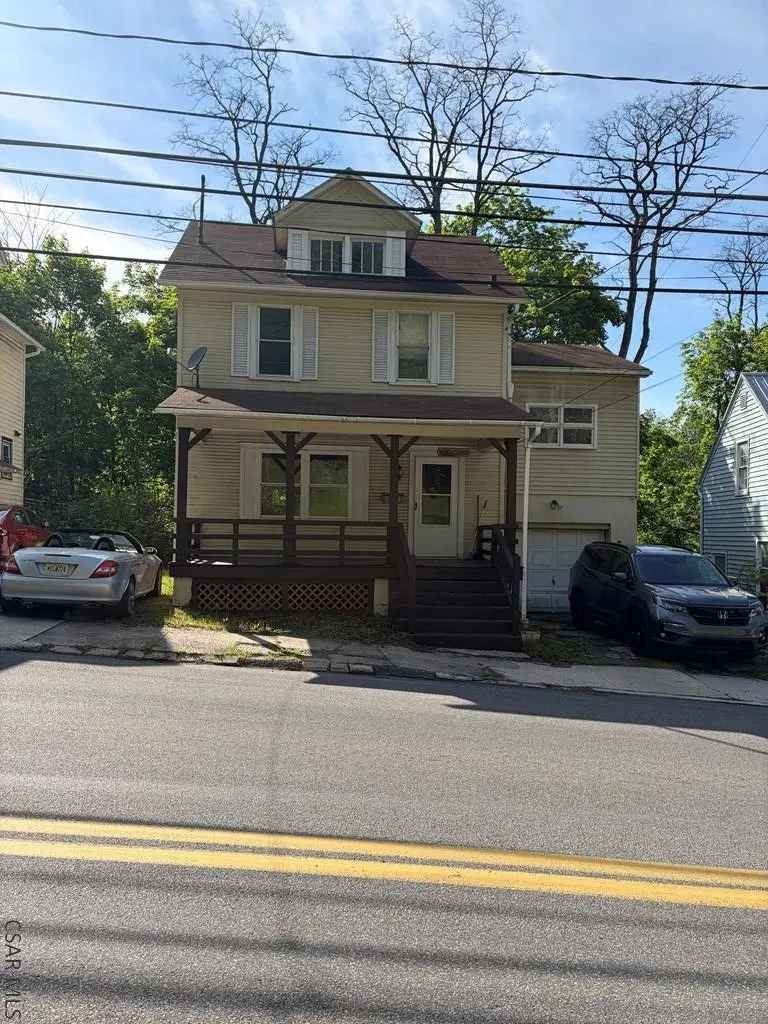
1224 Franklin St · Johnstown, PA
Flood risk 4/10 · Minor
- FEMA flood zone
- X (unshaded)
- Chance of flooding over 30 yrs
- 0.2%
- Est. flood insurance / yr
- $473 – $860
Fire risk 1/10 · Minimal
- Est. fire insurance / yr
- $511 – $949
Heat risk 3/10 · Minor
- Hot days now (above 93°F)
- 7 days/yr
- Hot days in 30 yrs
- 17 days/yr
Wind risk 2/10 · Minimal
- Chance of severe wind over 30 yrs
- —
Air-quality risk 2/10 · Minimal
- Unhealthy air days now
- 1 days/yr
- Unhealthy air days in 30 yrs
- 2 days/yr
Risk factors via First Street. Map © Google.
Why this score? — see what drove the B+ grade
The composite is a weighted blend of 9 inputs, each scored 0–100. Each bar is that input's sub-score; the figure is the points it added to the 100-point composite (weight × sub-score).
- Cash flow +30.0/30.0
- ARV discount +15.0/15.0
- 1% rule +10.0/10.0
- DSCR +10.0/10.0
- Livability +3.9/5.0
- Rent growth +2.5/5.0
- Condition / age +2.5/5.0
- Schools +1.3/10.0
- Appreciation +0.0/10.0
$74,900
🖨 Deal sheet 📄 Offer letter ✓ Due diligence
Listing remarks MLS
Very well maintained! Don't miss your chance to tour this 4 Bedroom, 1.5 Bath two story home in the 8th Ward! Living Room with custom beamed ceiling, paneled walls & laminate flooring. Separate Dining Room has a built-in corner cabinet & vinyl flooring. Custom cabinets & counters in the Kitchen and appliances included. Large Master Bedroom with two double closets & three additional Bedrooms and a Full Bath on the second floor. Finished Bonus Room on the third floor! Covered front porch. Deck & private backyard with firepit. Dual pane windows on first floor. One car attached garage & two driveways on each side of the home. Call today!
Key facts
- Large bonus room
- Separate dining room
- Large living room
Tags
Property features AI
Exterior
- Parking: 1-car garage; Concrete parking; Additional gravel parking
- Utilities: Public water; Public sewer; Sewer available
- Home design: Single-family residence; Two levels / 2 stories
- Construction: Vinyl siding; Shingle roof; Built on unfinished basement
- Exterior features: Covered patio/porch; Deck; Porch; Rectangular lot
Interior
- Kitchen: Microwave
- Flooring: Carpet; Vinyl
- Bathrooms: 1 full bathroom; 1 half bathroom
- Heating & cooling: Hot water heating (natural gas); Ceiling fan(s) for cooling
- Interior features: Beamed ceilings; Double-pane windows; Unfinished basement
Neighborhood map
What this means for you Summary
Snapshot
- This is a 4-bed/1.5-bath single-family listed at $75k.
Deal economics
- At list price, monthly cash flow is $340 ($4k/yr) — positive.
- The deal already cash-flows at list — no discount required.
- Meets the 1% rule at list price ($1k rent vs $75k).
- Recommended offer: $73k (3.0% below list) — sets the bar for market timing.
- Cap rate 11.7% vs local median 15.0% in Johnstown — below-typical yield; the buyer is paying a premium for something (appreciation thesis, condition, location) that the cap rate doesn't capture.
Location & tenants
- Location reads 77/100 on livability (#363 in PA, #3,168 nationally) — a middle-class / working-renter tenant base. Strengths: amenities A+, commute A+, cost of living A+; Watch: schools D+, crime F, employment F.
- Greater Johnstown SD (urban): math 9% / reading 25% proficiency, ranked #509 of 539 in PA (top 94%) — low school quality limits family demand, transient renter base, plan for 1-2y turnover; 80% free/reduced lunch — lower-income household profile, screen leases tightly.
- Market conditions: 92 active listings in the ZIP; 8 comparable units currently listed for rent nearby; rentals lingering (median 44d on market — plan ~5-8 weeks vacancy on turnover, expect pricing pressure); 62% of comp listings sitting > 30 days — soft ceiling on asking rent; 64 units permitted in Cambria County in 2024 (0 in 5+ unit buildings).
Forward outlook
- Local home prices are declining (-3.0%/yr); year-one equity from $518 of loan paydown is wiped out by about $2k of value loss. Plan a longer hold.
- Cambria County population projected at -28% by 2050 — secular population decline; favor cash flow + early exit over multi-decade hold.
- At projected returns (-3.0% appreciation + 3.0% rent growth), your $21k cash investment doubles in ~7 years — after that, you're playing with house money.
Negotiation context
- It's been on market 34 days — a 3% lower offer ($73k) is reasonable based on typical stale-listing flexibility.
- 3 sale attempts since 24y ago with the ask held roughly flat each time — persistent listings suggest the price (not the market) is what's stuck; bring a comps-based counter.
- Current owner paid $57k; 31% above their basis — modest negotiation headroom, anchor on the comps not their cost.
Risks & watch-outs
- Watch-outs: built in 1926 — expect roof / HVAC / electrical / plumbing capex.
Questions for the listing agent
- It's been on market 34 days. Have you received any prior offers? Is the seller open to a 3% concession, seller financing, or rate buy-down credit?
- Built in 1926 — when were the roof, HVAC, electrical panel, plumbing, and water heater last replaced?
- Is there a deadline driving the sale (1031 exchange, divorce, estate, relocation)? That informs how much negotiation room exists.
- Schools are D-rated, which usually means shorter tenancies and higher turnover. Who's the typical renter profile here, and what's been the actual vacancy rate?
- Crime grade is F in this area — have there been break-ins, vandalism, or insurance claims at this property in the last 3 years? What carrier currently insures it and at what premium?
- What's the average days-on-market for RENTAL listings here right now (not sales)? A rising rental-DOM trend means longer vacancies and softer asking-rent achievability than the comps imply.
- What's the recent tenant-quality profile in this submarket — average credit score on applications, eviction rate, late-payment / NSF rate, and stable-employment percentage? A property-management company in the area should have these aggregated.
- How much new for-sale + rental construction is in the pipeline within 1–3 miles? Heavy new supply typically softens prices + rents 12–24 months out; constrained supply supports both.
Investment metrics
- 1% rule
- 1.53% ✓
- Cap rate
- 11.74%
- Cash-on-cash
- 19.46%
- DSCR
- 1.87
- GRM
- 5.4
CMA / ARV
- ARV (on-the-fly)
- $130,974
- Comps found
- 12
Show comp detail 12 sales within ~0.75 mi
| Address | Dist | Beds/Ba | Sqft | Sold | Price | $/sf | Match |
|---|---|---|---|---|---|---|---|
| 111 Ross | 0.37mi | 3/1.5 (-1) | 1,512 (-4%) | 5mo | $125,000 | $83 | 66 |
| 108 Winton St | 0.45mi | 3/1.5 (-1) | 1,580 (+0%) | 9mo | $120,000 | $76 | 66 |
| 1087 Mckinley Ave | 0.33mi | 4/1.5 | 1,733 (+10%) | 4mo | $45,000 | $26 | 65 |
| 1138 Shaffer St | 0.16mi | 3/2.0 (-1) | 1,358 (-14%) | 6mo | $113,000 | $83 | 57 |
| 116 Warren St | 0.58mi | 3/2.0 (-1) | 1,580 (+0%) | 11mo | $138,900 | $88 | 57 |
| 145 Plainfield Ave | 0.47mi | 3/2.0 (-1) | 1,739 (+10%) | 1mo | $128,000 | $74 | 53 |
| 427 Swank St | 0.48mi | 3/2.0 (-1) | 1,772 (+12%) | 1mo | $165,000 | $93 | 49 |
| 501 Edward St | 0.75mi | 3/1.5 (-1) | 1,526 (-3%) | 7mo | $156,000 | $102 | 48 |
| 503 Christine Ct | 0.74mi | 3/2.0 (-1) | 1,456 (-8%) | 3mo | $100,000 | $69 | 43 |
| 1453 Franklin St | 0.51mi | 3/1.0 (-1) | 1,392 (-12%) | 8mo | $76,500 | $55 | 42 |
| 115 Plainfield Ave | 0.47mi | 3/1.0 (-1) | 1,801 (+14%) | 7mo | $122,000 | $68 | 42 |
| 438 Southmont Blvd | 0.69mi | 3/1.0 (-1) | 1,346 (-15%) | 8mo | $123,500 | $92 | 30 |
Match score weights: distance 35% · size 25% · config 20% · recency 20%. Top-matched comps best support the ARV.
Projected returns pro-forma
-3.0% appreciation · 3.0% rent growth · sell at horizon
- IRR
- 11.5%
- Equity multiple
- 1.46×
- Total profit
- $9,568
- Equity at exit
- $11,168
- IRR
- 20.5%
- Equity multiple
- 2.74×
- Total profit
- $36,413
- Equity at exit
- $6,476
Cash invested: $20,972 (down + closing). Projections, not guarantees.
Landlord ↔ Tenant lean methodology
- Overall (STATE)
- 62 Landlord-Friendly
- State Pennsylvania
- 62 Landlord-Friendly · EVEN
- County
- — inherits STATE
- City
- — inherits STATE
ZIP-level market 15905
- Home prices YoY
- -31.1%
- Active inventory
- 92
- Price-to-rent
- 5.4×
Monthly cashflow live
- Estimated rent
- $1,149 high interval (Pro) →
- Mortgage (P&I)
- −$393
- Tax from tax record
- −$143 /mo · $1,721/yr
- Insurance
- −$31
- HOA
- −$0
- Vacancy / Maint / Mgmt
- −$241
- Net cashflow
- $340
Break-even live
UW: 25.0% down · 7.5% · 30yr · 1.5% tax · 5.0% vac · 8.0% maint · 8.0% mgmt
Financing live
Cash to close
- Down payment
- $18,725
- Closing costs
- $2,247
- Reserves months
- —
- Total cash needed
- —
Loan-product check · same deal, 3 products live
Conventional
25% down · 7.5% · 30yr
- Down + closing
- —
- Monthly P&I
- —
- Monthly cashflow
- —
- DSCR
- —
- Eligible?
- —
Personal DTI + credit; lowest rate.
DSCR
20% down · 8.5% · 30yr
- Down + closing
- —
- Monthly P&I
- —
- Monthly cashflow
- —
- DSCR
- —
- Eligible?
- —
No personal income docs; deal must DSCR.
Hard money
10% down · 12.0% · 12mo
- Down + closing
- —
- Monthly P&I
- —
- Monthly cashflow
- —
- DSCR
- —
- Eligible?
- —
Short-term bridge; refi at stabilization.
Rent comps 8 comps
| Address | Beds | Baths | Sqft | Rent | $/sqft | DOM | Units | Dist |
|---|---|---|---|---|---|---|---|---|
| 129-131 Plainfield Ave Johnstown, PA | 3.0 | 1.0 | 1300 | $850 | $0.65 | 43d | 1 | 0.48mi |
| 522 Vickroy Ave Johnstown, PA | 3.0 | 1.0 | 1125 | $850 | $0.76 | 43d | 1 | 0.97mi |
| 550 Ferndale Ave Johnstown, PA | 3.0 | 1.0 | 1300 | $1,100 | $0.85 | 43d | 1 | 0.99mi |
| 553 Vickroy Ave #555 Johnstown, PA | 3.0 | 1.0 | 1300 | $985 | $0.76 | 43d | 1 | 1.01mi |
| 108 Dell St Johnstown, PA | 3.0 | 2.0 | 2250 | $1,749 | $0.78 | 14d | 1 | 1.10mi |
| 108 Dell St Johnstown, PA | 3.0 | 2.0 | 2250 | $1,749 | $0.78 | 7d | 1 | 1.10mi |
| 906 Lemon St Johnstown, PA | 3.0 | 1.0 | 1128 | $750 | $0.66 | 43d | 1 | 1.20mi |
| 212-214 Palliser St Johnstown, PA | 3.0 | 1.0 | 1400 | $1,150 | $0.82 | 23d | 1 | 1.40mi |
Listing history 21 events
-
2026-06-19days on market $74,900 Active 34 DOM
-
2026-06-18days on market $74,900 Active 33 DOM
-
2026-06-17days on market $74,900 Active 32 DOM
-
2026-06-16days on market $74,900 Active 31 DOM
-
2026-06-15days on market $74,900 Active 30 DOM
-
2026-06-14days on market $74,900 Active 28 DOM
-
2026-06-12days on market $74,900 Active 27 DOM
-
2026-06-09days on market $74,900 Active 24 DOM
-
2026-06-08days on market $74,900 Active 23 DOM
-
2026-06-07days on market $74,900 Active 22 DOM
-
2026-06-05days on market $74,900 Active 19 DOM
-
2026-06-02days on market $74,900 Active 17 DOM
-
2026-06-01days on market $74,900 Active 16 DOM
-
2026-05-31days on market $74,900 Active 15 DOM
-
2026-05-30days on market $74,900 Active 14 DOM
-
2026-05-14$74,900 Active
-
2021-08-06soldstatus $57,000 677-char remark
Show marketing remark (677 chars)
Very well maintained! Don't miss your chance to tour this 4 Bedroom, 1.5 Bath two story home in the 8th Ward! Living Room with custom beamed ceiling, paneled walls & laminate flooring. Separate Dining Room has a built-in corner cabinet & vinyl flooring. Custom cabinets & counters in the Kitchen and appliances included. Large Master Bedroom with two double closets & three additional Bedrooms and a Full Bath on the second floor. Finished Bonus Room on the third floor! Covered front porch. Deck & private backyard with firepit. Dual pane windows on first floor. One car attached garage & two driveways on each side of the home. Call today!
-
2003-01-24soldstatus $14,500 52-char remark
Show marketing remark (52 chars)
2 Story home near hospitals. Attic partial finished.
-
2003-01-24$23,900 52-char remark
Show marketing remark (52 chars)
2 Story home near hospitals. Attic partial finished.
-
2002-10-31$23,900
-
1996-11-01soldstatus $35,000
ⓘ Source: listings_history table (triggers on properties + properties_extension) + one-shot
backfill from property_details.listing_events for pre-trigger history.
Tax reassessment forecast PA · Partial reset (capped growth)
- Current annual tax
- $1,721 · $143/mo
- Projected year-2 tax
- $1,721 · $143/mo
- Expected delta
- $0/yr ($0/mo · -0.0%)
ⓘ Screening estimate from a state-policy table — verify with the county assessor before closing.
Climate risk First Street
- Flood 4/10 Moderate FEMA zone X (unshaded) · 20% chance over 30 yrs
- Wildfire 1/10 Low
- Heat 3/10 Moderate 7 d/yr ≥93°F today · 17 d/yr by 30 yrs out
- Wind 2/10 Low
- Air quality 2/10 Low 1 unhealthy d/yr today · 2 by 30 yrs out
Nearby sold comps map
Loading sold comps map…
Walkable amenities ~0.75 mi
Loading nearby amenities…
Taxation est. · year 1
- Rental income
- $13,784
- − Mortgage interest
- −$4,196
- − Property taxes
- −$1,721
- − Insurance
- −$374
- − Repairs & maintenance
- −$1,103
- − Management
- −$1,103
- − Depreciation
- −$2,179
- Taxable income
- $3,109
- Est. tax owed @ 24.0%
- −$746
- After-tax cash flow
- $3,334/yr
For passive investors: Depreciation is non-cash, so a rental often shows a tax loss while cash-flowing — sheltering income. Rental losses are passive: they offset passive income freely, and up to $25,000/yr can offset ordinary (W-2) income if you actively participate and your MAGI is under $100k (phasing out to $0 by $150k); unused losses carry forward. On sale, claimed depreciation is recaptured at up to 25%, and gains may owe capital-gains tax (a 1031 exchange can defer both). Figures are a year-1 estimate at your 24.0% rate — not tax advice; consult a CPA.
Schools (NCES district)
- District
- Greater Johnstown SD
- NCES district ID
- 4210950
- Math proficiency
- 9% ▼ -6.00%
- Reading proficiency
- 25% ▼ -6.00%
- Median HH income
- $27,890
- Composite
- 13.25/100
- National rank
- #9550
- State rank
- #509 of 539 in PA
Livability — Johnstown
- Score
- 77/100
- State rank
- #363
- US rank
- #3168
Category grades
Schools grade is shown separately in the Schools card above.
Census & demographics
- Census place
- Johnstown, PA
- County
- Cambria County · 30,791 people
- City population
- 30,791
- Metro
- Johnstown, PA
- Population (ZIP)
- 19,329
- Household income
- $69,212
- Rent vs Own
- Severe rent burden
- 359.0
Population outlook (Cambria County) Hauer SSP2
- Today (2025)
- 122,754 people
- By 2030
- 115,827 · -5.6%
- By 2040
- 101,309 · -17.5%
- By 2050
- 88,379 · -28.0%
- By 2075
- 65,237 · -46.9%
- By 2100
- 46,909 · -61.8%
Race, ethnicity, and origin ACS 2023
- Neighborhood character
- Predominantly White (92%)
- Race & ethnicity
- White 92% Two or more races 3% Hispanic / Latino 2% Black 2%
- Common ancestry
- Romanian 7% Scotch-Irish 1% Italian 1%
- Foreign-born
- 2% · Canada
- Languages at home
- 96% English-only · Spanish 1%
Political lean MEDSL · Cambria
- 2024 margin
- Solid R (+39.7) · D 29.8% · R 69.5%
- 2008→2024 swing
- -40.4pp toward R · 2008: 0.7pp · 2024: -39.7pp
- All cycles
- 2024: R+39.7 2020: R+37.3 2016: R+37.8 2012: R+17.8 2008: D+0.7
Not yet ingested
- Civics
- —
Market trends
- HPI YoY
- ▼ -64.18%
- Current HPI
- 142.5218
- Rent YoY
- —
- Metro
- Johnstown, PA
- State GDP YoY
- ▲ 1.68%
- F500 in state
- 34
Industry mix (Fortune 500 HQ in PA)
| Industry | F500 HQs | Revenue |
|---|---|---|
| Healthcare | 2 | $309B |
|
||
| Insurance | 2 | $27B |
|
||
| Telecommunications / Media | 1 | $124B |
|
||
| Industrial Distribution | 1 | $22B |
|
||
| Financial Services | 1 | $20B |
|
||
| Chemicals / Materials | 1 | $18B |
|
||
Price history
+114.0% since first listed6 events — show timeline
- 2026-05-14 Listed $74,900 CSMLS
- 2021-08-06 Sold (MLS) $57,000 CSMLS
- 2003-01-24 Listed $23,900 CSMLS
- 2003-01-24 Sold (MLS) $14,500 CSMLS
- 2002-10-31 Listed $23,900 CSMLS
- 1996-11-01 Sold (Public Records) $35,000 Public Records
Property tax history
+0.2%/yrLatest (2026): $1,721 · +0.0% YoY. Source: county tax records.
Cash-flow waterfall
monthlySold comps — $/sqft
last 12 mo · ≤1 miLoading sold comps…