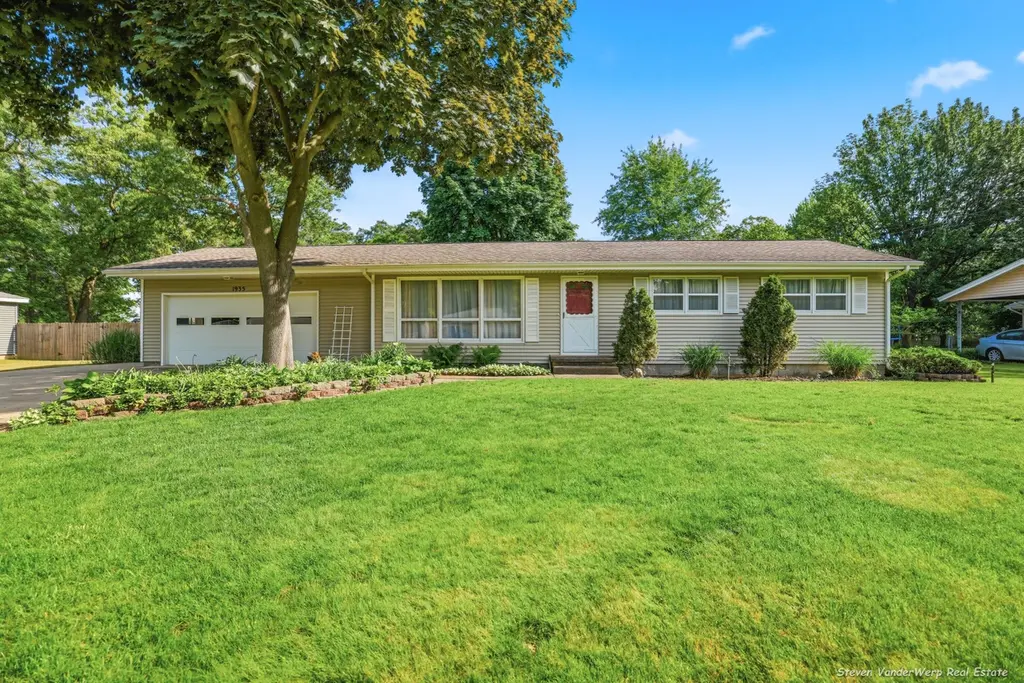
1935 Nielwood Dr · Muskegon, MI
Flood risk 1/10 · Minimal
- FEMA flood zone
- X (unshaded)
- Chance of flooding over 30 yrs
- 0.0%
- Est. flood insurance / yr
- $473 – $860
Fire risk 1/10 · Minimal
- Est. fire insurance / yr
- $784 – $1,456
Heat risk 1/10 · Minimal
- Hot days now (above 94°F)
- 7 days/yr
- Hot days in 30 yrs
- 15 days/yr
Wind risk 1/10 · Minimal
- Chance of severe wind over 30 yrs
- —
Air-quality risk 4/10 · Minor
- Unhealthy air days now
- 4 days/yr
- Unhealthy air days in 30 yrs
- 5 days/yr
Risk factors via First Street. Map © Google.
Why this score? — see what drove the D- grade
The composite is a weighted blend of 9 inputs, each scored 0–100. Each bar is that input's sub-score; the figure is the points it added to the 100-point composite (weight × sub-score).
- Appreciation +10.0/10.0
- Cash flow +9.5/30.0
- Livability +4.0/5.0
- Schools +3.2/10.0
- DSCR +2.7/10.0
- Rent growth +2.5/5.0
- Condition / age +2.5/5.0
- 1% rule +1.8/10.0
- ARV discount +0.0/15.0
$289,900
🖨 Deal sheet (PDF) 📄 Offer letter ✓ Due diligence
Listing remarks MLS
Very well, maintained 3 bedroom, 1.5 bath ranch situated on over a half-acre lot in a desirable neighborhood within the Reeths Puffer School District. This home offers comfortable single level living with a main level primary bedroom and convenient main level laundry. The spacious layout, attached 2 stall garage, and large deck provide plenty of room for everyday living, entertaining, and enjoying the expansive outdoor space. Conveniently located near schools, parks, shopping, and major roadways while still offering a peaceful setting. Move in ready and full of potential, don't miss this opportunity! Call today for your private showing!
Key facts
- Large deck
- Half-acre lot
- Main level laundry
Tags
Property features AI
Exterior
- Parking: Attached garage; Two garage spaces
- Utilities: Well water; Natural gas for water heater
- Home design: Ranch style single-family home; One-story (ranch)
- Construction: Built in 1965; Vinyl siding; Composition roof
- Exterior features: Lot of about 0.69 acres; Directions: River Rd, north on Nielsen and left on Nielwood
Interior
- Kitchen: Kitchen (appliances not specified)
- Bedrooms: Primary bedroom; Bedroom 2; Bedroom 3
- Bathrooms: One full bathroom; One half bathroom; Primary bathroom
- Heating & cooling: Forced air heating; Has cooling
- Interior features: Seven total rooms; Full basement
- Laundry & utility: Natural gas water heater
Neighborhood map
What this means for you Summary
Snapshot
- This is a 3-bed/1.5-bath single-family listed at $290k.
Deal economics
- At list price, monthly cash flow is $-204 ($-2k/yr) — negative.
- To cash-flow at today's rent, offer at most $254k (12.4% below list).
- To meet the 1% rule (rent ≥ 1% of price), the offer needs to be $198k (31.9% below list).
- Recommended offer: $198k (31.9% below list) — sets the bar for 1% rule.
Location & tenants
- Location reads 79/100 on livability (#92 in MI, #2,096 nationally) — a middle-class / working-renter tenant base. Strengths: amenities A+, commute A+, cost of living A+; Watch: crime F, employment F.
- Reeths-Puffer Schools (suburban): math 28% / reading 44% proficiency, ranked #254 of 540 in MI (top 47%) — families likely to look elsewhere, expect single-tenant / working-renter base with shorter leases.
- Zoned schools: Reethspuffer Elementary School (math 31% / reading 34%, grade F, #810 of 1,397 statewide, top 58%, 603 students, 65% FRL); Reethspuffer Middle School (math 29% / reading 54%, grade F, #192 of 493 statewide, top 39%, 542 students, 55% FRL); Reethspuffer High School (math 25% / reading 54%, grade F, #304 of 713 statewide, top 46%, 1,177 students, 53% FRL) — zoned schools average 58% FRL vs 40% district-wide (18 pts higher); higher-poverty schools than district average — tighter screening recommended.
- Market conditions: 144 active listings in the ZIP; 1 comparable units currently listed for rent nearby; 438 units permitted in Muskegon County in 2024 (115 in 5+ unit buildings).
Forward outlook
- In year one you build about $31k of equity ($2k loan paydown + $29k appreciation (10.0% local appreciation)).
- Muskegon County population projected to shrink 8% by 2050 — rents likely to lag national; underwrite the cash flow, not the appreciation.
- By year 2, paydown + projected appreciation supports a ~$50k cash-out refi (75% LTV) — recoverable capital for the next deal without selling this one.
Negotiation context
- Only 7 days on market — expect competitive offers; lowballing is unlikely to land.
- 3 sale attempts with the ask held roughly flat each time — persistent listings suggest the price (not the market) is what's stuck; bring a comps-based counter.
Questions for the listing agent
- What do current leases actually rent for vs. the listed asking? Can we see a recent rent roll and the last 12 months of T-12 income?
- Built in 1965 — when were the roof, HVAC, electrical panel, plumbing, and water heater last replaced?
- Is there a deadline driving the sale (1031 exchange, divorce, estate, relocation)? That informs how much negotiation room exists.
- Schools are D-rated, which usually means shorter tenancies and higher turnover. Who's the typical renter profile here, and what's been the actual vacancy rate?
- Crime grade is F in this area — have there been break-ins, vandalism, or insurance claims at this property in the last 3 years? What carrier currently insures it and at what premium?
- The area grade is low — what's the realistic commute time and amenity access for the typical tenant pool here? Any planned neighborhood developments (good or bad) we should know about?
- What's the average days-on-market for RENTAL listings here right now (not sales)? A rising rental-DOM trend means longer vacancies and softer asking-rent achievability than the comps imply.
- What's the recent tenant-quality profile in this submarket — average credit score on applications, eviction rate, late-payment / NSF rate, and stable-employment percentage? A property-management company in the area should have these aggregated.
- How much new for-sale + rental construction is in the pipeline within 1–3 miles? Heavy new supply typically softens prices + rents 12–24 months out; constrained supply supports both.
Investment metrics
- 1% rule
- 0.68% ✗
- Cap rate
- 5.45%
- Cash-on-cash
- -3.02%
- DSCR
- 0.87
- GRM
- 12.2
CMA / ARV
- ARV (on-the-fly)
- $239,568
- Comps found
- 12
Show comp detail 12 sales within ~0.75 mi
| Address | Dist | Beds/Ba | Sqft | Sold | Price | $/sf | Match |
|---|---|---|---|---|---|---|---|
| 1920 Nielwood Dr | 0.04mi | 3/1.0 | 1,008 (-9%) | 3mo | $274,900 | $273 | 79 |
| 1960 Nielwood Dr | 0.05mi | 3/1.5 | 1,200 (+9%) | 6mo | $175,000 | $146 | 78 |
| 2624 Holton Rd | 0.41mi | 4/2.0 (+1) | 1,098 (-0%) | 5mo | $237,000 | $216 | 69 |
| 2341 Pillon Rd | 0.28mi | 3/1.0 | 960 (-13%) | 4mo | $210,000 | $219 | 60 |
| 2150 E River Rd | 0.27mi | 3/1.0 | 960 (-13%) | 9mo | $235,000 | $245 | 56 |
| 2190 Riegler Rd | 0.37mi | 3/2.0 | 1,196 (+8%) | 14mo | $260,000 | $217 | 55 |
| 1877 Queens Ct | 0.69mi | 3/2.0 | 1,092 (-1%) | 13mo | $255,000 | $234 | 53 |
| 2198 Riegler Rd | 0.38mi | 3/2.0 | 1,196 (+8%) | 17mo | $250,000 | $209 | 52 |
| 2337 Pillon Rd | 0.32mi | 3/1.0 | 960 (-13%) | 14mo | $206,000 | $215 | 50 |
| 1740 Brandel Dr | 0.39mi | 4/2.0 (+1) | 1,232 (+12%) | 9mo | $349,900 | $284 | 48 |
| 2818 Holton Rd | 0.71mi | 3/1.0 | 1,089 (-1%) | 20mo | $188,000 | $173 | 46 |
| 2806 Holton Rd | 0.68mi | 3/1.0 | 1,248 (+13%) | 18mo | $145,000 | $116 | 30 |
Match score weights: distance 35% · size 25% · config 20% · recency 20%. Top-matched comps best support the ARV.
Projected returns pro-forma
10.0% appreciation · 3.0% rent growth · sell at horizon
- IRR
- 22.1%
- Equity multiple
- 2.78×
- Total profit
- $144,769
- Equity at exit
- $261,165
- IRR
- 19.9%
- Equity multiple
- 6.38×
- Total profit
- $436,312
- Equity at exit
- $563,212
Cash invested: $81,172 (down + closing). Projections, not guarantees.
Landlord ↔ Tenant lean methodology
- Overall (STATE)
- 62 Landlord-Friendly
- State Michigan
- 62 Landlord-Friendly · EVEN
- County
- — inherits STATE
- City
- — inherits STATE
ZIP-level market 49445
- Home prices YoY
- 7.2%
- Active inventory
- 144
- Price-to-rent
- 12.2×
Monthly cashflow live
- Estimated rent
- $1,975 medium interval (Pro) →
- Mortgage (P&I)
- −$1,520
- Tax from tax record
- −$123 /mo · $1,480/yr
- Insurance
- −$121
- HOA
- −$0
- Vacancy / Maint / Mgmt
- −$415
- Net cashflow
- $-204
Break-even live
Sensitivity live
| Price | -10% $-40 | -5% $-122 | +0% $-204 | +5% $-286 | +10% $-368 |
|---|---|---|---|---|---|
| Rent | -10% $-360 | -5% $-282 | +0% $-204 | +5% $-126 | +10% $-48 |
| Rate | -1.0pp $-58 | -0.5pp $-130 | base $-204 | +0.5pp $-279 | +1.0pp $-356 |
UW: 25.0% down · 7.5% · 30yr · 1.5% tax · 5.0% vac · 8.0% maint · 8.0% mgmt
Financing live
Cash to close
- Down payment
- $72,475
- Closing costs
- $8,697
- Reserves months
- —
- Total cash needed
- —
Loan-product check · same deal, 3 products live
Conventional
25% down · 7.5% · 30yr
- Down + closing
- —
- Monthly P&I
- —
- Monthly cashflow
- —
- DSCR
- —
- Eligible?
- —
Personal DTI + credit; lowest rate.
DSCR
20% down · 8.5% · 30yr
- Down + closing
- —
- Monthly P&I
- —
- Monthly cashflow
- —
- DSCR
- —
- Eligible?
- —
No personal income docs; deal must DSCR.
Hard money
10% down · 12.0% · 12mo
- Down + closing
- —
- Monthly P&I
- —
- Monthly cashflow
- —
- DSCR
- —
- Eligible?
- —
Short-term bridge; refi at stabilization.
Rent comps 1 comps
| Address | Beds | Baths | Sqft | Rent | $/sqft | DOM | Units | Dist |
|---|---|---|---|---|---|---|---|---|
| 1990 Pappas Rd Muskegon, MI | 3.0 | 2.0 | 1468 | $1,975 | $1.35 | 23d | 1 | 1.23mi |
Listing history 7 events
-
2026-06-17status $289,900 Pending 7 DOM
-
2026-06-17days on market $289,900 Active 7 DOM
-
2026-06-16days on market $289,900 Active 6 DOM
-
2026-06-15days on market $289,900 Active 5 DOM
-
2026-06-14days on market $289,900 Active 3 DOM
-
2026-06-13remarks 648-char remark
-
2026-06-13$289,900 Active 2 DOM
ⓘ Source: listings_history table (triggers on properties + properties_extension) + one-shot
backfill from property_details.listing_events for pre-trigger history.
Tax reassessment forecast MI · Partial reset (capped growth)
- Current annual tax
- $1,480 · $123/mo
- Projected year-2 tax
- $2,972 · $248/mo
- Expected delta
- +$1,492/yr (+$124/mo · 100.8%)
ⓘ Screening estimate from a state-policy table — verify with the county assessor before closing.
Climate risk First Street
- Flood 1/10 Low FEMA zone X (unshaded) · 0% chance over 30 yrs
- Wildfire 1/10 Low
- Heat 1/10 Low 7 d/yr ≥94°F today · 15 d/yr by 30 yrs out
- Wind 1/10 Low
- Air quality 4/10 Moderate 4 unhealthy d/yr today · 5 by 30 yrs out
Nearby sold comps map
Loading sold comps map…
Walkable amenities ~0.75 mi
Loading nearby amenities…
Taxation est. · year 1
- Rental income
- $23,700
- − Mortgage interest
- −$16,239
- − Property taxes
- −$1,480
- − Insurance
- −$1,450
- − Repairs & maintenance
- −$1,896
- − Management
- −$1,896
- − Depreciation
- −$8,433
- Taxable loss
- −$7,694
- Est. tax savings @ 24.0%
- +$1,846
- After-tax cash flow
- $-603/yr
For passive investors: Depreciation is non-cash, so a rental often shows a tax loss while cash-flowing — sheltering income. Rental losses are passive: they offset passive income freely, and up to $25,000/yr can offset ordinary (W-2) income if you actively participate and your MAGI is under $100k (phasing out to $0 by $150k); unused losses carry forward. On sale, claimed depreciation is recaptured at up to 25%, and gains may owe capital-gains tax (a 1031 exchange can defer both). Figures are a year-1 estimate at your 24.0% rate — not tax advice; consult a CPA.
Schools (NCES district)
- District
- Reeths-Puffer Schools
- NCES district ID
- 2629540
- Math proficiency
- 28% ▼ -9.00%
- Reading proficiency
- 44% ▼ -4.00%
- Median HH income
- $55,223
- Composite
- 31.62/100
- National rank
- #5942
- State rank
- #254 of 540 in MI
Livability — Muskegon
- Score
- 79/100
- State rank
- #92
- US rank
- #2096
Category grades
Schools grade is shown separately in the Schools card above.
Census & demographics
- City population
- 44,766
- Population (ZIP)
- 21,090
Population outlook (Muskegon County) Hauer SSP2
- Today (2025)
- 174,032 people
- By 2030
- 173,365 · -0.4%
- By 2040
- 168,877 · -3.0%
- By 2050
- 160,306 · -7.9%
- By 2075
- 134,426 · -22.8%
- By 2100
- 98,836 · -43.2%
Race, ethnicity, and origin ACS 2023
- Neighborhood character
- Predominantly White (86%)
- Race & ethnicity
- White 86% Two or more races 8% Hispanic / Latino 6% Black 2%
- Hispanic origin (detail)
- Mexican 5%
- Common ancestry
- Iranian 10% Romanian 4% Italian 3%
- Foreign-born
- 2% · Canada
- Languages at home
- 96% English-only · Spanish 4%
Political lean MEDSL · Muskegon
- 2024 margin
- Toss-up / Even · D 48.4% · R 50.2% · Other 1.5%
- 2008→2024 swing
- -31.1pp toward R · 2008: 29.3pp · 2024: -1.8pp
- All cycles
- 2024: R+1.8 2020: D+0.6 2016: D+0.9 2012: D+17.8 2008: D+29.3
Not yet ingested
- Civics
- —
Market trends
- HPI YoY
- ▲ 40.82%
- Current HPI
- 605.31
- Rent YoY
- —
- Metro
- —
- State GDP YoY
- ▲ 1.37%
- F500 in state
- 28
Industry mix (Fortune 500 HQ in MI)
| Industry | F500 HQs | Revenue |
|---|---|---|
| Automotive Parts | 3 | $48B |
|
||
| Automotive | 2 | $372B |
|
||
| Chemicals | 1 | $45B |
|
||
| Automotive Retail | 1 | $29B |
|
||
| Healthcare / Medical Devices | 1 | $23B |
|
||
| Automotive Technology | 1 | $20B |
|
||
Price history
+0.0% since first listed3 events — show timeline
- 2026-06-10 Listed $289,900 REALCOMP
- 2026-06-10 Listed $289,900 MiRealSource-MiMLS
- 2026-06-10 Listed $289,900 SW Michigan MLS
Property tax history
+2.6%/yrLatest (2025): $1,480 · +2.5% YoY. Source: county tax records.
Cash-flow waterfall
monthlySold comps — $/sqft
last 12 mo · ≤1 miLoading sold comps…