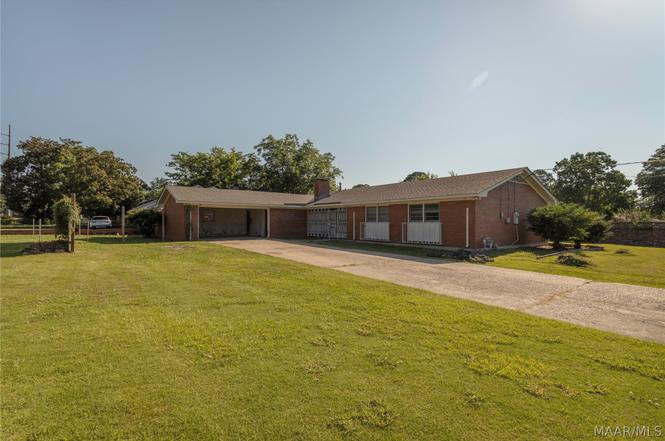
3393 Carter Hill Rd · Montgomery, AL
Flood risk 1/10 · Minimal
- FEMA flood zone
- X (unshaded)
- Chance of flooding over 30 yrs
- 0.0%
- Est. flood insurance / yr
- $507 – $1,088
Fire risk 1/10 · Minimal
- Est. fire insurance / yr
- $916 – $1,700
Heat risk 8/10 · Major
- Hot days now (above 108°F)
- 7 days/yr
- Hot days in 30 yrs
- 20 days/yr
Wind risk 8/10 · Major
- Chance of severe wind over 30 yrs
- 80.0%
Air-quality risk 2/10 · Minimal
- Unhealthy air days now
- 1 days/yr
- Unhealthy air days in 30 yrs
- 1 days/yr
Risk factors via First Street. Map © Google.
Why this score? — see what drove the C grade
The composite is a weighted blend of 9 inputs, each scored 0–100. Each bar is that input's sub-score; the figure is the points it added to the 100-point composite (weight × sub-score).
- Cash flow +20.9/30.0
- ARV discount +15.0/15.0
- DSCR +6.7/10.0
- 1% rule +5.2/10.0
- Livability +3.2/5.0
- Rent growth +2.5/5.0
- Condition / age +2.5/5.0
- Schools +1.7/10.0
- Appreciation +0.0/10.0
$149,000
🖨 Deal sheet 📄 Offer letter ✓ Due diligence
Listing remarks MLS
Great investment opportunity! Large outdoor entertaining area, brick fencing, ironwork on the front, grand foyer, central hvac, all brick exterior, garage area, concrete driveway, and so much more. This home needs updating, but is move-in ready!
Key facts
- Brick fireplace
- Separate den
- Brand-new roof
Tags
Property features AI
Exterior
- Parking: Attached 2-car garage; Driveway
- Utilities: Electricity available; Public water; Community/Co-op sewer
- Home design: Single-story; Brick construction; Slab foundation; Public road frontage; Paved road access; Level topography; City lot (approx. 170 x 110)
- Construction: Brick exterior; Built (year per public records)
- Exterior features: Covered porch; Patio
Interior
- Kitchen: Dishwasher; Electric cooktop; Electric oven
- Bedrooms: Bedrooms located on the first floor
- Flooring: Carpet; Vinyl
- Bathrooms: 2 full bathrooms
- Heating & cooling: Central heating (electric); Central air conditioning (electric)
- Interior features: One fireplace; Living/Dining room configuration
- Laundry & utility: Washer hookup; Dryer hookup; Electric water heater
Neighborhood map
What this means for you Summary
Snapshot
- This is a 3-bed/2.0-bath single-family listed at $149k.
Deal economics
- At list price, monthly cash flow is $208 ($2k/yr) — positive.
- The deal already cash-flows at list — no discount required.
- Meets the 1% rule at list price ($2k rent vs $149k).
- Cap rate 8.0% vs local median 6.0% in Montgomery — top-decile yield for the area; either an underpriced asset or a hidden risk that comps aren't pricing in. Stress-test before assuming the spread holds.
Location & tenants
- Location reads 65/100 on livability (#138 in AL) — a middle-class / working-renter tenant base. Strengths: cost of living A+, housing A+; Watch: schools C-, employment D, crime F.
- Montgomery County (urban): math 9% / reading 31% proficiency, ranked #106 of 129 in AL (top 82%) — low school quality limits family demand, transient renter base, plan for 1-2y turnover; 70% free/reduced lunch — lower-income household profile, screen leases tightly.
- Market conditions: 110 active listings in the ZIP; 34 comparable units currently listed for rent nearby; rentals lingering (median 44d on market — plan ~5-8 weeks vacancy on turnover, expect pricing pressure); 53% of comp listings sitting > 30 days — soft ceiling on asking rent; 460 units permitted in Montgomery County in 2024 (37 in 5+ unit buildings).
Forward outlook
- Local home prices are declining (-3.0%/yr); year-one equity from $1k of loan paydown is wiped out by about $4k of value loss. Plan a longer hold.
- Montgomery County population projected to shrink 8% by 2050 — rents likely to lag national; underwrite the cash flow, not the appreciation.
Negotiation context
- Only 3 days on market — expect competitive offers; lowballing is unlikely to land.
- 2 sale attempts since 5y ago with the ask held roughly flat each time — persistent listings suggest the price (not the market) is what's stuck; bring a comps-based counter.
- Current owner paid $101k; 47% above their basis — modest negotiation headroom, anchor on the comps not their cost.
Risks & watch-outs
- Climate carrying-cost: severe wind risk, 80% chance of damaging wind over 30y; extreme-heat days projected 7→20/yr by 2055 (HVAC capex compounding) — expect insurance premiums to compound above CPI over the hold.
Questions for the listing agent
- Built in 1966 — when were the roof, HVAC, electrical panel, plumbing, and water heater last replaced?
- Is there a deadline driving the sale (1031 exchange, divorce, estate, relocation)? That informs how much negotiation room exists.
- Crime grade is F in this area — have there been break-ins, vandalism, or insurance claims at this property in the last 3 years? What carrier currently insures it and at what premium?
- What's the average days-on-market for RENTAL listings here right now (not sales)? A rising rental-DOM trend means longer vacancies and softer asking-rent achievability than the comps imply.
- What's the recent tenant-quality profile in this submarket — average credit score on applications, eviction rate, late-payment / NSF rate, and stable-employment percentage? A property-management company in the area should have these aggregated.
- How much new for-sale + rental construction is in the pipeline within 1–3 miles? Heavy new supply typically softens prices + rents 12–24 months out; constrained supply supports both.
Investment metrics
- 1% rule
- 1.02% ✓
- Cap rate
- 7.97%
- Cash-on-cash
- 5.98%
- DSCR
- 1.27
- GRM
- 8.2
CMA / ARV
- ARV (on-the-fly)
- $187,866
- Comps found
- 12
Show comp detail 12 sales within ~0.75 mi
| Address | Dist | Beds/Ba | Sqft | Sold | Price | $/sf | Match |
|---|---|---|---|---|---|---|---|
| 3138 Fernway Dr | 0.21mi | 3/2.0 | 1,914 (-0%) | 5mo | $150,000 | $78 | 85 |
| 3406 Sommerville Dr | 0.21mi | 3/2.0 | 1,728 (-10%) | 2mo | $175,000 | $101 | 72 |
| 3469 Warrenton Rd | 0.52mi | 3/2.5 | 1,957 (+2%) | 3mo | $265,000 | $135 | 68 |
| 2630 Clement Curv | 0.73mi | 3/2.0 | 1,925 (+0%) | 4mo | $123,000 | $64 | 62 |
| 3126 Fernway Dr | 0.22mi | 3/2.0 | 1,638 (-15%) | 8mo | $160,221 | $98 | 59 |
| 2948 Canterbury Dr | 0.43mi | 3/2.0 | 1,702 (-11%) | 4mo | $155,000 | $91 | 58 |
| 2614 Fisk Rd | 0.62mi | 3/2.0 | 1,772 (-8%) | 3mo | $139,900 | $79 | 56 |
| 3715 Dresden Ct | 0.52mi | 3/2.5 | 2,097 (+9%) | 4mo | $139,500 | $67 | 55 |
| 2958 Old Farm Rd | 0.57mi | 2/2.0 (-1) | 1,712 (-11%) | 6mo | $159,000 | $93 | 45 |
| 2445 Winchester Rd | 0.46mi | 4/2.0 (+1) | 2,183 (+14%) | 7mo | $230,000 | $105 | 45 |
| 3347 Dresden Dr | 0.51mi | 4/2.0 (+1) | 2,148 (+12%) | 8mo | $245,000 | $114 | 45 |
| 1923 Vaughn Ln | 0.73mi | 3/2.0 | 2,192 (+14%) | 1mo | $256,000 | $117 | 41 |
Match score weights: distance 35% · size 25% · config 20% · recency 20%. Top-matched comps best support the ARV.
Projected returns pro-forma
-3.0% appreciation · 3.0% rent growth · sell at horizon
- IRR
- -7.1%
- Equity multiple
- 0.74×
- Total profit
- $-10,895
- Equity at exit
- $22,216
- IRR
- 2.5%
- Equity multiple
- 1.18×
- Total profit
- $7,569
- Equity at exit
- $12,883
Cash invested: $41,720 (down + closing). Projections, not guarantees.
Landlord ↔ Tenant lean methodology
- Overall (STATE)
- 90 Strongly Landlord-Friendly
- State Alabama
- 90 Strongly Landlord-Friendly · R+15
- County
- — inherits STATE
- City
- — inherits STATE
ZIP-level market 36111
- Home prices YoY
- -6.9%
- Active inventory
- 110
- Price-to-rent
- 8.2×
Monthly cashflow live
- Estimated rent
- $1,517 high interval (Pro) →
- Mortgage (P&I)
- −$781
- Tax from tax record
- −$147 /mo · $1,762/yr
- Insurance
- −$62
- HOA
- −$0
- Vacancy / Maint / Mgmt
- −$319
- Net cashflow
- $208
Break-even live
UW: 25.0% down · 7.5% · 30yr · 1.5% tax · 5.0% vac · 8.0% maint · 8.0% mgmt
Financing live
Cash to close
- Down payment
- $37,250
- Closing costs
- $4,470
- Reserves months
- —
- Total cash needed
- —
Loan-product check · same deal, 3 products live
Conventional
25% down · 7.5% · 30yr
- Down + closing
- —
- Monthly P&I
- —
- Monthly cashflow
- —
- DSCR
- —
- Eligible?
- —
Personal DTI + credit; lowest rate.
DSCR
20% down · 8.5% · 30yr
- Down + closing
- —
- Monthly P&I
- —
- Monthly cashflow
- —
- DSCR
- —
- Eligible?
- —
No personal income docs; deal must DSCR.
Hard money
10% down · 12.0% · 12mo
- Down + closing
- —
- Monthly P&I
- —
- Monthly cashflow
- —
- DSCR
- —
- Eligible?
- —
Short-term bridge; refi at stabilization.
Rent comps 34 comps
| Address | Beds | Baths | Sqft | Rent | $/sqft | DOM | Units | Dist |
|---|---|---|---|---|---|---|---|---|
| 2430 Price St Montgomery, AL | 2.0 | 1.5 | 1275 | $1,175 | $0.92 | 13d | 1 | 0.35mi |
| 2441 Price St Unit D Montgomery, AL | 3.0 | 2.0 | 1264 | $900 | $0.71 | 20d | 1 | 0.37mi |
| 2440 Price St Unit C Montgomery, AL | 3.0 | 2.0 | 1800 | $1,050 | $0.58 | 43d | 1 | 0.38mi |
| 3543 Carter Hill Rd Montgomery, AL | 1.0–3.0 | 1.0–2.0 | 1120 | $925 | $0.83 | 13d | 16 | 0.42mi |
| 2983 Old Farm Rd Montgomery, AL | 3.0 | 2.0 | 2000 | $1,725 | $0.86 | 20d | 1 | 0.47mi |
| 2929 Canterbury Ct Unit 1043474P Montgomery, AL | 4.0 | 2.5 | 2464 | $2,667 | $1.08 | 20d | 1 | 0.47mi |
| 3352 Ridgefield Dr Montgomery, AL | 3.0 | 2.0 | 1932 | $1,761 | $0.91 | 20d | 1 | 0.48mi |
| 2988 Old Farm Rd Montgomery, AL | 3.0 | 2.5 | 2314 | $1,900 | $0.82 | 43d | 1 | 0.48mi |
| 1814 Sylvan Dr Montgomery, AL | 3.0 | 2.0 | 1785 | $1,400 | $0.78 | 20d | 1 | 0.68mi |
| 2656 Fisk Rd Montgomery, AL | 4.0 | 2.0 | 1584 | $1,400 | $0.88 | 43d | 1 | 0.78mi |
| 2651 Clement Curv Montgomery, AL | 3.0 | 2.0 | 1402 | $1,550 | $1.11 | 20d | 1 | 0.78mi |
| 3050 Bryn Mawr Rd Montgomery, AL | 3.0 | 2.0 | 2290 | $1,500 | $0.66 | 43d | 1 | 0.84mi |
| 1839 Robison Hill Rd Montgomery, AL | 4.0 | 2.0 | 1370 | $1,550 | $1.13 | 20d | 1 | 0.85mi |
| 1842 Gillespie Dr Montgomery, AL | 4.0 | 2.0 | 1620 | $1,650 | $1.02 | 43d | 1 | 0.94mi |
| 1738 Fairforest Dr Montgomery, AL | 3.0 | 2.0 | 2166 | $1,895 | $0.87 | 43d | 1 | 0.94mi |
| 1827 Pinecrest Dr Montgomery, AL | 4.0 | 3.0 | 1893 | $1,550 | $0.82 | 13d | 1 | 0.96mi |
| 3001 Sutton Dr Montgomery, AL | 3.0 | 3.0 | 2298 | $1,750 | $0.76 | 43d | 1 | 1.02mi |
| 3050 Sutton Dr Montgomery, AL | 2.0 | 2.0 | 1719 | $1,450 | $0.84 | 20d | 1 | 1.04mi |
| 1229 Karen Rd Montgomery, AL | 4.0 | 2.0 | 1344 | $1,590 | $1.18 | 43d | 1 | 1.18mi |
| 2053 Gorgas St Montgomery, AL | 3.0 | 1.0 | 1955 | $1,200 | $0.61 | 20d | 1 | 1.18mi |
| 1216 Karen Rd Montgomery, AL | 3.0 | 2.0 | 1620 | $1,350 | $0.83 | 13d | 1 | 1.20mi |
| 2014 Commodore St Montgomery, AL | 3.0 | 2.0 | 1613 | $1,450 | $0.90 | 13d | 1 | 1.21mi |
| 2045 Bullard St Unit 1043526P Montgomery, AL | 3.0 | 2.0 | 1797 | $2,198 | $1.22 | 43d | 1 | 1.26mi |
| 1516 Charleton Dr Montgomery, AL | 3.0 | 2.0 | 1895 | $1,650 | $0.87 | 43d | 1 | 1.26mi |
| 2198 Beverly Dr Montgomery, AL | 4.0 | 2.5 | 2476 | $1,495 | $0.60 | 43d | 1 | 1.33mi |
| 2226 Carter Hill Rd Montgomery, AL | 2.0 | 1.0 | 1506 | $905 | $0.60 | 43d | 1 | 1.35mi |
| 1216 Beechdale Rd Montgomery, AL | 4.0 | 2.0 | 1495 | $1,325 | $0.89 | 43d | 1 | 1.38mi |
| 1450 Crenshaw Pl S Montgomery, AL | 3.0 | 2.0 | 1641 | $1,775 | $1.08 | 43d | 1 | 1.38mi |
| 1117 Karen Rd Montgomery, AL | 3.0 | 1.0 | 1308 | $1,195 | $0.91 | 43d | 1 | 1.44mi |
| 4243 Vaughn Rd Unit 1043807P Montgomery, AL | 4.0 | 2.0 | 1496 | $3,360 | $2.25 | 43d | 1 | 1.45mi |
| 3359 Bedford Ln Montgomery, AL | 4.0 | 2.0 | 1786 | $1,600 | $0.90 | 13d | 1 | 1.46mi |
| 2619 Brantford Pl Montgomery, AL | 3.0 | 2.0 | 1323 | $1,200 | $0.91 | 43d | 1 | 1.46mi |
| 1425 Blairwood Montgomery, AL | 3.0 | 2.0 | 1700 | $1,850 | $1.09 | 13d | 1 | 1.46mi |
| 1437 Beaumont Dr Montgomery, AL | 4.0 | 2.0 | 2029 | $1,500 | $0.74 | 43d | 1 | 1.46mi |
Listing history 4 events
-
2026-06-18days on market $149,000 Active 3 DOM
-
2026-06-17days on market $149,000 Active 2 DOM
-
2026-06-15remarks 629-char remark
-
2026-06-15$149,000 Active 1 DOM
ⓘ Source: listings_history table (triggers on properties + properties_extension) + one-shot
backfill from property_details.listing_events for pre-trigger history.
Tax reassessment forecast AL · Resets to sale price
- Current annual tax
- $1,762 · $147/mo
- Projected year-2 tax
- $1,762 · $147/mo
- Expected delta
- $0/yr ($0/mo · 0.0%)
ⓘ Screening estimate from a state-policy table — verify with the county assessor before closing.
Climate risk First Street
- Flood 1/10 Low FEMA zone X (unshaded) · 0% chance over 30 yrs
- Wildfire 1/10 Low
- Heat 8/10 Severe 7 d/yr ≥108°F today · 20 d/yr by 30 yrs out
- Wind 8/10 Severe 80% chance of damaging wind over 30 yrs
- Air quality 2/10 Low 1 unhealthy d/yr today · 1 by 30 yrs out
Nearby sold comps map
Loading sold comps map…
Walkable amenities ~0.75 mi
Loading nearby amenities…
Taxation est. · year 1
- Rental income
- $18,202
- − Mortgage interest
- −$8,346
- − Property taxes
- −$1,762
- − Insurance
- −$745
- − Repairs & maintenance
- −$1,456
- − Management
- −$1,456
- − Depreciation
- −$4,335
- Taxable income
- $102
- Est. tax owed @ 24.0%
- −$25
- After-tax cash flow
- $2,472/yr
For passive investors: Depreciation is non-cash, so a rental often shows a tax loss while cash-flowing — sheltering income. Rental losses are passive: they offset passive income freely, and up to $25,000/yr can offset ordinary (W-2) income if you actively participate and your MAGI is under $100k (phasing out to $0 by $150k); unused losses carry forward. On sale, claimed depreciation is recaptured at up to 25%, and gains may owe capital-gains tax (a 1031 exchange can defer both). Figures are a year-1 estimate at your 24.0% rate — not tax advice; consult a CPA.
Schools (NCES district)
- District
- Montgomery County
- NCES district ID
- 0102430
- Math proficiency
- 9% ▼ -21.00%
- Reading proficiency
- 31% ▼ -1.00%
- Median HH income
- $43,902
- Composite
- 17.24/100
- National rank
- #9093
- State rank
- #106 of 129 in AL
Livability — Montgomery
- Score
- 65/100
- State rank
- #138
- US rank
- #13416
Category grades
Schools grade is shown separately in the Schools card above.
Census & demographics
- Census place
- Montgomery, AL
- City population
- 175,913
- Population (ZIP)
- 12,196
Population outlook (Montgomery County) Hauer SSP2
- Today (2025)
- 224,008 people
- By 2030
- 221,460 · -1.1%
- By 2040
- 214,179 · -4.4%
- By 2050
- 204,912 · -8.5%
- By 2075
- 177,821 · -20.6%
- By 2100
- 145,134 · -35.2%
Race, ethnicity, and origin ACS 2023
- Neighborhood character
- Majority Black (60%)
- Race & ethnicity
- Black 60% White 34% Asian 3% Hispanic / Latino 2% Two or more races 2%
- Common ancestry
- Slovak 2% Serbian 2% Italian 1%
- Foreign-born
- 3% · China, Canada
- Languages at home
- 95% English-only · Other Indo-European 2% Spanish 1% Chinese 1%
Political lean MEDSL · Montgomery
- 2024 margin
- Solid D (+30.7) · D 64.8% · R 34.1% · Other 1.1%
- 2008→2024 swing
- +11.5pp toward D · 2008: 19.2pp · 2024: 30.7pp
- All cycles
- 2024: D+30.7 2020: D+31.5 2016: D+26.2 2012: D+24.3 2008: D+19.2
Not yet ingested
- Civics
- —
Market trends
- HPI YoY
- ▼ -11.63%
- Current HPI
- 156.4412
- Rent YoY
- —
- Metro
- —
- State GDP YoY
- ▲ 2.94%
- F500 in state
- 4
Industry mix (Fortune 500 HQ in AL)
| Industry | F500 HQs | Revenue |
|---|---|---|
| Financial Services | 1 | $8B |
|
||
| Healthcare | 1 | $5B |
|
||
Price history
+24.3% since first listed4 events — show timeline
- 2026-06-15 Listed $149,000 MAAR
- 2021-10-19 Sold (Public Records) $101,400 Public Records
- 2021-10-14 Sold (MLS) $101,400 MAAR
- 2021-08-30 Listed $119,900 MAAR
Property tax history
+14.1%/yrLatest (2025): $1,762 · +6.9% YoY. Source: county tax records.
Cash-flow waterfall
monthlySold comps — $/sqft
last 12 mo · ≤1 miLoading sold comps…